Bespoke’s Morning Lineup – 6/7/21 – Drifting into Positive Territory
See what’s driving market performance around the world in today’s Morning Lineup. Bespoke’s Morning Lineup is the best way to start your trading day. Read it now by starting a two-week free trial to Bespoke Premium. CLICK HERE to learn more and start your free trial.
“We contend that for a nation to try to tax itself into prosperity is like a man standing in a bucket and trying to lift himself up by the handle.” – Winston Churchill
Futures started off with a negative bias this morning but have been drifting higher all morning and are now modestly positive for both the S&P 500 and Dow, while the Nasdaq is just barely lower. Treasury yields are higher, but the 10-year yield is still well below 1.6%, and even bitcoin is following the lead of equities and moving further into positive territory. It was a mixed weekend for the crypto-currency as China appears to be cracking down on the space while El Salvador said it will recognize bitcoin as legal tender.
Read today’s Morning Lineup for a recap of all the major market news and events including a discussion of the Global Minimum Tax, a recap of activity in Asia and Europe, and the latest US and international COVID trends including our vaccination trackers, and much more.

With the S&P 500 inching closer to new highs last week, the majority of sectors also traded higher. With crude oil continuing to rally towards 52-week highs, the Energy sector surged nearly 7% taking its YTD gain to nearly 50%. Behind Energy, four other sectors were up over 1%, and there are now four sectors that are already up over 20% YTD. Talk about a strong year!
On the downside, only two sectors were down last week (Consumer Discretionary and Health Care). Consumer Discretionary is the only sector trading more than 1% below its 50-day moving average and one of just two sectors (Utilities being the other) that finished the week below that level.

Bespoke Brunch Reads: 6/6/21
Welcome to Bespoke Brunch Reads — a linkfest of the favorite things we read over the past week. The links are mostly market related, but there are some other interesting subjects covered as well. We hope you enjoy the food for thought as a supplement to the research we provide you during the week.
While you’re here, join Bespoke Premium with a 30-day free trial!
New Research
Why Do Borrowers Default on Mortgages? A New Method For Causal Attribution by Peter Ganong & Pascal J. Noel (NBER Working Papers)
What drives default on mortgages? The authors estimate that roughly 97% of all mortgage defaults take place because of an adverse shock which leaves borrowers unable to cover their monthly payment, not because they are strategically walking away from an LTV over 100. [Link; soft paywall]
How Teach for America Affects Beliefs about Education by Kathrine M. Conn, Virginia S. Lovison, and Cecilia Hyunjung Mo (Education Next)
TFA volunteers acquire a greater appreciation for societal inequality in educational under-attainment, reduces support for charter schools and vouchers, and raises optimism that an excellent education in the US is possible for all children. [Link]
Labor Markets
The Divergent Signals about Labor Market Slack by Troy Gilchrist & Bart Hobijn (FRBSF Economic Letter)
Using a broader snapshot of the labor market shows that on balance the U3 unemployment rate is roughly representative of where things currently stand…with the important caveat that dispersion across indicators is much higher than historically has been the case. [Link]
Restaurants, Supermarkets Can’t Find Enough Workers to Open New Locations by Jaewon Kang & Heather Haddon (WSJ)
Grocers and restaurants that rely on large pools of low-prerequisite labor are struggling to find enough workers to staff new locations. [Link; paywall]
Price Tags
Why dirt from Mars could be the most expensive substance known to mankind (Science Insider/Twitter)
Three different joint space missions are hoping to bring back a couple of pounds of soil from Mars at a price tag of more than $9bn, making it easily the most expensive way to grow tomatoes ever devised (note: that’s not what scientists will use it for). [Link]
Building a Home in the U.S. Has Never Been More Expensive by Marcy Nicholson, Dave Merrill, & Cedric Sam (Bloomberg)
A fascinating walk-through of how much prices have risen for key inputs to home construction. Lumber features prominently but many other costs have also soared. [Link; soft paywall]
Disease
Covid-19 Prevention Measures Are Keeping Childhood Diseases Like Chickenpox at Bay by Peter Landers & Miho Inada (WSJ)
While COVID and related responses have had lots of negative impacts on children, there are some positives: more handwashing, masks, and other non-pharmaceutical interventions have led to a collapse in case counts for diseases like flu, chicken pox, strep throat, and rotavirus. [Link; paywall]
Moderna to take mRNA flu and HIV vaccines into Phase 1 trials this year by Rachel Arthur (BioPharma)
The company behind one of the two mRNA vaccines that were first to market in the fight against COVID is starting Phase 1 trials for flu and HIV this year, with another vaccine against cytomegalovirus (which causes mononucleosis). [Link]
Matters of State
Shrinking California by Will Wilkinson (Substack)
In 2020 California’s population shrank by over 180,000 people, with an interesting array of implications for both that state’s politics and states where former residents of the Bear Flag Republic are heading to. [Link]
West Virginia Gov. Jim Justice Is Personally Liable for $700 Million in Greensill Loans by Julie Steinberg & Duncan Mavin (WSJ)
Companies owned by West Virginia’s two-term governor are on the hook for hundreds of millions in loans backed by coal receivables, and the financial liability may roll all the way up to the governor’s mansion. [Link; paywall]
Cheating
Inside The ‘World’s Largest’ Video Game Cheating Empire by Lorenzo Franceschi-Bicchierai (Vice)
A group that found exploits to Tencent’s Playerunkown Battlegrounds Mobile and sold them for millions ended up attracting the attention of Chinese police. [Link]
Read Bespoke’s most actionable market research by joining Bespoke Premium today! Get started here.
Have a great weekend!
Bespoke’s Morning Lineup – 6/4/21 – Last Call
See what’s driving market performance around the world in today’s Morning Lineup. Bespoke’s Morning Lineup is the best way to start your trading day. Read it now by starting a two-week free trial to Bespoke Premium. CLICK HERE to learn more and start your free trial.
“Public business, my son, must always be done by somebody. It will be done by somebody or other. If wise men decline it, others will not; if honest men refuse it, others will not.” – John Adams
If someone says that “you live in a bar,” the odds are that it’s not a compliment, but if you ever find yourself on the receiving end of that comment, you’re in good company. John Adams may not have been the first President of the United States, but he was the first President known to have taken up residence in a bar. On this day yesterday in 1800, President Adams moved into the Union Tavern in Georgetown while construction was being done on the White House. That means that on this day in 1800, President Adams became the first and only known sitting US President to ever wake up in a bar. There may have been others in the 220 years since, but to our knowledge, the lips of Secret Service agents have been sealed!
In market news this morning, US futures have moved into positive territory following the weaker than expected May Non-Farm Payrolls report, but the big move has been in the crypto space where bitcoin is down over 7% after Elon Musk tweeted a broken-hear emoji for the token. A 7% decline on an asset class worth about $700 billion over a tweet? If last year wasn’t 2020 and this year wasn’t 2021, we’d be surprised at a move like that.
Read today’s Morning Lineup for a recap of all the major market news and events including a recap of the RBI rate decision, economic data out of Europe, and the latest US and international COVID trends including our vaccination trackers, and much more.
Maybe it’s just because the topic is in the front of our minds lately, but it seems as though everywhere we look, the same rangebound pattern shows up. This morning’s example is the Russell 2000. All year now, the index has been in a relatively narrow range, and given the fact that the index closed yesterday right in the middle of that range, it doesn’t look like it’s going to break in one way or the other very soon.

Gun Sales Capped
FBI Background checks for the month of May were just recently disclosed, and just as many aspects of the economy and overall society are starting to return back to more normal levels following the disruptions caused by COVID, so too are gun sales based on the latest data. For the month of May, background checks fell from 3.51 million down to 3.22 million which is the lowest monthly reading since last September.
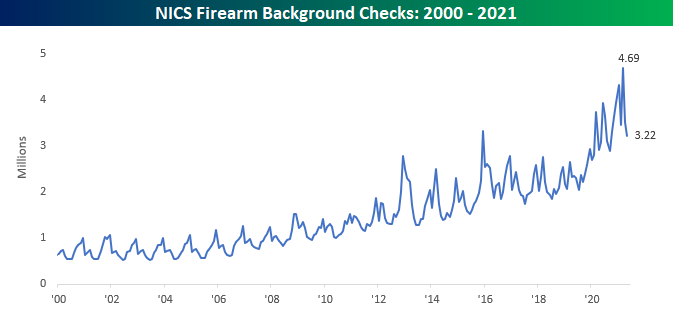
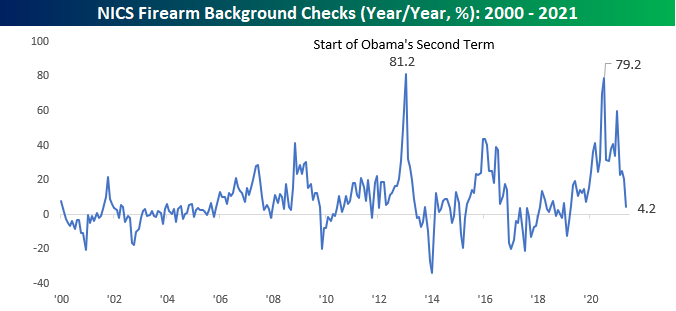
While the m/m decline in background checks wasn’t particularly extreme, the two-month rate of decline was the largest ever, falling by nearly 1.5 million.

With the declines in background checks, the y/y increase has really started to collapse. At 4.2%, the y/y change in background checks has dropped to its lowest level in more than two years (March 2019).
While the pace of gun background checks has been declining, the prices of gun stocks have actually been on the rise. Below we show the one-year price charts of Sturm Ruger (RGR) and Smith and Wesson (SWBI) which are the two publicly traded pure-play gun manufacturers. Both stocks surged late last spring and into the early summer following the George Floyd killing and subsequent protests and riots across the country, but they quickly pulled back in the summer months and traded relatively rangebound over the following six months. Since late April, though, both stocks have started to attract investor interest, and RGR is actually close to 52-week highs while SWBI is close to taking out its high from early this year. Click here to view Bespoke’s premium membership options.

Less Than 20% Bearish For the First Time in 115 Weeks
Bullish sentiment measured through the AAII weekly survey was at the lowest level since the fall last week, but after jumping 7.7 percentage points, it is now at the highest level since the end of April. Not only is it high relative to the past few weeks, but the increase also brings bullish sentiment 6 percentage points back above its historical average. Additionally, the week over week increase was the largest since the week of April 8th when the reading had risen 11.1 percentage points.
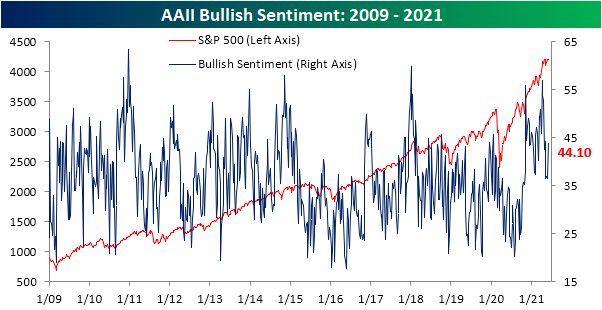
In recent weeks, neutral sentiment had been surging; topping 37% last week for the highest reading since the first week of 2020. Although it reversed lower this week down to 36.2%, neutral sentiment remains around some of the strongest levels in over a year.

With the pickup in bullish sentiment, bearish sentiment plummeted to 19.8% on a 6.6 percentage point decile; the largest since February. Falling below 20%, bearish sentiment took out its March and April lows and is now at the lowest level since January 2018.

Not only is that one of the lowest readings in bearish sentiment in recent history, but that drop below 20% brought to an end a 115-week long streak of readings in bearish sentiment above that level. As shown below, that surpassed a three-week shorter streak ending in December 2017 to make for the second-longest such streak on record. The longest streak which ended in December 2010 went on for more than twice as long as this most recent run.

Historically, lower readings in bearish sentiment have tended towards weaker performance for the S&P 500 going forward as shown below. But when it comes to the past times that bearish sentiment has broken below 20% for the first time in at least 50 weeks, performance has actually tended to consistently be positive. In fact, across each of the past six instances, the S&P 500 has been higher six months out every time. Granted, for the most part the typical move higher is usually smaller than other periods. Click here to view Bespoke’s premium membership options for our best research available.


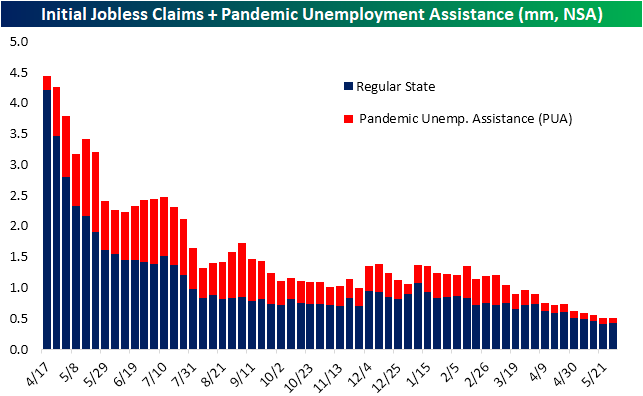
Initial Jobless Claims Now Below 400K
It was just the start of last month that initial jobless claims fell below a half million for the first time since the start of the pandemic and a month before that marked the first reading below 600K. Another month in the books and it was another 100K milestone reached this week. For the first time since the pandemic began, seasonally-adjusted claims fell below 400K to 385K this week. That is now only 129K above the pre-pandemic level from last March; the last week before claims exploded above a million.

While the drop below 400K may sound like a positive, it was entirely due to the seasonal adjustment as the actual level of claims rose to 425.5K from 419.4K. That is still at the bottom of the pandemic range albeit slightly off the lows. Additionally, while small, that week over week uptick is a bit unusual from a historical perspective as the current week of the year (22nd) has only seen a sequential uptick 18.5% of the time since the start of the data in 1967.
In spite of the uptick in regular state programs, claims through the Pandemic Unemployment Assistance program continued to pick up the slack. The program saw another impressive drop with the program only totaling 76.1K claims. That is down roughly 17.5K from last week and sets more pandemic lows. On a combined basis, initial claims between the two programs now sit just above 500K.
As we have frequently mentioned recently, while initial jobless claims keep coming in with impressive readings, continuing claims remain uninspiring. For the week ending May 21st, claims had risen by 169K to 3.77 million. That brings continuing claims to the highest level since the week of March 12 and the 169K WoW increase was the largest since the last week of November when they rose 254K. Overall, the picture at the headline level remains the same in which initial claims are strong and improving while continuing claims have hit a bump in the road.
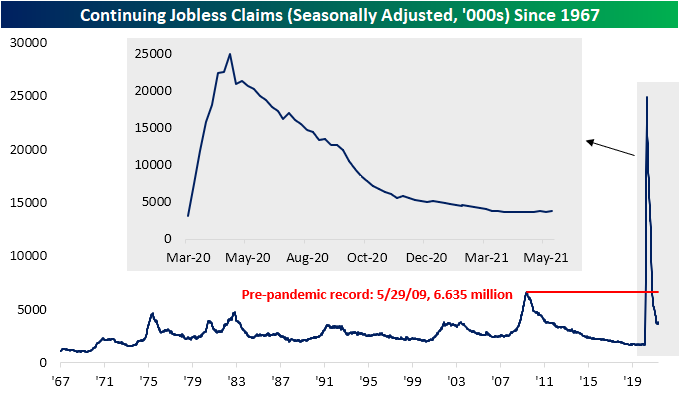
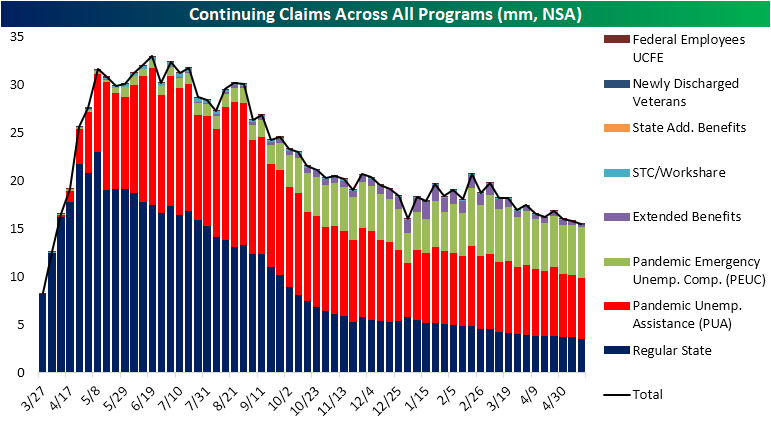
Whereas the non-seasonally adjusted picture was less positive for initial claims, there is yet another divergence compared to continuing claims. The NSA continuing claims reading that includes all programs is delayed two additional weeks to the most recent initial claims data. That means the most recent reading in the charts below is for the week of May 14th. That week saw another decline down to new lows of 15.46 million on a combined basis with the biggest contributors to that decline being regular state, PUA, and Extended Benefits programs. On the other hand, Pandemic Emergency Unemployment Assistance (PEUC) claims held things back as the program saw a 102K increase; bringing it to the highest level since mid-April. That meant PEUC claims’ share of total continuing claims reached the highest level yet at 34.2%. That means although regular state continuing claims have been deteriorating, the broader picture continues to improve. Click here to view Bespoke’s premium membership options for our best research available.

Bespoke’s Morning Lineup – 6/3/21 – Dose of Reality
See what’s driving market performance around the world in today’s Morning Lineup. Bespoke’s Morning Lineup is the best way to start your trading day. Read it now by starting a two-week free trial to Bespoke Premium. CLICK HERE to learn more and start your free trial.
“We caution you against investing in our Class A common stock unless you are prepared to incur the risk of losing all or a substantial portion of your investment” – AMC Entertainment
When a company files to sell more than 11 million shares of stock, you wouldn’t expect to see the above statement connected to the offering, but that’s what accompanied the news this morning from AMC Entertainment that it would be selling 11.55 million shares of stock. Did Yogi Berra write the offering documents? At a current share price of about $60, AMC will be able to raise $693 million in this equity offering. To put that in perspective, AMC’s market cap at the start of the year was less than half that at $302 million.
In markets this morning, it’s not looking like a positive day for equities. Futures have been drifting lower for much of the night, but the pace of declines accelerated right around 6 AM. Whether it was a coincidence or not, that also coincided with the release of news that Russia would cut its holdings of US dollar assets from its Sovereign Wealth Fund.
Read today’s Morning Lineup for a recap of all the major market news and events including a recap of some notable economic data out of Asia and Europe, a recap of moves in the crypto space, and the latest US and international COVID trends including our vaccination trackers, and much more.
Today kicks off a number of data reports for the week concerning employment, and after April’s weaker than expected Non-Farm Payrolls report, there will be a lot of attention on these numbers. The ADP Private Payrolls report kicked things off on a positive note as the headline number blew away expectations (although April’s reading was revised lower). Jobless claims were mixed relative to expectations with Initial claims slightly below forecasts and continuing claims coming in higher than forecasts. Layoff announcements from Challenger Gray and Christmas also were encouraging. Total job cut announcements came in at 24,586, which was slightly higher than last month’s reading of 22,913, but it was also the fifth lowest reading since at least 1999.

S&P 500 Returns Relative to History
May has moved back to the rearview mirror and with that, we wanted to provide an update on how current long-term returns for the S&P 500 stack up relative to history. The chart below compares the trailing one, two, five, ten, and twenty-year annualized total returns of the S&P 500 to the S&P 500’s historical average returns over those same time periods since 1928.
We’re starting to move away from the ‘easy comps’ in terms of market returns relative to the March 2020 lows, but the S&P 500 is still up more than 40% over the last 12 months which is nearly four times the historical average one year return. Over the last two years, the S&P 500’s annualized return of 25.8% still comes in at more than twice the historical average of 10.6%. On a five and ten-year basis, the S&P 500’s annualized gain also remains comfortably above 10%. All in all, the last decade has been very good for US equity investors. The only time period where the S&P 500 has experienced below-average returns is at the 20-year window where the 8.4% annualized gain clocks in at 2.5 percentage less than the historical average of 10.9%.
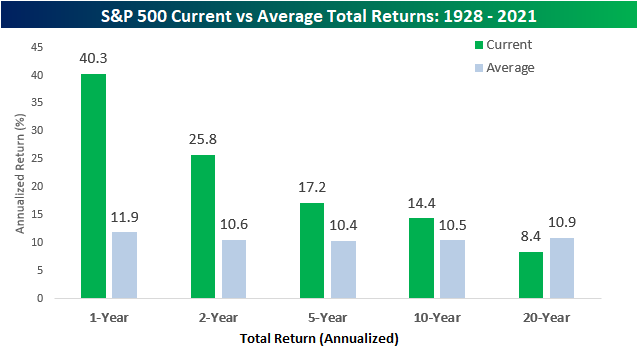
The chart below compares the S&P 500’s current returns over the last one, two, five, ten, and twenty years to all other periods on a percentile basis. With mostly above-average returns, it comes as no surprise that most of the percentile readings rank above the 50th percentile, and for most time periods, the percentile rank comes in well above 50%. The one-year total return of more than 40% actually ranks just above the 93rd percentile, while the two-year return isn’t far from the 90th percentile either. Moving further out, each of the other readings going out to ten years are all well above the 50th percentile. The only percentile rank below the 50th percentile is the 20-year window and that reading isn’t even close. On the one hand, the last ten years have been phenomenal for equity investors, but the last 20 years haven’t even been mediocre.

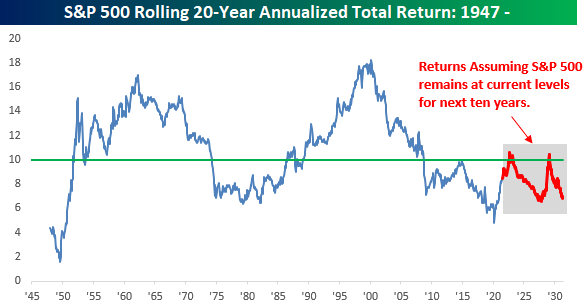
Throughout history, many investors have always worked under the assumption that long-term returns for the equity market are about 10%. History has shown that to be the case over the last decade at least, as the average annualized one-year gain of the S&P 500 has been well above 10%. With the S&P 500’s current 20-year annualized gain currently at just 8.4%, though, what will it take for the S&P 500 to reach double-digit gains on an annualized basis over a 20-year window?
For an idea, given the strong performance of the last ten years, a number of commentators suggest that the next ten years for equities will be weak with a reversion to the mean. Only time will tell, but if we operate under the (unlikely) assumption that the S&P 500 stays at the exact same level it is now going forward for the next ten years, its annualized twenty-year return would top 10% for the first time since August 2008 next September. After that brief period above 10% from September 2022 through March 2023, it wouldn’t again top that level until February 2029. In spite of the fact that the annualized 20-year return would top 10% in those two periods, though, it still wouldn’t get as high as the historical average of 10.9% in either of those periods. This reflects the fact that although the last ten years for US equities have been very strong, they also came shortly after one of the worst ten-year periods for US equities on record. Click here to view Bespoke’s premium membership options.
Bespoke’s Consumer Pulse Report – June 2021
Bespoke’s Consumer Pulse Report is an analysis of a huge consumer survey that we run each month. Our goal with this survey is to track trends across the economic and financial landscape in the US. Using the results from our proprietary monthly survey, we dissect and analyze all of the data and publish the Consumer Pulse Report, which we sell access to on a subscription basis. Sign up for a 30-day free trial to our Bespoke Consumer Pulse subscription service. With a trial, you’ll get coverage of consumer electronics, social media, streaming media, retail, autos, and much more. The report also has numerous proprietary US economic data points that are extremely timely and useful for investors.
We’ve just released our most recent monthly report to Pulse subscribers, and it’s definitely worth the read if you’re curious about the health of the consumer in the current market environment. Start a 30-day free trial for a full breakdown of all of our proprietary Pulse economic indicators.

Bespoke’s Morning Lineup – 6/2/21 – Small Lead
See what’s driving market performance around the world in today’s Morning Lineup. Bespoke’s Morning Lineup is the best way to start your trading day. Read it now by starting a two-week free trial to Bespoke Premium. CLICK HERE to learn more and start your free trial.
“Do not anticipate and move without market confirmation—being a little late in your trade is your insurance that you are right or wrong.” – Jesse Livermore
It’s a quiet morning as there’s little in the way of major economic releases today. There were a handful of earnings reports overnight from the likes of Advanced Auto (AAP), Hewlett Packard (HPE), and Zoom (ZM). Futures have been trading with a modestly positive bias all night and remain that way this morning. In politics, President Biden is scheduled to meet with Republicans today to try and reach some sort of consensus on infrastructure so we’ll be watching this afternoon for any updates on that front.
Read today’s Morning Lineup for a recap of all the major market news and events including a recap of some notable earnings reports, major economic data out of Asia and Europe, a discussion of the Chinese Property market, and the latest US and international COVID trends including our vaccination trackers, and much more.
Relative to where they opened yesterday, both the S&P 500 and Nasdaq had disappointing closes finishing near their lows of the day. The small-cap Russell 2000, however, was a different story. While it also experienced a small pullback from its opening levels in early trading, it rebounded and finished near its highs of the day.

From a longer-term perspective, yesterday’s late-day strength in the Russell 2000 sets the stage today for a test of its downtrend from the early March high as it closed yesterday just below its downtrend line. In pre-market trading right now, the Russell 2000 is slightly positive, so as long as those gains can hold, the technical picture for small caps will look incrementally better.
