Bespoke Brunch Reads: 10/17/21
Welcome to Bespoke Brunch Reads — a linkfest of the favorite things we read over the past week. The links are mostly market related, but there are some other interesting subjects covered as well. We hope you enjoy the food for thought as a supplement to the research we provide you during the week.
While you’re here, join Bespoke Premium with a 30-day free trial!
California
California moves toward ban on gas lawn mowers and leaf blowers by Phil Willon (LAT)
Gasoline-powered lawn equipment motors are extremely inefficient and produce shocking amounts of pollutants. California is responding by banning their sale (though operating them will still be legal in the state). [Link; soft paywall]
More than half of Bay Area residents plan to leave permanently: poll by Jordan Williams (The Hill)
As the saying goes, talk is cheap, and it’s a lot easier to grouse about where you live than actually leave, but there certainly are a lot of people near the Golden Gate who would rather be somewhere else. [Link]
Logistics
Crews Are Abandoned on Ships in Record Numbers Without Pay, Food or a Way Home by Drew Hinshaw and Joe Parkinson (WSJ)
Dozens of ships are being abandoned with their crews left unpaid and far from home as maintenance, left without resources to make their own way home from the locations their ships have in some cases literally washed up. [Link; paywall]
Amazon Seeks Used Long-Range Cargo Jets Able to Fly From China by Matt Day and Julie Johnsson (Bloomberg)
With passenger flights down sharply and therefore huge amounts of cargo capacity missing from the trans-Pacific trade network, Amazon is buying long haul jets in order to fill the gap and rush high value shipments from Asia to the US. [Link; soft paywall]
Biggest U.S. Retailers Charter Private Cargo Ships to Sail Around Port Delays by Sarah Nassauer (WSJ)
Large stores like Home Depot (HD), Costco (COST), and Walmart (WMT) are chartering their own ships in the hopes they can avoid the chaos in the freight forwarding industry and get goods to US consumers on time for the holidays. [Link; paywall]
Culture
Netflix’s ‘Squid Game’ Is Slammed by Kim Jong Un’s Propagandists as ‘Beastly’ by Dasl Yoon (WSJ)
The most successful Netflix show ever has drawn the ire of North Korean propagandists, who are spinning the show as a realistic depiction of South Korean society (it is not). [Link; paywall]
I Was a Lifelong Vegetarian. I Decided to Taste What I Was Missing by Rajesh Parameswaran (Bon Appetit)
When in Argentina, get a steak. That’s the upshot of this wonderful personal essay about breaking in to beef from the perspective of a lifelong vegetarian. [Link]
Manufacturing
How Morocco transformed itself into a carmaking hub by David Pilling (FT)
An unlikely powerhouse in the global auto manufacturing industry is Morocco, which produces more than twice as many cars as it purchases thanks to an aggressive industrial policy that has supported the development of car making infrastructure and value chains. [Link; soft paywall]
History
Christopher Columbus And The Replacement-Level Historical Figure by Patrick Wyman (Defector)
While Columbus is a culture war focal point in the US these days, the larger context of his role in history puts the lie to the idea that he was either a unique hero or a specific villain, as opposed to a direct product of his time and circumstances. [Link]
Astronomy
Dark matter’s shadowy effect on Earth by Michael R. Rampino (Astronomy)
One possible explanation for what appear to be periodic cataclysms throughout geological history is the influence of Earth’s passage through the central plane of the galaxy, an area that may be rife with dark matter and create increased likelihoods of major impacts or geological disasters. [Link]
Real Estate
Soaring Home Prices Are Roiling Appraisals and Upending Sales by Nicole Freidman (WSJ)
With home prices soaring, appraisers are skeptical, and many new home deals are falling apart as lenders balk at the prices their potential borrowers are agreeing to. [Link; paywall]
Pay To Play
Is Stock Index Membership for Sale? by Kun Li, Xin (Kelly) Liu, and Shang-Jin Wei (NBER)
This novel paper documents a relationship between companies purchasing credit ratings from Standard & Poors and their inclusion in the flagship S&P 500 index. [Link; registration required]
Labor Market
A Year After a Jobs Bust, College Students Find a Boom by Nelson D. Schwartz and Coral Murphy Marcos (NYT)
College seniors are finding lots of interest from employers as companies scramble to fill positions in a hot, high turnover labor market that has shifted the balance towards students who a year ago were staring into the abyss of a COVID recession. [Link]
Read Bespoke’s most actionable market research by joining Bespoke Premium today! Get started here.
Have a great weekend!
The Bespoke Report Newsletter – 10/15/21 – Whipping Up Worries Over Punchy Prices
This week’s Bespoke Report newsletter is now available for members.
Markets and economic data are starting focus more tightly on rising inflation. Energy prices are soaring, industrial metals are at record levels, and employers are faced with an avalanche of quits and job openings. But supply responses are underway, with oil rigs spinning up, natural gas output rising, and millions of Americans piling into the labor market to meet the demand for workers. Earnings are also starting off strong this season with much better results from Wall Street trading firms and less cost of credit from money center banks. Consumer goods are also rolling in from China as the bilateral trade deficit reported by that country this week. We discuss all of this and more in this week’s Bespoke Report.
To read this week’s full Bespoke Report newsletter and access everything else Bespoke’s research platform has to offer, start a two-week trial to one of our three membership levels.


Empire Fed Moderation
Last month, the New York Fed’s Empire Fed survey saw the index for General Business Conditions come in at the seventh-highest reading on record. With the most recent update this morning, the index showed significant moderation in the pace of activity. The index plummeted 14.5 points MoM which ranks in the bottom decile of monthly moves and is now in the 77th percentile of readings going back to the start of the survey in 2001.

The big drop in the headline index can be attributed to big drops throughout the report. New Orders, Shipments, Unfilled Orders, Prices Received, Number of Employees, and Average Workweek were all lower with those declines historically large. With that said, most indices remain at historically strong levels with only the headline number and Shipments not in the top decile of their historical ranges. Expectations also broadly remain at historically healthy levels.

Demand decelerated as New Orders fell 9.4 points to 24.3 and in turn, Unfilled Orders pulled back 2.4 points to 18.5. As previously mentioned, even though those declines were large, the current levels of these indices continue to sit in the upper 10% of all readings. Shipments are another story though. That index plummeted 18 points in October and is now only in the 38th percentile of historical readings.

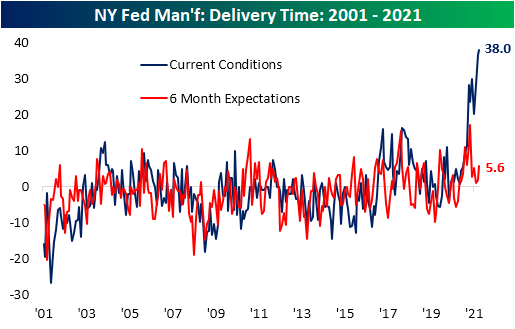
As for why Shipments stand out as a far weaker area of the report, supply chain issues can likely receive the blame and that is backed up with the index for Delivery Times setting yet another record high after three months of increases in a row.
Price pressures remain extremely elevated from a historical context. Prices Paid accelerated this month but remain off the record high from a few months ago. Prices Received, on the other hand, moved lower in October falling off of its record high.

Employment metrics also deteriorated this month with both the indices for Number of Employees and Average Workweek pivoting lower. With regards to the Number of Employees, New York area firms continue to appear to be exceptionally willing and optimistic on hiring with a very elevated, albeit rolling over, reading in 6-month expectations. Meanwhile, the current conditions index is more muted, but also at the high end of its historical range even after a falling 3.4 points this month. Average Workweek experienced a larger decline this month, but the index remains at a stronger level respective to its historical range. Click here to view Bespoke’s premium membership options.

Bespoke’s Morning Lineup – 10/15/21 – Priced In?
See what’s driving market performance around the world in today’s Morning Lineup. Bespoke’s Morning Lineup is the best way to start your trading day. Read it now by starting a two-week trial to Bespoke Premium. CLICK HERE to learn more and start your trial.
“Success usually comes to those who are too busy to be looking for it.” – Henry David Thoreau
There’s a decent amount of economic data on the calendar this morning with Empire Manufacturing, Retail Sales, and Import Prices just hitting the wires. Empire Manufacturing came in a bit shy of forecasts, but Retail Sales came in higher across the board. Not only that but August’s reading was also revised higher. While Import Prices aren’t as widely followed as CPI and PPI, the headline reading showed lower than expected increases.
The increase in risk appetite from yesterday appears to be in place again this morning as futures are firmly positive (and higher now then before the data hit) and interest rates are higher. Goldman earnings just hit and the headline numbers were all much better than expected and the stock is trading up nearly 2%.
Read today’s Morning Lineup for a recap of all the major market news and events from around the world, including the latest US and international COVID trends.
We’re seeing it again this morning where some companies are reporting weaker results or guidance citing the impact of supply chain issues, labor shortages, and inflation. Perhaps the biggest question heading into this earnings season is whether these issues, which are impacting just about every company out there, have been sufficiently priced into the market.
In looking at Google Trends search data for these three terms, it’s not as if they aren’t front and center. The chart below shows the frequency of search results for the three terms (Inflation, Labor Shortage, and Supply Chain) going back to 2004, and all three have spiked enormously this year to levels not seen in the history of the data. In the case of ‘labor shortage’ and ‘supply chain’ searches for these two terms hit a record this month.

Start a two-week trial to Bespoke Premium to read today’s full Morning Lineup.
Most Volatile Stocks on Earnings
As earnings season lurks around the corner, we took a look into the most volatile stocks on earnings that are reporting between now and the end of November, as we do ahead of each earnings season. These stocks have historically experienced the largest one-day moves in reaction to their earnings reports.
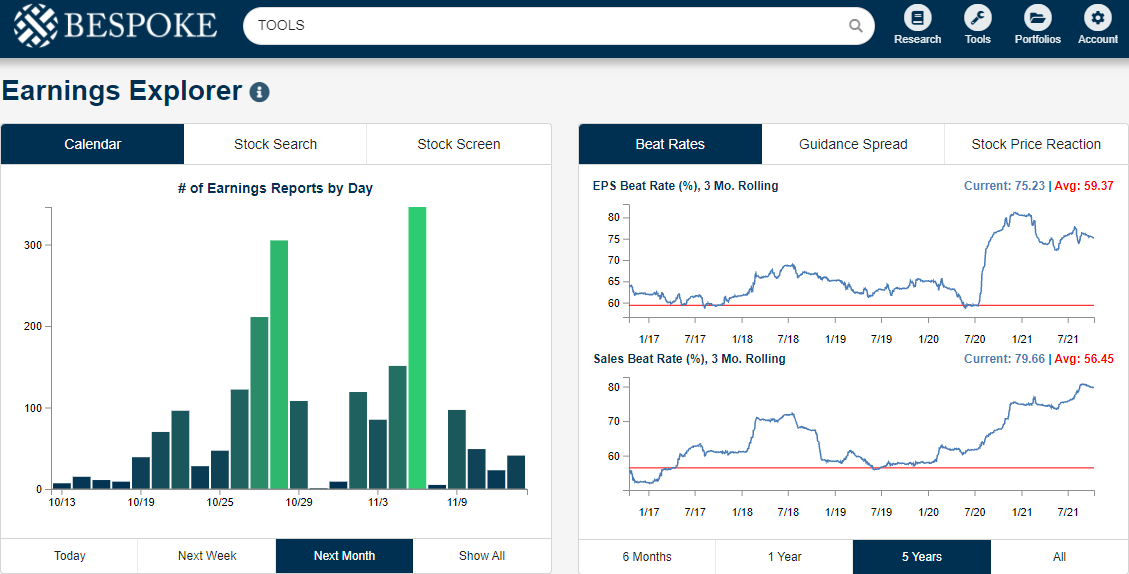
The number of daily earnings reports ramps up next week but doesn’t hit full-stride until two weeks from now, which is the end of October. Earnings season continues into the start of November as well. (You can track upcoming earnings reports and monitor earnings-related trends using our Earnings Explorer tool.)
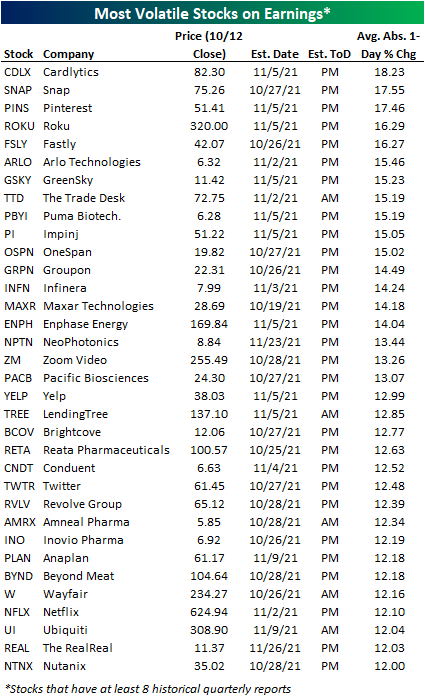
In the table below you will find the stocks that have historically seen the biggest share-price reactions to earnings that have at least 8 quarters (2 years) of earnings reports. On the trading day following their respective earnings reports, these companies have had the highest average absolute percentage change in share price. (For stocks that report before the open, we are looking at its one-day change on that trading day. For stocks that report after the close, we are looking at its one-day change on the next trading day.)
Of the companies reporting between now and the end of November, Cardlytics (CDLX) has the highest average absolute one-day change of +/-18.62%. Snap (SNAP) and Pinterest (PINS) have average one-day moves of over +/-17%. Roku (ROKU) and Fastly (FSLY) average one-day moves of over +/-16%. Other notable stocks on this list include The Trade Desk (TTD), Groupon (GRPN), Zoom Video (ZM), LendingTree (TREE), Twitter (TWTR), and Netflix (NFLX). All names on this list average one-day moves of over +/-10% on their earnings reaction days.
To show you the volatility of these names, let’s take a look at the earnings results for the top name of this list, CDLX. Below, you will see that the stock has typically seen dramatic moves on its earnings reaction days. Specifically, the stock has experienced the largest drawdowns when it has lowered guidance. The maximum one-day earnings drawdown since CDLX’s IPO was 36.7%. Conversely, its maximum upside was a gain of 42.9% back in November 2019. CDLX is heading into its upcoming earnings report on a two-quarter losing streak. On its earnings reaction day in May, CDLX fell 16.96%, while it fell 27.61% on its last earnings report in August.

The table below examines the most volatile stocks on earnings that have at least five years (20 reports) of quarterly reports. Over time, stocks tend to decrease in volatility around earnings because of the increase in available data points.
Of the stocks with at least five years of quarterly earnings data that are reporting between now and the end of November, The Trade Desk (TTD) has been the most volatile with average absolute one-day price movements of +/-15.19%. Impinj (PI) has averaged a move of over +/-15% as well. Groupon (GRPN), Infinera (INFN), and Enphase Energy (ENPH) follow with average price moves of over +/-14%. Other notable members of this list include Wayfair (W), iRobot (IRBT), Chegg (CHGG), and Crocs (CROX).

The top name on the list above, TTD, has had interesting earnings reactions and is far from predictable. Over the last 8 earnings periods, the company has beaten on EPS and revenues every single time, and it has only failed to raise guidance once. However, the stock dropped 26% after beating both EPS and sales and raising guidance back in May. The market seems to set its own expectations apart from the street for this name.

On the final list, we will only be looking at names that have at least 10 years (40 quarterly reports) of earnings history. Although these are well established companies, they still experience absolute average price moves of +/-10% on earnings reaction days.
The names at the top of this list are Infinera (INFN), Netflix (NFLX), WW (WW), iRobot (IRBT), and 3D Systems (DDD). Other notable names include First Solar (FSLR), Overstock.com (OSTK), Sketchers USA (SKX), Guess? (GES), and Green Dot (GDOT).
While all of the stocks listed on these tables have historically seen violent moves in reaction to earnings, there is of course no way to know whether the large moves will be to the upside or downside, so tread lightly!

The volatility leader of the above list, INFN, has experienced a lower level of volatility after its four most recent reports in comparison to historical averages. During the last four periods, INFN has averaged an absolute average one-day change of just under 4%. This is significantly below its overall average of +/-14.24% on its 56 historical reports dating back to 2007. Since the start of historical data, the stock has only booked four straight absolute one-day price changes of under 10% one other time, which occurred in the last three quarters of 2012 and the first quarter of 2013.

Two Big Banks Break Two Long Streaks
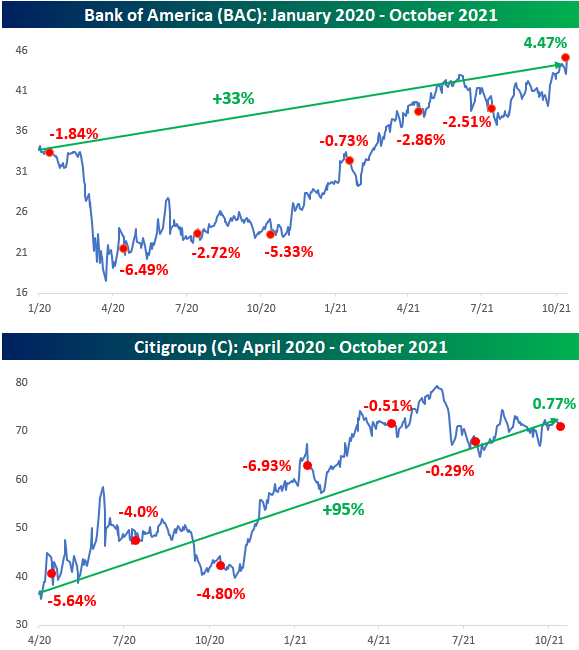
Earlier on Thursday, we noted how shares of JP Morgan Chase (JPM) had traded lower on their earnings reaction days for five straight quarters. Despite the string of weak short-term reactions to earnings, though, JPM has performed very well in the period encompassing this streak rallying more than 66% since the start of September 2020. While JPM’s streak of five straight negative reactions to earnings reports was impressive enough, two other big banks that reported on Thursday were riding even longer streaks of negative reactions to earnings. Heading into Thursday’s report, Bank of America (BAC) had traded lower in reaction to earnings for seven straight quarters while Citigroup (C) traded down for six straight quarters. In both cases, Thursday’s positive price reactions to their respective reports ended those streaks.
Like JPM, while both stocks have experienced very negative short-term reactions to their earnings reports, during the entire run of declines on their earnings reaction days, they have both rallied sharply. In the case of BAC, the stock has rallied 33% since the start of 2020 when its earnings losing streak began, while shares of C are up 95% since the start of April when its six-quarter streak began. In the case of Citi, in fact, it has actually outperformed the S&P 500 which is up 75% in that same span. As noted with JPM, the performance of these two stocks also suggests that a stock’s short-term reaction to earnings isn’t necessarily a good indicator of its longer-term outlook. Click here to view Bespoke’s premium membership options.
Double Digit Gain for Bullish Sentiment
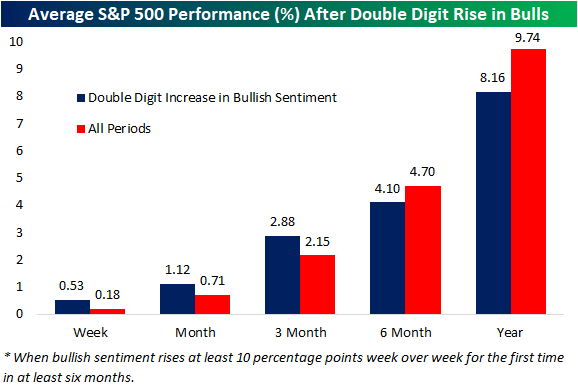
The S&P 500 has managed to put in a higher low in the past few days, and investor sentiment is reflecting the recovery in equity prices. The AAII’s weekly sentiment survey saw the percentage of respondents reporting as bullish leap 12.4 percentage points to 37.9%. That is only the highest level since September 9th, but it also marked the largest one-week increase in bullish sentiment since last November. The last double-digit increase was just over six months ago during the week of April 8th when it rose 11.1 percentage points.

The recovery in bullish sentiment this week leaves the reading essentially right in line with its historical average, but again it has been a while since bullish sentiment has experienced such a large increase. Going back through the history of the survey, there have been 43 other times in which bullish sentiment has risen at least 10 percentage points in a week without another occurrence in the prior six months. As shown below, those types of moves have typically been positive for short-term performance with the S&P 500 on average outperforming the norm one week, one month, and three months out. With that said, returns six and twelve months later have tended to see slightly weaker than normal returns.
With a big increase in bullish sentiment, bearish sentiment pulled back to 31.8%. That is the lowest level since the first week of September, and similar to bullish sentiment, it is not far off from the historical average. In other words, the size of the move was large but the level of sentiment is pretty unremarkable.

The inverse moves in bullish and bearish sentiment resulted in the spread between the two to move back in favor of bulls for the first time in a month. The one-week increase in the spread also tied the week of February 11th for the largest jump since last November.

Bullish sentiment appears to have borrowed more heavily from those formerly reporting as neutral. Whereas bearish sentiment dropped 5 percentage points week over week, neutral sentiment shed 7.4 percentage points. Again, that decline does not mark any notable low and is not far away from the historical average. Click here to view Bespoke’s premium membership options.

Claims Sub-300K
Initial jobless claims have continued to decline with this week’s reading falling to 293K from an upwardly revised reading of 329K last week. The 36K week/week decline was not only more than double the expected decline, but it was also the largest since a 48K drop at the end of June. Additionally, after this week’s decline, the seasonally adjusted number is now at the lowest level of the pandemic, only 37K above the levels from March 14, 2020. After revisions to prior weeks, this week also marks the first sub-300K reading since the pandemic began.

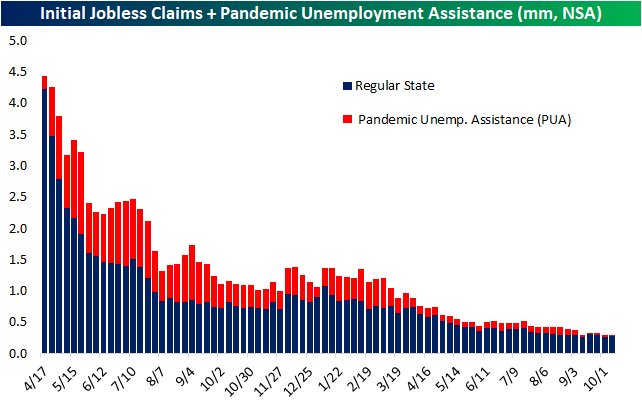
While seasonally adjusted claims were lower, unadjusted claims rose to 277K from 261K. A rise in regular state claims is very much the norm for the current week of the year with said week having historically observed claims rise WoW over three-quarters of the time going back to 1967. Before seasonal adjustments, claims have likely put in their seasonal low and will continue to trend higher into the end of the year. Additionally, with the end of enhanced benefit programs in early September, PUA claims have continued to drop off coming in at 21.62K this week. While at a nearly negligible level, that is still a few thousand off the low of 14.79K from the week of September 17th.

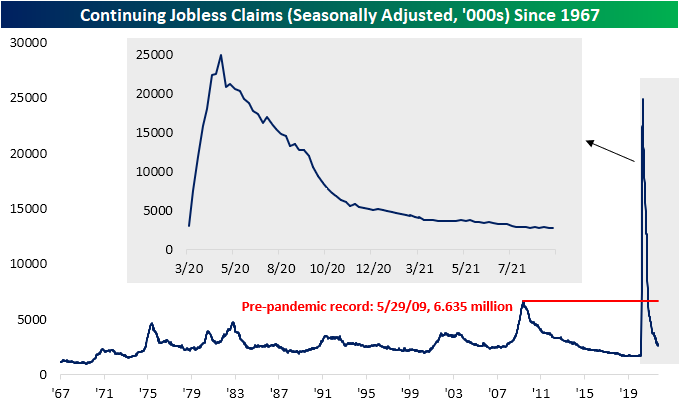
Continuing claims after seasonal adjustment likewise reached a new low of 2.593 million. This week’s 134K decline was the third week/week drop in a row and the largest of those weeks. That leaves claims 809K above the levels from right before the pandemic.
Tacking on all programs for continuing claims gives a more complete picture with the most recent data through the week of September 24th. Total claims across all programs totaled 3.66 million that week. Since the end of the support of pandemic era programs, total claims have now fallen by 7.6 million. Essentially the entirety of that decline is thanks to the massive drops in PUA, PEUC, and Extended Benefits programs as support has come to an end. In fact, since the first week of September (the last week before the expiration of enhanced benefits) regular state claims are actually higher by 26.4K whereas PUA, PEUC, and Extended Benefits programs have together fallen 7.616 million. Outside of regular state programs, PUA claims still account for the largest share of total claims with 549.1K claims followed by PEUC (440.4K), and the Extended Benefits (222.6K). With regards to Extended Benefits, throughout the summer we noted the volatile swings in that program. The teeter-tottering has appeared to have stopped for the time being as the program has now seen back-to-back significant declines from the 9/10 high of 431.3K. In other words, any oddities in that program’s data (potentially as a result of claimants switching from PUA or PEUC claims as their expiration ended) appear to be finally working themselves out. Click here to view Bespoke’s premium membership options.

Airline Passenger Traffic Back on the Ascent After a Weird August
After a surge in the first half of the year and into Summer which took the number of daily air passengers back to levels last seen before the pandemic, Americans started to pull back in their air travel from late July through early September. Much of this decline was likely seasonal in nature, but the rise of the COVID Delta variant likely played a role too, at least at the margin. After peaking out just shy of 2.1 million passengers per day, the average daily volume of travelers in the nation’s airports fell by nearly 25% through mid-September. Since that low a month ago, though, volumes have been on the rise, and average daily air passenger traffic over the last seven days is now only down 10% from its July high.

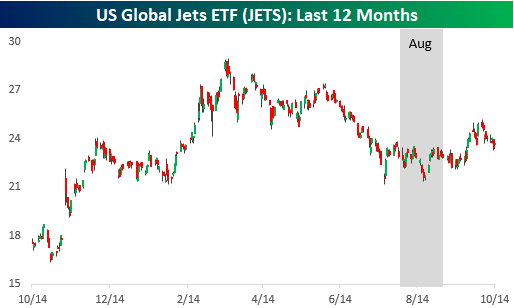
As air passenger traffic has picked up, it’s not surprising that the airline stocks have bounced a bit off their lows in August. The ETF which tracks the major airlines in the sector (JETs) has rallied more than 10% from its August low. It was also up as much as 18% earlier this month before crude oil prices topping $80 started to weigh on sentiment in the sector.
In looking at air travel trends on a monthly basis, one thing that stands out is just how strange of a month August was. The chart below shows the percentage of days by month that passenger traffic was up relative to its reading in the prior week. Back in March 2020 when air passenger traffic ground to a halt, every day saw week/week declines in passenger traffic. Coming off of a low base, these readings picked up in May and June as the panic started to subside, and throughout 2021, we continued to see steady levels of week/week increases in air passenger traffic. In five of the first seven months of 2021, at least half of all days saw air passenger traffic levels above their week-ago levels, and the two that didn’t (January and April) still had more than a third of all days show increases.
But then came August. Throughout the entire month of August, there was only one day (8/1) where passenger traffic was up week/week and from there the next 30 days were all lower. Granted, traffic levels were coming off of post-pandemic highs, but the fact that traffic levels were so steady to the downside implies that Americans just didn’t want to fly. While most people were sad to see the summer come to an end, thankfully for the country’s airlines, traffic picked up again in September, and October is now on pace to be the second straight month where passenger traffic levels have increased on a week/week basis on at least two-thirds of days. Click here to view Bespoke’s premium membership options.

Bespoke Morning Lineup – 10/14/21
See what’s driving market performance around the world in today’s Morning Lineup. Bespoke’s Morning Lineup is the best way to start your trading day. Read it now by starting a two-week trial to Bespoke Premium. CLICK HERE to learn more and start your trial.
Below is the intro text to today’s full Morning Lineup:
“It will fluctuate.” – J. P. Morgan
Futures were already strong heading into this morning’s economic data, and they remained strong after both jobless claims and PPI came in below forecasts. As things stand now, the major averages are indicated to open up by 1% or more. While yields aren’t changed all that much today, we would note that the 10-year yield has declined nearly 10 bps this week.
On the earnings front, bank earnings this morning have been strong, and most of them are trading higher in the pre-market. Overall, of the eleven companies reporting this morning, just two (Commercial Metals and Domino’s) missed EPS forecasts. Top line results versus consensus forecasts have been equally strong.
In what has become a trend for a lot of big banks, JP Morgan Chase (JPM) declined in reaction to its earnings report yesterday falling by 2.64%. Yesterday’s decline marked the 5th straight time that shares of JPM declined in reaction to earnings. While these weak reactions to earnings reports tend to cause a fair amount of near-term angst on the part of investors towards the stock, it’s important to focus on the big picture rather than the day-to-day squiggles. Despite a negative one-day reaction to each of its last five earnings reports, shares of JPM are up 66% since the start of last November.

Start a two-week trial to Bespoke Premium to read today’s full Morning Lineup.