Bespoke’s Morning Lineup – 11/4/21 – Jobless Claims Drop For 5th Straight Week
See what’s driving market performance around the world in today’s Morning Lineup. Bespoke’s Morning Lineup is the best way to start your trading day. Read it now by starting a two-week trial to Bespoke Premium. CLICK HERE to learn more and start your trial.
“The riskiest thing we can do is just maintain the status quo.“ – Bob Iger
Commodities are generally trading higher this morning, while treasury yields are lower. Equity futures are little changed but indicated higher as investors digest another busy batch of earnings reports since the close last night. Following the announcement of the taper yesterday afternoon, equities have taken the news, which was entirely expected, very well.
Economic data just released showed a larger than expected drop in initial and continuing jobless claims. Non-Farm Productivity was weaker than expected while Unit Labor Costs rose more than expected.
Read today’s Morning Lineup for a recap of all the major market news and events from around the world, including the latest US and international COVID trends.
Just like the US, stocks in Europe have consistently been hitting 52-week highs after breaking out above their Summer highs last week. Like the S&P 500, the STOXX 600 has been higher for five days in a row and is on pace for its sixth straight day of gains today. While the STOXX 600 has been performing in line with the S&P 500 on a nominal basis, after adjusting for the changes in the dollar, US stocks have been steadily outperforming in recent weeks. The chart below shows the relative strength of the S&P 500 vs the STOXX 600 (in dollar terms) over the last year. While stocks in Europe were outperforming the S&P 500 for the first half of 2021 (falling line in the chart below), ever since June, it has been US stocks that have been leading.

Start a two-week trial to Bespoke Premium to read today’s full Morning Lineup.
Love For The Taper
In today’s Chart of the Day, we provided a rundown of the S&P 500’s historical intraday pattern on Fed days. Now that the trading day has come and gone, we have added today’s price action into the mix as well.
Below is a look at the average path that the S&P 500 has taken on Fed days since 1994 when the Fed first began announcing its policy decisions on the same day as its meeting.
For the entire data set of Fed days since 1994 (dark blue line), the S&P has historically trended higher throughout the day with only a small dip in the immediate aftermath of the 2 PM ET announcement.
Since Powell became Fed chair in early 2018, the intraday action has been quite a bit different (red line). Especially early on in Powell’s tenure, the S&P had a pattern of posting solid intraday gains prior to the 2 PM announcement but then trading sharply lower during the Fed press conference into the 4 PM ET close.
The opposite pattern emerged today. Instead of trading higher heading into the 2 PM announcement, the S&P was in the red all day leading up to the Fed release. At 2 PM when the Fed statement came out (including the official announcement of tapering asset purchases), the S&P got an initial jolt and traded into positive territory. Then when Powell’s presser began, the S&P saw another intraday jump and then it continued to rally into the close. Had Powell known that the taper would cause this type of reaction, maybe he would have done it sooner! Click here to view Bespoke’s premium membership options.

Avis (CAR) Takes The Wheel Of The Transports
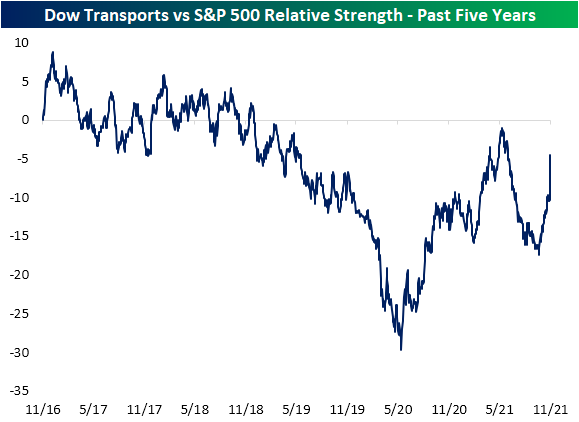
In an earlier post, we highlighted the relative performance of one of the key industries used to gauge broader economy/market health: the semis. As for another—perhaps more old school—cohort of stocks considered to be a leading group acting as a barometer for the broader economy, the Dow Transports have seen some interesting moves this week. In the chart below, we show the relative strength line of the Dow Transports versus the S&P 500 over the past five years. On a relative basis, the group has generally underperformed over the past few years, but more recently the relative strength line has been headed higher. Yesterday alone, though, it received a massive boost.
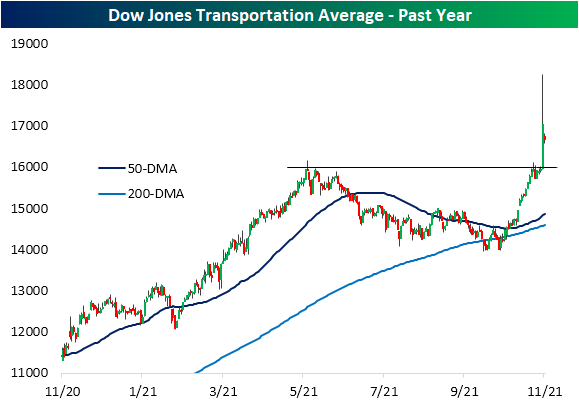
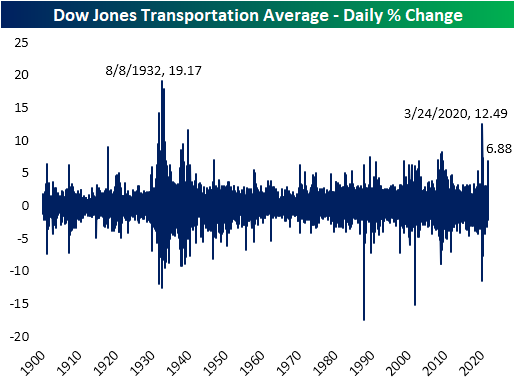
Heading into yesterday, the index was hovering right around resistance at the spring highs. It then surged 6.88% which not only smashed through that resistance but was the largest single-day gain since 5/18/20. The Dow Transports have a very long history going back to the late 1800s. As for just how impressive yesterday’s move was, since 1900 there have been less than 50 other days with as large of a single day gain. And at the intraday high, the Transports were up an even more impressive 14.5%.
The index’s massive gains can be chalked up to a single name: Avis Budget (CAR). The car rental stock more than doubled yesterday on better than expected earnings, and potentially there were some short squeeze factors at play as the stock had 29% of shares sold short as of mid-October. As we noted last week when that data was released, that placed CAR as not only the most heavily shorted Transport stock but the most heavily shorted stock of the whole S&P 1500.
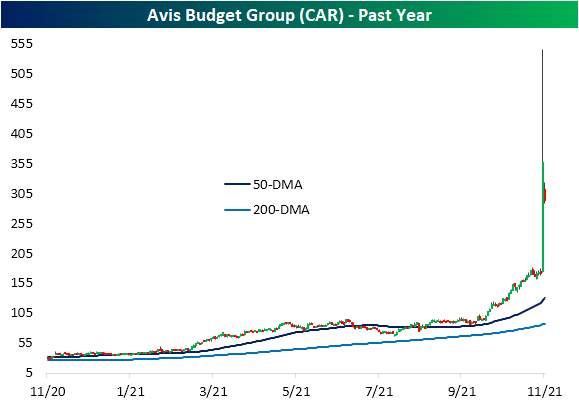
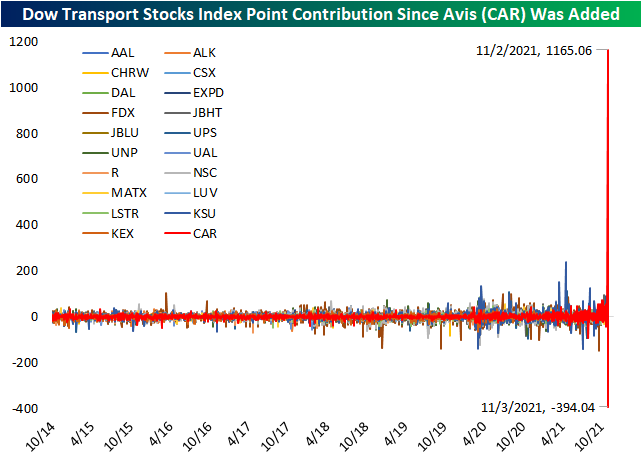
The Dow Transports is a price-weighted index, meaning that stocks with higher prices per share have larger impacts on the index. After doubling in a single day yesterday and even after falling well over 18% today, CAR is now the second highest-priced stock in the Dow Transports behind Kansas City Southern (KSU). Prior to earnings, CAR ranked as the eighth highest priced stock in the group. The massive move in the past few days has resulted in CAR contributing far more to the moves in the Dow Transports than what is normal. As for how large of an impact the past couple of sessions have had, below we show the daily point contribution of each member since October 2014 when CAR was added to the index—CAR is one of the most recent additions with the only newer members being United Airlines (UAL) in 2018 and American Airlines (AAL) in 2015. The extremely volatile moves of the stock paired with what is now a high price point relative to the rest of the index has resulted in the stock having major impacts on the day to day moves of the Dow Transportation index. Click here to view Bespoke’s premium membership options.
New High in Semis, But Not Relatively Speaking
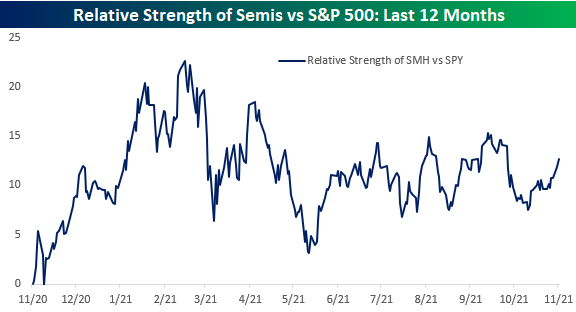
Given their ubiquity in just about every aspect of our lives, the performance of semiconductor stocks provides a great barometer for the health of the economy. Therefore, yesterday’s new high in the VanEck Semiconductor ETF (SMH) was an encouraging sign for the broader economy.

While prices, on an absolute basis, are at new highs, semiconductors haven’t been nearly as strong relative to the performance of the broader market. The chart below shows the relative strength of SMH versus the S&P 500 ETF (SPY) over the last 12 months where a rising line indicates outperformance on the part of the semis and a falling line indicates underperformance. After closing out 2020 on a strong note and continuing that strength right up through the first two months of the year, semiconductors had a rough three months on a relative basis through May and have been moving pretty much in line with the S&P 500 ever since. One notable aspect of the sector’s relative strength has been that despite the new high in the broader market, the relative strength of semis is not only well off its high from earlier in the year, but still hasn’t even surpassed the recent peak levels from early August and early September. A move above those levels would be a positive development for the group.
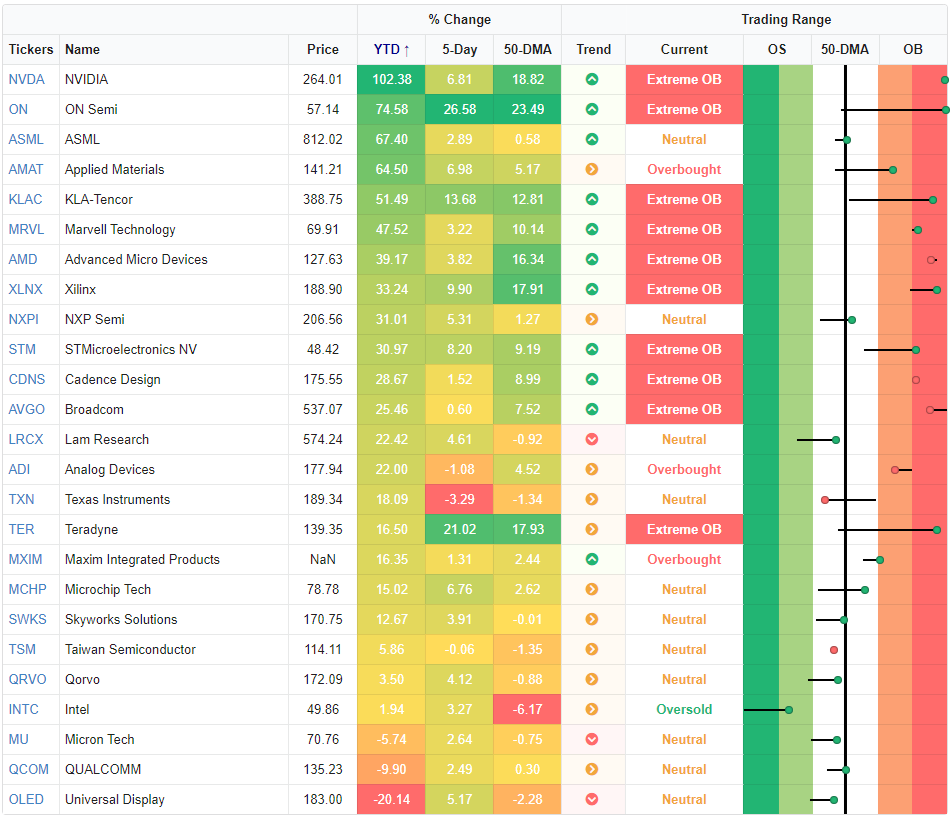
The table below lists the holdings of SMH and shows each one’s performance YTD and over the last five trading days, as well as where they closed on Tuesday relative to their 50-day moving averages (DMA). On the right side of the table, we also show where each stock is currently trading relative to its trading range. Whether you look at the performance of individual stocks on a YTD basis or where they are trading relative to their trading ranges, there hasn’t been a strong degree of uniformity in the group. On a YTD basis, returns for stocks in the ETF range from a gain of 102% for NVIDIA (NVDA) to a decline of over 20% for Universal Display (OLED). Furthermore, just 12 of the 25 companies listed below have outperformed the S&P 500 YTD. On a more short-term basis, performance has been just as uneven with ten stocks up over 5%, 12 stocks up less than 5%, and three stocks that are down. Click here to view Bespoke’s premium membership options.
Bespoke’s Consumer Pulse Report – November 2021
Bespoke’s Morning Lineup – 11/3/21 – It’s Taper Time!
See what’s driving market performance around the world in today’s Morning Lineup. Bespoke’s Morning Lineup is the best way to start your trading day. Read it now by starting a two-week trial to Bespoke Premium. CLICK HERE to learn more and start your trial.
“It’s amazing what you can accomplish if you do not care who gets the credit.” – Harry S. Truman
It’s Taper Time. At least that’s what most investors are expecting to hear this afternoon when the FOMC releases its policy statement and chair Powell holds his press conference. The only questions now seem to be when it will start and how long it will take to completely wind down. A delay in the start to December would be considered dovish at the margin while any plan to wind asset purchases down in less than six months would be taken as a hawkish stance. In addition to asset purchases, investors will be looking for signs of when Powell and the FOMC is thinking the first rate hike will take place (the current assumption is for the end of 2022).
Outside of the FOMC, the October ADP Private Payrolls report came in better than expected, and ISM Services will be released at 10 AM. Besides the economic and earnings flow. throughout the day, market watchers will be trying to assess what impacts last night’s election results will have on policy coming out of Washington.
Read today’s Morning Lineup for a recap of all the major market news and events from around the world, including the latest US and international COVID trends.
With a number of major averages hitting record highs yesterday, one area of financial markets that has been taking a breather over the last week is commodities. Of the commodity-related ETFs in our Trend Analyzer, every single one of them with the exception of the DB Agriculture Fund (DBA) has traded down over the prior week ending Tuesday. The weakest of these commodity-related ETFs is the US Natural Gas Fund (UNG) which has declined more than 7% while another six are down more than 1%. Despite the recent weakness, though, it’s important to keep in mind just how well many of these ETFs have performed in 2021. UNG is still up more than 100% YTD while other energy-related ETFs are up more than 70%.
The laggards this year have been precious metals. Silver (SLV) is down by double-digit percentages YTD, the Precious Metals ETF is down over 8% and gold-related ETFs are all down between 6% and 8%.

Start a two-week trial to Bespoke Premium to read today’s full Morning Lineup.
Record Decline in Gun Sales Continues
FBI background checks for the purchase of firearms continued their record streak of month/month (m/m) declines in October, falling from 2.626 million down to 2.593 million. Over the course of just seven months now, background checks have dropped by just over 2 million, or 44.8%, but even after that historic decline, total background checks remain above the upward trend they maintained in the 10+ years preceding COVID. While not typically viewed as a gauge of sentiment, one could make the argument that the steep declines in background searches required for gun purchases signals that levels of uncertainty on the part of Americans have been easing. After all, you’re probably less likely to go out and buy a gun when you’re feeling safe and secure!
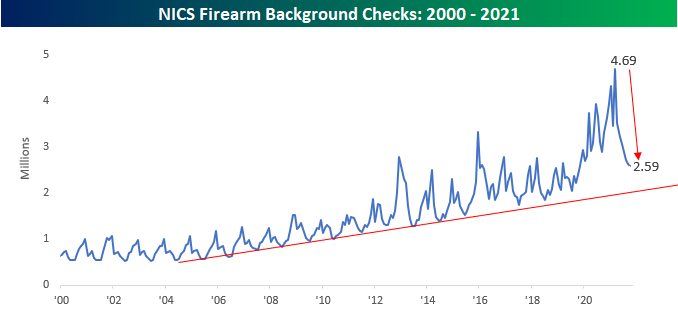
On a y/y basis, total background checks are down just over 20% and near their lowest levels since early 2014. Similar to the period leading up to the current decline, total background checks during that period followed what had been a record y/y surge after President Obama was elected to a second term.

As mentioned above, claims have now declined on a m/m basis for seven straight months. Over the last 20+ years, this is now the longest streak of monthly declines, surpassing the prior record of six months from June 2013.

With the pace of background checks crashing back down to earth in the last several months, you would expect to see the stocks of gun manufacturers struggling, and to a degree, you’d be right. Both Sturm Ruger (RGR) and Smith and Wesson (SWCI) are well off their highs from the middle of the year, but they’re also not trading near 52-week lows either. RGR continues to trade above support despite looking like it’s starting to roll over at a lower high. SWBI briefly surged close to $40 in early July before quickly reversing, and while the stock hasn’t participated in the recent market rally, the pace of decline has certainly slowed. Click here to view Bespoke’s premium membership options.

Bespoke’s Morning Lineup – 11/2/21 – Mixed Morning
See what’s driving market performance around the world in today’s Morning Lineup. Bespoke’s Morning Lineup is the best way to start your trading day. Read it now by starting a two-week trial to Bespoke Premium. CLICK HERE to learn more and start your trial.
“Don’t worry about failure; you only have to be right once.” – Drew Huston
Futures are mixed this morning as the S&P 500 is indicated to open marginally higher and the Nasdaq is looking to open lower. Interest rates are firmly lower at the front end of the curve and most commodities are lower. Bitcoin was flat for most of the night, but then saw a quick 3% rally right around 6 AM Eastern. The economic calendar is light today, but there are still plenty of earnings reports on deck for after the close.
Read today’s Morning Lineup for a recap of all the major market news and events from around the world, including the latest US and international COVID trends.
As the Fed begins its two-day policy meeting where it is widely expected to announce a tapering of its asset purchases, the long end of the treasury curve has remained extremely calm. While there was a bit of jump in yields in late September and into early October, the move higher ran out of steam right at its downtrend line and has now nearly made a roundtrip back to where it was to begin with.

Start a two-week trial to Bespoke Premium to read today’s full Morning Lineup.
Bespoke Market Calendar — November 2021
Please click the image below to view our November 2021 market calendar. This calendar includes the S&P 500’s average percentage change and average intraday chart pattern for each trading day during the upcoming month. It also includes market holidays and options expiration dates plus the dates of key economic indicator releases. Start a two-week free trial to one of Bespoke’s three research levels.

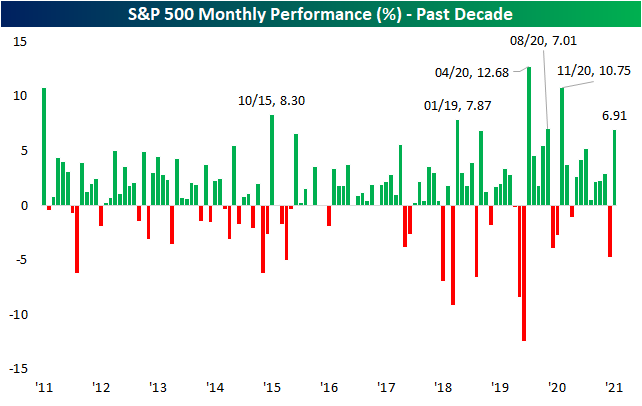
Strong Months Beget Strong Months
The S&P 500 capped off the month of October with further gains and more record highs. The month of October saw the S&P 500 rise 6.91%. Over the last decade, there have only been six months with as large of gains as October 2021. November of last year was the last of those months when the index rose 10.75%.
Going back through the history of the index, there have been 166 months on record in which the S&P 500 has rallied at least 5% during the month. On average, the first day of the following month has tended to outperform the first day of all months by 8 bps with positive performance 55.4% of the time. Similarly, the performance of the index over the whole next month has also tended towards outperformance with an average gain of 0.87% (positive performance 65.1% of the time) versus 0.64% for all months. Click here to view Bespoke’s premium membership options.
