Reversals
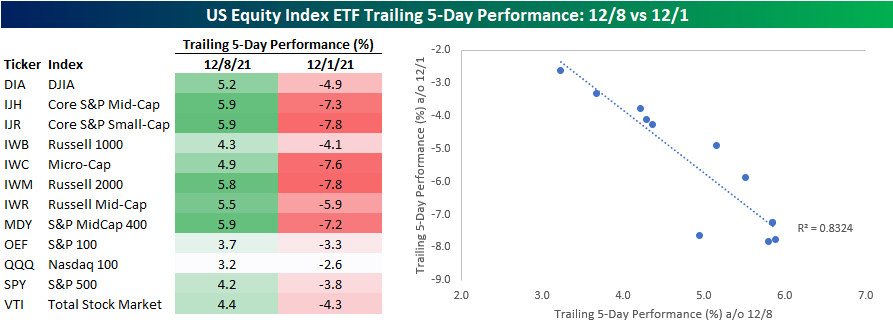
Earlier today in our Morning Lineup, we highlighted the fact that there has been a pretty remarkable about-face in market performance at the index level between now and a week ago. The table below compares the trailing 5-day performance of the major index ETFs as of the close on 12/8 versus the trailing 5-day performance as of the close on 12/1. Whether you look at the table or chart, it’s pretty clear to see that performance over the last five days has been directly related to performance in the week prior. Indices that were down the most last week have bounced back the most this week, and indices down the least last week are up the least this week. With an r-squared of 0.8324, you can’t get much more closely correlated than that.
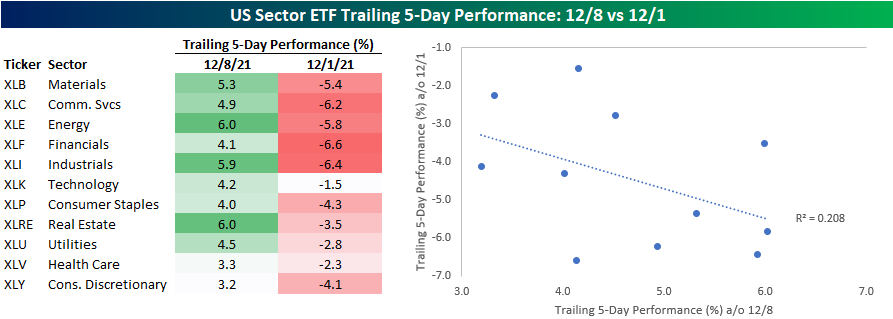
While there has been a close correlation between performance at the index level, at the sector level, the relationship — while still positive — hasn’t been nearly as strong. While some of the biggest losers in the week ending 12/1 like Industrials and Energy have been among the biggest winners over the last week, a sector like Real Estate that actually outperformed the S&P 500 in the week ending 12/1 is also one of the top-performing sectors over the last week. Additionally, Financials was the worst-performing sector on the way down last week with a decline of 6.6%, but it has also underperformed on the way up this week. As a result, while the r-squared of performance at the index level has been +0.83, the r-squared of performance at the sector level has been much lower at just +0.21. Click here to view Bespoke’s premium membership options.
Bespoke’s Morning Lineup – 12/9/21 – Then Again
See what’s driving market performance around the world in today’s Morning Lineup. Bespoke’s Morning Lineup is the best way to start your trading day. Read it now by starting a two-week trial to Bespoke Premium. CLICK HERE to learn more and start your trial.
“Indecision may or may not be my problem.” – Jimmy Buffett
After a strong start to the week, investors are taking a step back from buying this morning as futures are firmly negative and have been gradually weakening all morning. Following big losses right after Thanksgiving and then a sharp rebound over the last week, investors can’t seem to make up their minds.
The biggest news item of the day so far has been initial jobless claims which fell to an unheard of 184K which was well below the already low estimate of about 225K. As equities pull back, treasuries have been rallying with the 10-year yield back below 1.5%. The big economic data in the US will come tomorrow with the release of November CPI, but overnight in China, CPI came in weaker than expected on a y/y basis (2.3% vs 2.5% forecast).
Read today’s Morning Lineup for a recap of all the major market news and events from around the world, including the latest US and international COVID trends.
What a difference a week makes. Looking at how sector performance has changed over the last week provides a perfect illustration of indecisiveness in the equity market. The first snapshot below is from our Trend Analyzer from a week ago today (through the close on 12/1). At the time, every major index ETF was down at least 2.5% over the prior five trading days with the majority below their 50-day moving averages after trading at or near overbought levels just a week earlier. Mega-cap indices like the Nasdaq 100 (QQQ) and S&P 100 (OEF) were holding up best at the time while small and mid-cap stock indices were down over 7% in the span of just five trading days.

Fast-forwarding just a week, the picture has completely changed. Now, every major index ETF in the Trend Analyzer is up at least 3% over the last five trading days, and the majority are back above their 50-day moving averages. Leading the way higher, the same indices that were down the most have bounced back the greatest while mega-cap indices like the Nasdaq 100 (QQQ) and S&P 100 (OEF) are the only two that are up less than 4% over the last five trading days.

Start a two-week trial to Bespoke Premium to read today’s full Morning Lineup.
Performance by Region
The US has had an incredibly strong 2021, especially when considering the headwinds the economy faced. Supply chain constraints, labor challenges, inflation, energy shortages, high oil prices, and new COVID variants all hindered the global economy this year. Nonetheless, since the start of the year, the SPDR S&P 500 ETF (SPY) has rallied over 25% YTD. While the US has been able to withstand the many headwinds, the same can’t be said for the rest of the world. The average performance for all of the other regions we looked at (Europe, Australia, Africa, Asia, and Latin America) was a loss of 3.4%. In 2021, there has been a huge divergence between the performance of developed markets and emerging markets. The US, Europe, and Australia have seen YTD gains of 15%+, while Africa, Asia, and Latin America have all seen pretty sizable declines. The US is on track to outperform both the rest of the world and emerging markets for the fourth consecutive year. Click here to view Bespoke’s premium membership options.

Job Openings Surge
The BLS released October results of the Job Openings and Labor Turnover Survey this morning showing a significant uptick in job openings. Openings totaled 11.03 million in October, slightly below the record of 11.098 million from this past July. Openings rose by 431K month over month which ranks as the biggest one-month uptick since July and is in the 94th percentile of all monthly moves.

While the JOLTS data is insightful, it is released at a decent lag. Job listings website Indeed, however, offers a higher frequency (daily) dataset with more up-to-date readings with the latest data available through November 26th. As we discussed ahead of the JOLTS release in last night’s Closer, postings through this reading have been hitting new highs and are 57% above the February 2020 baseline reading. That comes with acceleration in new postings being put up on the site throughout the fall, but especially so in recent weeks.

Indeed also offers a breakdown based on industry. As shown below, there are four industries that currently have postings that are twice as high as they were pre-pandemic. Ironically, given the fair degree of labor market slack, the human resources sector continues to top the list with postings almost 120% above the baseline level. Loading & Stocks, Production & Manufacturing, and Software Development are the other most in-demand industries through late November. The other end of the spectrum continues to include many reopening sensitive areas like Hospitality and Tourism (which has also been on the decline in recent weeks as shown in the next chart below), though, these too are now all above baseline levels.
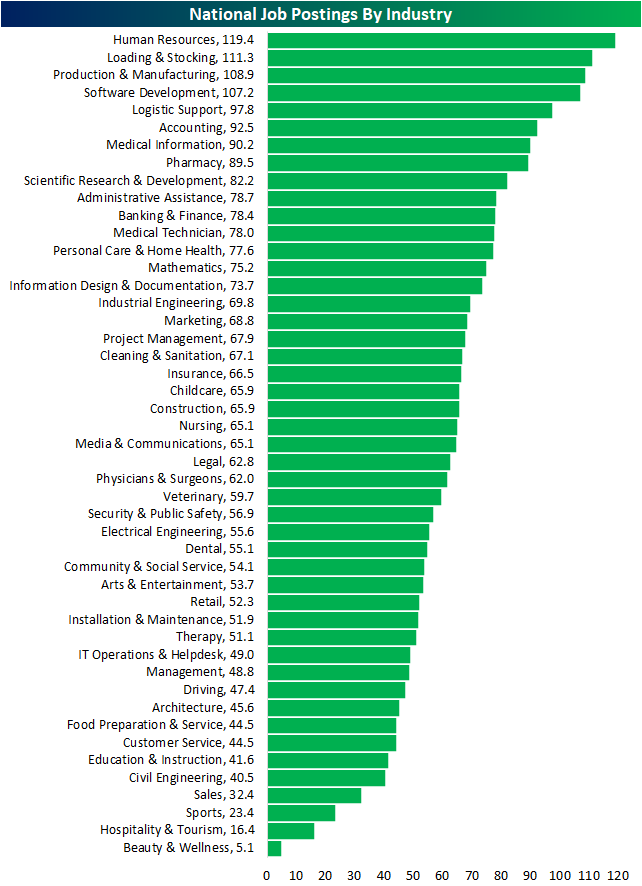
As previously mentioned, Hospitality and Tourism have seen a decline in postings recently likely as a result of rising case counts. Noting a few other industries, Banking & Finance, Construction, Cleaning & Sanitation, and Food Preparation & Service have all seen an acceleration in postings. Click here to view Bespoke’s premium membership options.

Breezy Does It – Chicago Home Prices the Last to Take Out Prior Bubble Highs
The S&P Case Shiller home price indices for September 2021 were released recently and showed that home prices nationally are now up 47% from their prior highs made during the housing bubble of the mid-2000s. And notably, all 20 of the individual cities/regions tracked by S&P Case Shiller have now eclipsed their prior housing bubble highs now that Chicago has finally moved above its prior high from September 2006. As shown below, home prices in Chicago are now 1% above those September 2006 levels.
Two cities — Dallas and Denver — have home price levels now that are 100%+ above their mid-2000 highs. Five more cities are up at least 50% from their prior housing bubble highs — Seattle, Portland, Charlotte, San Francisco, and Boston.

You can see Chicago home price levels based on the S&P Case Shiller indices just barely eclipsing their prior highs in the chart below:

The pandemic has of course been a huge boon for home prices across the country. Below is a look at how much home prices are up versus levels seen in February 2020 just prior to COVID. Prices in Phoenix are up the most post-COVID at 45%, followed by San Diego and Tampa at 35%. Las Vegas, Charlotte, Miami, Dallas, and Seattle have all seen prices rise by 30%+, while the remaining cities are all up between 19% and 27%. Chicago, New York, and DC have seen home prices rise the least, but even these three cities are up ~20% since COVID hit. Like this type of analysis? See more of it with a Bespoke Premium membership. Click here to learn more and start a two-week trial.

Bespoke’s Morning Lineup – 12/8/21 – Booster Boost
See what’s driving market performance around the world in today’s Morning Lineup. Bespoke’s Morning Lineup is the best way to start your trading day. Read it now by starting a two-week trial to Bespoke Premium. CLICK HERE to learn more and start your trial.
“Change is the investor’s only certainty.” – Thomas Rowe Price Jr.
The pre-market tone for equities was flat to negative early, but a report from Pfizer (PFE) showing that three doses of its COVID vaccine were able to neutralize the Omicron variant sent futures notably higher. That boost has proved to be somewhat temporary, though, as futures have given up half of their earlier gains. With all the volatility we have had in the market lately, at this point, the most constructive activity we could see in markets today would be a quiet session for a change. Yesterday, the Russell 2000 had its 5th straight day of daily moves of more than 2%, and while the index traded back above its 200-DMA on an intraday basis, it wasn’t able to hold on to those levels into the close.
It’s another light day of economic data today as the only report on the calendar is the JOLTS report at 10 AM. Economists are expecting to see total job openings in excess of 10 million.
Read today’s Morning Lineup for a recap of all the major market news and events from around the world, including the latest US and international COVID trends.
On the Wednesday before Thanksgiving, the VIX traded as high as 20.96 intraday before closing the session at 18.58. The following Friday, it spiked as high as 28.99 on the emergence of the Omicron variant and continued higher the following week hitting an intraday high of 35.32 last Friday. This week has been another story for volatility, though, as the VIX has been in retreat finishing the day yesterday at 21.82. While still well above where it closed on the Wednesday before Thanksgiving, the VIX is currently within a point of its intraday high on the day before Omicron entered the lexicon.

Start a two-week trial to Bespoke Premium to read today’s full Morning Lineup.
Russell 2000 2% Spreads Between Intraday Highs and Lows
The Russell 2000 tracking ETF (IWM) has been particularly volatile as of late, and as of yesterday’s close, there have been seven straight trading days in which there was a 2% spread between the intraday high and low. A streak of seven had not been reached since July 2020 (7/2), and the current streak is tied for the longest since 6/22/2020. During the COVID correction, this streak of 2% intraday ranges actually reached 41 days, which was then followed by two streaks of nine trading days in the spring and summer. While the Russell 2000 is up sharply again today, because it gapped higher, the streak is likely to end at seven trading days unless IWM trades below $221.45 or above $226.64.

IWM has only had a streak of 41 or more three times since IWM began trading in late May of 2000. The longest streak came during the financial crisis from late 2008 through early 2009 when 67 consecutive trading days saw at least a 2% spread between IWM’s intraday highs and lows. Although the market currently appears quite volatile, it is hardy unprecedented, and IWM has experienced periods where it has undergone significant volatility for much longer periods than the current streak. Click here to view Bespoke’s premium membership options.

Bespoke’s Morning Lineup – 12/7/21 – Strong Start With Nasdaq in the Lead
See what’s driving market performance around the world in today’s Morning Lineup. Bespoke’s Morning Lineup is the best way to start your trading day. Read it now by starting a two-week trial to Bespoke Premium. CLICK HERE to learn more and start your trial.
“I would say that financial markets are very inefficient, and capable of extremes of being completely dysfunctional.” – Jeremy Grantham
Forget about a ‘turnaround’ for now, this Tuesday is looking more like a terrific one as US futures, led by the Nasdaq, are sharply higher following through on Monday’s rally. The opening bell hasn’t even rung yet, though, so there’s plenty of time left in the day. That said, early indications are pointing higher with risk assets all trading higher, although long-term Treasury yields are moving much less higher than you would expect given the move in equity futures. Crypto assets are also in rally mode this morning as bitcoin is back above $50K, and ether is back above its 50-day moving average.
In economic data, the revision to Non-Farm Productivity was lower than expected (-5.2% vs -4.7%) while Unit Labor Costs increased more than expected (9.6% vs 8.3%).
Read today’s Morning Lineup for a recap of all the major market news and events from around the world, including the latest US and international COVID trends.
The Russell is indicated to open more than 1.5% higher this morning continuing what has been a volatile run for the small-cap benchmark index. So far during this sell-off from a false breakout, IWM has managed to stay within its prior trading range after falling below both its 50 and 200-day moving averages. In addition to the consistency of much higher than average volume during the last seven trading days, IWM has also had an intraday trading range of more than 2% and averaging more than 3.3% during that span. The last time IWM experienced a run of 2%+ intraday ranges for seven consecutive trading days was back in July 2020.

Start a two-week trial to Bespoke Premium to read today’s full Morning Lineup.
El Salvador Hurt By Bitcoin
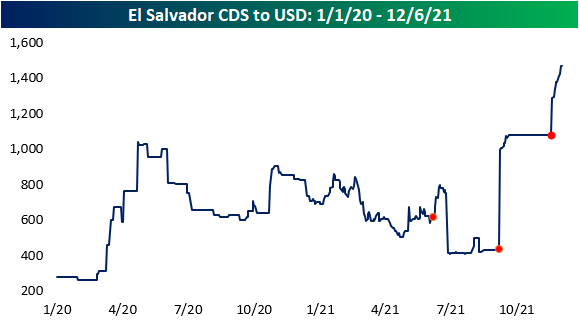
On 6/5, El Salvador passed a bill that made Bitcoin legal tender in the nation effective 9/17. Since passing the bill, the country hosted a Bitcoin Week, which generated excitement from the crypto community in which he and political/industry leaders spoke about the logistics and benefits of legalizing Bitcoin as a legal tender. During Bitcoin week, El Salvador’s leadership unveiled its plans for ‘Bitcoin City’, which will be funded by issuing a $1 billion Bitcoin Bond. The city (and the Bitcoin mining inside of it) will be powered by geothermal power generated from a nearby Volcano.
Over the weekend, El Salvador’s President, Nayib Bukele took to Twitter, stating that “El Salvador bought the dip” and added that he trades cryptocurrency for his country through his phone. Although Bitcoin enthusiasts view this adoption as revolutionary, the investing community has taken a different view. Since the country officially announced that Bitcoin would become legal tender, its bonds have declined in value. As one example, the price of the country’s 7.65% bonds maturing in June 2035 has plummeted by 37.5%. Investors are wary of the idea of tying a country’s assets and balance of payments to an extremely volatile asset, and that has caused the yield on the bond shown below to rise nearly over 600 bps from under 8% to over 14% now.


The cost of insuring against default for El Salvador’s debt (credit default swaps) has risen significantly since the nation legalized Bitcoin as legal tender, and CDS spreads have more than doubled over the period. Will this dissuade other countries from using cryptocurrencies as legal tender? Click here to view Bespoke’s premium membership options.
Bespoke’s Morning Lineup – 12/6/21 – Nasdaq Lags
See what’s driving market performance around the world in today’s Morning Lineup. Bespoke’s Morning Lineup is the best way to start your trading day. Read it now by starting a two-week trial to Bespoke Premium. CLICK HERE to learn more and start your trial.
“I would say that financial markets are very inefficient, and capable of extremes of being completely dysfunctional.” – Jeremy Grantham
US equity futures are tentatively higher this morning with leadership in the Dow while the Nasdaq continues to lag. The economic calendar is empty today, but investors already have an eye out for Friday’s CPI report. Omicron continues to be a concern, and while there’s still a lot more we don’t know than we do know about the latest strain, reports continue to suggest that despite the higher transmissibility, its impact has not been nearly as harsh. In the crypto space, bitcoin has been relatively stable since Sunday following a sharp decline Friday night into Saturday morning.
Read today’s Morning Lineup for a recap of all the major market news and events from around the world, including the latest US and international COVID trends.
While companies valued at high multiples to revenues have been hit hard since the emergence of the omicron variant and the FOMC’s hawkish pivot just after Thanksgiving, there’s been a decent amount of disparity in performance among international markets with developed markets falling in the last week while emerging markets actually eked out gains. As shown below in the snapshot of international regional ETFs from our Trend Analyzer, the worst-performing ETF of the group was the MSCI All Country World (ACWI) which fell just over 1%. Moving down the list, at the bottom, the lone ETFs that were positive on the week were related to Emerging Markets. US equities were also a drag on performance last week. While the ACWI was down just over 1%, CWI, which is the MSCI All Country World ex-US Index was only down -0.07% on the week.

Start a two-week trial to Bespoke Premium to read today’s full Morning Lineup.