Bespoke’s Morning Lineup – 12/14/21 – PP-High
See what’s driving market performance around the world in today’s Morning Lineup. Bespoke’s Morning Lineup is the best way to start your trading day. Read it now by starting a two-week trial to Bespoke Premium. CLICK HERE to learn more and start your trial.
“Theory is splendid but until put into practice, it is valueless.” – James Cash Penney
Futures are lower across the board this morning, but the only index that is down of any significance at this point is the Nasdaq. The big report of the morning was November PPI and at the headline level, it came in stronger than expected rising 0.8% versus forecasts for an increase of 0.5%. Ex food and energy, producer prices were also higher than expected rising 0.7% compared to forecasts for an increase of 0.4%. As one might expect, the initial reaction in futures was weaker equities and higher yields.
Read today’s Morning Lineup for a recap of all the major market news and events from around the world, including the latest US and international COVID trends.
Both the Nasdaq 100 and the S&P 500 have been treading water as both indices are at the same levels now that they were at more than a month ago. For QQQ, the high water line is currently at just over $400 a share. It briefly broached that level in mid-November for two days but could not hold those levels before pulling all the way back to its 50-day moving average. Last week, QQQ approached the $400 level again before selling off yesterday. For SPY, resistance has been even more pronounced at the $470 level. It has now tested that level three separate times since early November but has run out of momentum each time. There’s nothing wrong with equities treading water after big upside rallies, but hopefully, they have the strength to stay afloat.

Start a two-week trial to Bespoke Premium to read today’s full Morning Lineup.
Berkshire’s Apple (AAPL) Weighting Swells to Nearly 50%
The Oracle of Omaha is known for weathering storms and emerging stronger after market pullbacks. In March of last year, we highlighted the fact that Buffett’s portfolio was seeing declines in line with the broader market, and the legendary investor seemed just as hurt as other market participants. Even though Buffett’s strategy of “be greedy only when others are fearful” has historically been a successful one, he did not aggressively buy the COVID-related dip, and the company now has record amounts of cash stockpiled on its balance sheet.
Although Berkshire Hathaway (BRK/B) has almost $150 billion in cash, the company’s portfolio has still performed strongly. Below is a look at Berkshire’s 20 largest equity holdings as of today based on reported holdings at the end of Q3. (This doesn’t take into account changes that may have occurred since the end of Q3 since Berkshire doesn’t have to report holdings again until early 2022.) Berkshire’s position in Apple (AAPL) has swelled to nearly 50% after the stock’s 28.5% gain so far this quarter! Berkshire’s next largest holding all the way down at 13.3% is Bank of America (BAC), which is up 3.4% QTD. American Express (AXP) and Coca-Cola (KO) rank 3rd and 4th with weightings of 7.5% and 6.9%, respectively. Only a handful of other companies have weightings above 1%: Kraft Heinz (KHC), Moody’s (MCO), Verizon (VZ), US Bancorp (USB), DaVita (DVA), Bank of NY Mellon (BK), General Motors (GM), and Chevron (CVX).
Quarter-to-date, Berkshire’s portfolio (as it stood on 9/30/21) would be up 13.9%, and that’s due largely to Apple’s 28.5% gain so far in Q4. Seven of Berkshire’s twenty largest holdings are in the red so far this quarter, with Charter (CHTR) down the most at 17.2%.

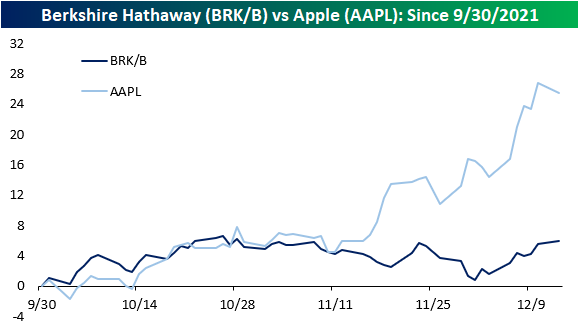
AAPL now makes up almost half of the overall Berkshire equity portfolio (and a quarter of the company’s market cap), which means that Berkshire Hathaway should be correlated to the performance of AAPL. Although the two equities have a semi-strong relationship over the last year with a correlation coefficient of 0.46, the correlation in Q4 has dramatically decreased. Since 9/30, the correlation coefficient is only 0.12, which implies only a very small correlation. Whereas AAPL has traded over 28.5% higher in Q4, BRK/B has only appreciated by about 6.5%. While AAPL shareholders have been rewarded so far in Q4, the stock of one of AAPL’s largest holders has lagged the S&P 500. Click here to view Bespoke’s premium membership options.
Strange Bedfellows: Technology, Energy, and Consumer Staples Lead
Technology (XLK), Energy (XLE), and Consumer Staples (XLP) tend to trade quite differently from each other for a variety of reasons. The Consumer Staples sector tends to be more defensive in nature as spending on the ‘essentials’ tends to hold up better in times of uncertainty than spending on more cyclical goods. XLE is largely levered to the price of energy commodities but also acts as an inflation hedge. Technology, meanwhile, tends to do best in a bullish tape as investors gravitate towards sectors with the brightest growth prospects. Because these sectors have different exposures, it is uncommon to see weeks like last week where these three sectors top the leaderboard for a given week. In fact, this has only occurred 9 times since the start of 2000, and two of those occurrences were in back-to-back weeks at the end of 2007.
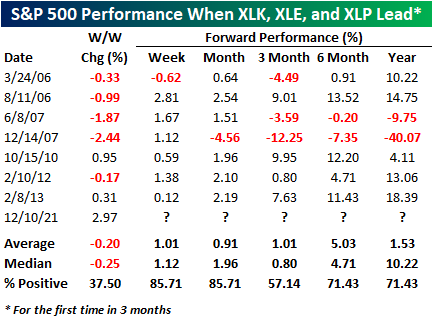
In the table below, we show each of the prior weeks that Technology (XLK), Energy (XLE), and Consumer Staples (XLP) were the three top-performing sectors (without a prior occurrence in the last three months) along with the S&P 500’s performance over the last following week, month, three months, six months, and one year. In more than half of the prior eight occurrences, the equity market was lower during weeks when this occurred, and in the two prior weeks where the S&P 500 was higher, it was up less than 1%. In other words, there has never been a week like the last one where the S&P 500 was up close to 3% and these three sectors topped the leaderboard. After the eight prior occurrences, the S&P 500 was consistently higher one week and one month later with positive returns six out of seven times. Moving further out, though, the consistency of positive returns was less. In fact, three months later, the S&P 500 was only higher four out of seven times, while six and twelve months later it was higher five out of seven times.
Somewhat ominously, the worst forward returns came after the occurrence almost exactly fourteen years ago in December 2007 when the S&P 500 went on to decline 40% in the following year. One difference between that period and last week, though, was that instead of those three sectors leading the market in a week where the S&P 500 was up over 2%, in that week the S&P 500 was down over 2%. Click here to view Bespoke’s premium membership options.
Bespoke’s Morning Lineup – 12/13/21 – Fading Gains
See what’s driving market performance around the world in today’s Morning Lineup. Bespoke’s Morning Lineup is the best way to start your trading day. Read it now by starting a two-week trial to Bespoke Premium. CLICK HERE to learn more and start your trial.
“To be a better investor, you have to stand on your own. You just can’t copy other people’s insights.” – Li Lu
If you had asked investors last Monday morning if they thought the S&P 500 would be trading at a record high to close out the week, you probably wouldn’t have gotten many takers. Surprising people is what the market likes to do best, though, so that’s exactly what it did last week. To kick off this week, futures were higher overnight but have given up much of those gains although they are still modestly positive. Bitcoin had a brief move above $50K over the weekend, but it has been pulling back in trading today and is back below $49K.
Mid-December is typically when things start to slow down into year-end, but this week will be busy for central banks. Not only will the Fed make its policy announcement on Wednesday, but we’ll also get policy decisions from more than ten other central banks this week, including the Eurozone, UK, Japan, and Russia.
Read today’s Morning Lineup for a recap of all the major market news and events from around the world, including the latest US and international COVID trends.
You know it was a good week in the equity market when sectors that lagged were still up over 2.5%. In last week’s nearly 4% rally for the S&P 500, all eleven sectors were not only higher on the week but they were also all up over 2.5%. Leading the way higher, it was Technology (XLK), which surged 5.9% thanks in large part to Apple’s (AAPL) gain of more than 10%. After Technology, the two sectors rounding out the top three were Energy (XLE) and Consumer Staples (XLP) which gained 3.81% and 3.66%, respectively. It’s not often that you see Technology on the leaderboard with sectors like Energy and Consumer Staples. In spite of last week’s surge, just five sectors are currently at overbought levels with Financials and Communication Services the only two sectors that are still below their 50-day moving averages.

Start a two-week trial to Bespoke Premium to read today’s full Morning Lineup.
Bespoke Brunch Reads: 12/12/21
Welcome to Bespoke Brunch Reads — a linkfest of the favorite things we read over the past week. The links are mostly market related, but there are some other interesting subjects covered as well. We hope you enjoy the food for thought as a supplement to the research we provide you during the week.
While you’re here, join Bespoke Premium with a 30-day free trial!
NFL
Why 169 former NFL players have turned to coaching high school football by Jeff Legwold (ESPN)
After spending a lift in the game, many former pro football players turn to the coaching ranks, even at the lower levels of the game as assistants. [Link; auto-playing video]
Running the Football Is Dying. Jonathan Taylor Brings It Back to Life. by Andrew Beaton (WSJ)
With short careers, high paychecks, and relatively small offensive production, running backs are out of vogue with NFL front offices….but don’t tell that to the Colts’ starter. [Link; paywall]
Misbehavior
Trump SPAC under investigation by federal regulators, including SEC by Dan Mangan (CNBC)
The blank-check company that has proposed taking a digital network backed by President Trump public is under investigation by Finra and the SEC. [Link; paywall]
US billionaire surrenders $70m of stolen art by Dalya Alberge (The Guardian/MSN)
A billionaire agreed to surrender a vault full of artefacts that were stolen from their countries of origin including Bulgaria, Egypt, Greece, Iraq, Israel, Italy, Jordan, Lebanon, Libya, Syria, and Turkey. [Link]
World Affairs
In need of a baby boom, China clamps down on vasectomies by Alcia Chen, Lyric Li, and Lilly Kuo (WaPo)
Forced sterilizations and the one child policy were so successful that Chinese policymakers are trying to unwind the demographic catastrophe looming in the country’s rapidly aging population. [Link; soft paywall]
Sanna Marin: Finland’s PM sorry for clubbing after Covid contact (BBC)
Finland’s Prime Minister missed a text telling her to isolate due to a COVID-19 exposure because she was busy clubbing. [Link]
Social Media
Instagram will bring back a chronological feed in 2022 by Karissa Bell (Endgadget)
After half a decade of pumping timelines full of algorithmically-selected content, Instagram will revert to a chronological feed that shows photos in the order they were posted. [Link]
How An Excel TikToker Manifested Her Way To Making Six Figures A Day by Nilay Patel (The Verge)
After discovering her Excel tips were massively popular on TikTok, Kat Norton opened a software training business that is doing six figures a day in revenue. [Link]
Birds Aren’t Real, or Are They? Inside a Gen Z Conspiracy Theory. by Taylor Lorenz (NYT)
A joke conspiracy theory has metastasized into a movement of young people who genuinely believe birds are government drones. [Link; soft paywall]
Covid Spurs Biggest Rise in Life-Insurance Payouts in a Century by Leslie Scism (WSJ)
With hundreds of thousands of Americans succumbing to COVID-19, life insurance payouts have soared 15% to more than $90 billion. The smaller payouts to older victims of the pandemic meant the cost to insurers was far smaller than expected initially. [Link; paywall]
Botched Deployments
Death, drugs and a disbanded unit: How the Guard’s Mexico border mission fell apart by Davis Winkie (ArmyTimes)
The National Guard’s deployment to the US border was nothing short of a disciplinary disaster, with 1200 legal actions, 500 car accidents creating more than $600k in total damage, multiple deaths, and alcohol abuse so severe that officers issued breathalyzers to make sure soldiers weren’t drunk on duty. [Link]
How Amazon Outage Left Smart Homes Not So Smart After All by Isabella Steger (Bloomberg)
A massive outage at AWS didn’t just take down large numbers of websites that rely on the cloud infrastructure; smart homes and other IoT use-cases got temporarily bricked as well. [Link; soft paywall, auto-playing video]
Apple’s iPhone Successor Comes Into Focus by Christopher Mims (WSJ)
The world’s largest company is expected to unveil a “head-mounted” device that will mark its follow-up to the iPhone; whether this headset or smart glasses product actually works in the real world is a very different question. [Link; paywall]
Inflation
Retreat From Globalization Adds to Inflation Risks by Yuka Hayashi (WSJ)
Unwinding the massive offshoring of global supply chains over the past few decades is not a fast process, and it could end up being an expensive one for customers of companies that are trying to avoid tariffs and uncertainty from overseas suppliers. [Link]
Indices
S&P500 Rebalance for December 2021 – Rearranging the Deckchairs by Travis Lundy (SmartKarma)
At the close on the 17th of December US large, mid, and small cap indices will be rebalanced in changes announced last week, with implications for a number of stocks and a clear trade catalyst. [Link]
Read Bespoke’s most actionable market research by joining Bespoke Premium today! Get started here.
Have a great weekend!
The Bespoke Report + 10 Favorite Market Indicators – 12/10/21
Please click the thumbnail below to read this week’s Bespoke Report newsletter.

Please click the image below to read Bespoke’s 10 Favorite Market Indicators. We’ll be publishing pretty regular updates of this report going forward.

CPI vs 10 Year Yield and S&P 500
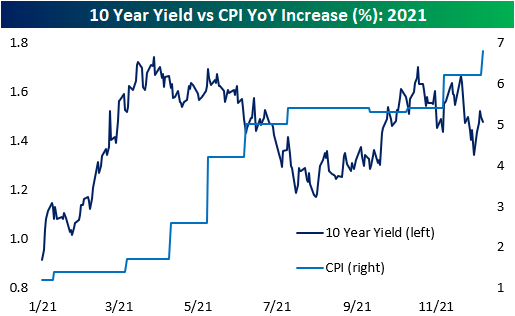
With inflation levels surging this year, you would expect to see long-term interest rates right along with CPI. As illustrated in the chart below, though, that has been far from the case. Ever since y/y CPI first crossed 2% back in Q1, the yield on the 10-year has actually declined even as CPI has surged to 6.8%! Fed purchases of treasuries have helped to keep rates low, but if the market was truly worried about inflation pressures becoming a longer-term issue, you would expect to see at least some upward pressure in rates.
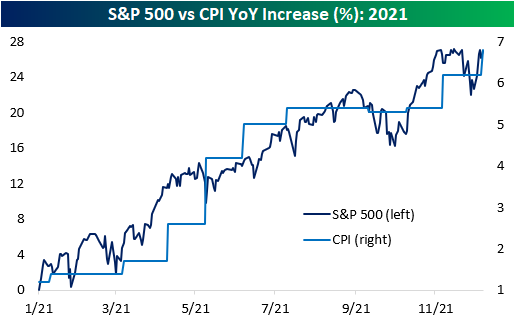
While yields have seen little upside pressure from the surge in inflation, stock prices have piggy-backed the move higher the entire time. Investors continue to pile into stocks as low yields seemingly offer no other alternative and negative real yields in the treasury market make equities look more attractive on a relative basis. . Click here to view Bespoke’s premium membership options.
Bespoke’s Morning Lineup – 12/10/21 – The Report You’ve All Been Waiting For
See what’s driving market performance around the world in today’s Morning Lineup. Bespoke’s Morning Lineup is the best way to start your trading day. Read it now by starting a two-week trial to Bespoke Premium. CLICK HERE to learn more and start your trial.
“Inflation is just like alcoholism. The good effects come first.” – Milton Friedman
Following yesterday’s move of just six cents (not basis points but cents) in the Dow, European markets are similarly quiet this morning with the FTSE-100, the CAC-40, and DAX, all trading within 0.1% of their respective closes on Thursday. However, just as the Dow’s move wasn’t entirely representative of the action in US stocks yesterday, the fact that indices are little changed on the day doesn’t reflect that all of those major European indices are well off their lows of the day.
There may not be a lot of direction in equity markets so far this morning, but there’s a good chance that the release of November CPI could act as a catalyst for more of a move throughout the day, although there wasn’t a lot of optimism heading into the report that the reading would come in light,
Once CPI is out of the way, investors can shift their focus to next week’s FOMC announcement on Wednesday. Given Powell’s hawkish pivot right after Thanksgiving, it’s hard to imagine what the Fed could say next week that would really be a surprise to investors at this point.
Read today’s Morning Lineup for a recap of all the major market news and events from around the world, including the latest US and international COVID trends.
With all the volatility we have seen in the S&P 500 over the last month, the largest stock in the S&P 500 has been remarkably calm. The S&P 500’s performance over the last month has been a marginal gain of less than half of a percent, but shares of Apple (AAPL) have rallied over 18%. With a performance spread of more than 17 percentage points, the gap between AAPL and the S&P 500 over the last month has been the widest since August 2020, and before that, you would have to go all the way back to August 2013 to find another time that the spread was wider. There have been plenty of times in the past where AAPL has followed a different path than the broader market, but you don’t often see the gap get wider than it is now.

Start a two-week trial to Bespoke Premium to read today’s full Morning Lineup.
Not Pessimistic But Not Optimistic Either
The S&P 500 has made a quick recovery in the past week closing within a few basis points of a new 52-week high yesterday. In spite of that improvement to price, sentiment has yet to fully buy-in. The American Association of Individual Investors weekly sentiment survey only saw a modest improvement to the percentage of respondents reporting as bullish. Just under 30% of respondents reported bullish sentiment versus a level of 26.7% last week. That snapped a streak of back-to-back-to-back declines but still leaves bullish sentiment 4.1 points below where it was only two weeks ago.
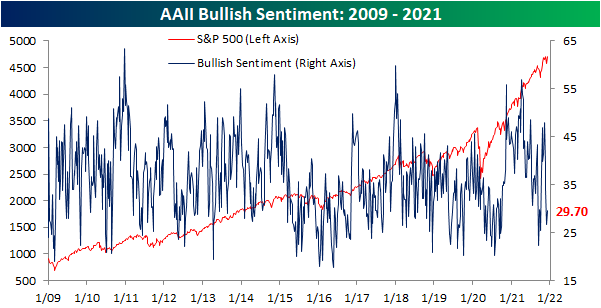
While the change in bullish sentiment was nothing to write home about, bearish sentiment plummeted 11.9 percentage points to 30.5%. That was the largest single-week decline since 10/17/19 when bearish sentiment collapsed an even larger 12.91 percentage points. Back then, that brought bearish sentiment to a similar level of 31.05%.
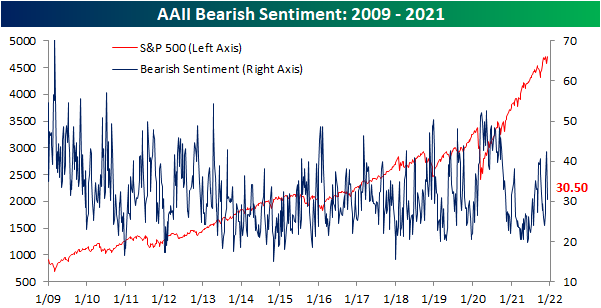
In spite of bearish sentiment’s big reversal lower, the bull-bear spread remains negative, albeit not by much.

Considering bullish sentiment did not meet the big drop in bearish sentiment, neutral sentiment made up the difference rising 8.8 percentage points to 39.8%. That is the highest level of neutral sentiment since the first week of 2020 when it eclipsed 40%.

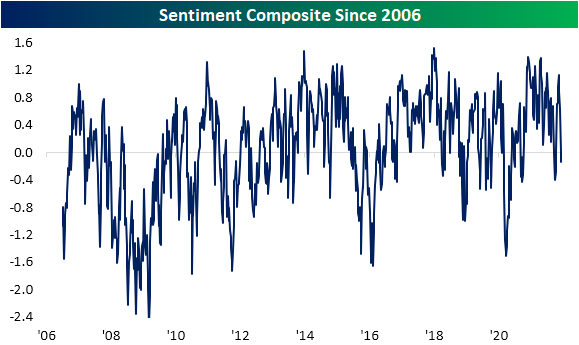
While the AAII numbers showed a big reversal in bearish sentiment, other sentiment indicators took more pessimistic tones this week. The NAAIM Exposure Index collapsed further to the lowest level since mid-October while the Investors Intelligence survey saw the biggest one-week drop in bullish sentiment since October 2019 to the weakest reading since early April 2020. Bearish sentiment, meanwhile, saw the largest one-week uptick since June 2012. As a result of the combined moves across these indicators, our sentiment composite has continued to plummet and is now in negative territory and at the weakest level since late September/early October. Click here to view Bespoke’s premium membership options.
Claims Get Their Seasonal Bump
Seasonally adjusted initial jobless claims saw a substantial 43K decline this week down to not a 52-week but a 52-year low of 184K! While that marked a new low, last week’s print was revised higher by 5K to 227K.
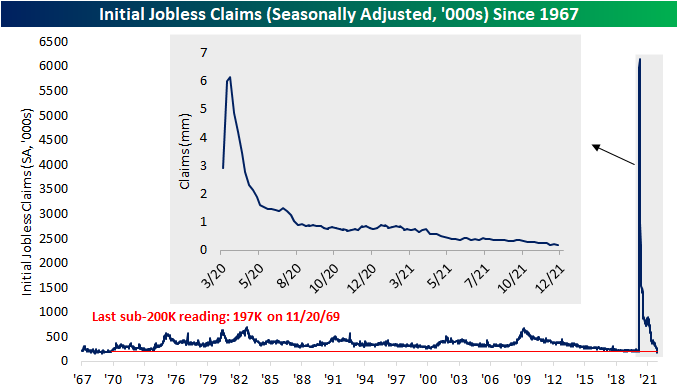
On a non-seasonally adjusted basis, claims were less impressive this week with a 63.7K increase to 280.7K. That jump erased any of the improvements to claims since the end of September.
Although unadjusted claims have now erased the past couple of months of improvements, that is less alarming in the context of seasonality. The current period of the year typically sees claims gradually rise into year-end. Up until this week, that seasonal trend has not exactly been consistent this year, though, as claims have generally trended sideways throughout the fall. Turning back to this week, the current week of the year (49th) has historically seen claims rise week over week 81.5% of the time since 1967 and the average increase to claims is the second largest of any week of the year as well. In other words, if there was a week for claims to play catch up to seasonal norms, it would have been this week. Furthermore, despite this week’s increase in NSA claims of just 64K, it was still below average.


Pivoting over to continuing claims, there was a tick higher to 1.992 million this week from the low of 1.954 million last week. Albeit higher, claims remain healthy below 2 million.

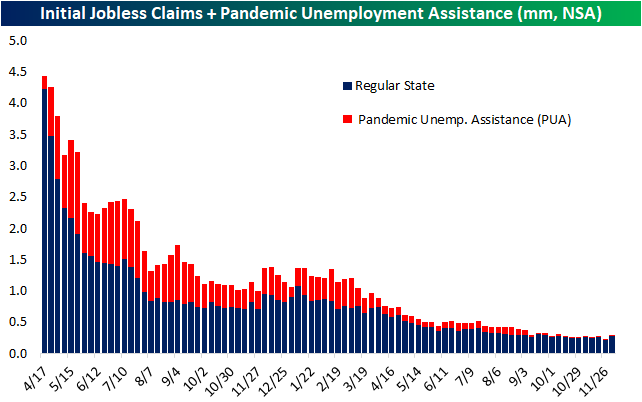
Unadjusted claims can include all other programs which are delayed an extra week making the most reading through the week of November 19th. That week saw total claims fall below 2 million for the first time since the pandemic with broad declines across programs. Regular state claims—which are currently the vast majority of claims since the expiration of pandemic era programs—were the biggest contributor to that decline. Pandemic programs still have a presence but that is dwindling with claim counts for PUA, PEUC, and Extended Benefit claims in the low 100K range. Click here to view Bespoke’s premium membership options.
