US Outperforms the Rest of the World… Again
In January of this year, we looked at the relative performance of the United States versus the rest of the world (ROW). At the time, ROW was making up lost ground relative to the US, but that didn’t last long. Through the first three quarters of 2021, the US (SPDR S&P 500 ETF-SPY) picked up steam once again and has significantly outpaced both the rest of the world (Vanguard FTSE All-World ex-US ETF- VEU) and emerging markets (iShares MSCI Emerging Markets ETF- EEM). Emerging markets have been the underperformers of the group while the US has led. Although EEM outperformed at the beginning of 2021, the index has since moved lower while the US trudged higher right up through early September. YTD through the end of Q3, SPY has outperformed EEM by 19.5 percentage points, which ranks as the second-widest spread between the two ETFs since EEM started trading in 2004. While not to the same degree, the US has also notably outperformed the rest of the world as well with a performance gap of 12.4 percentage points.

Over the last 17 years, Q4 performance has been mixed after the performance spread between SPY and EEM during the first three quarters of the year was in the double digits. Since 2004, there have been five prior occurrences, and in three of those years, SPY continued to outperform in Q4 while it lagged twice. Over the last decade, EEM has only outperformed SPY two times through the end of Q3 (2016 and 2017), and this year is the fourth in a row where SPY outperformed EEM.

Similar to EEM, SPY has also steadily outperformed VEU in the first three quarters of the year with outperformance in 11 of the last 14 years. Interestingly, in the three years where SPY lagged VEU, it outperformed in Q4 all three times. Like this year, SPY outperformed VEU by double-digit percentages in the first three quarters of the year only three other times since 2008. The last two times there was a positive double-digit spread (2018 and 2020), VEU outperformed for the remainder of the year.
Investors often look to play trends in the first three quarters of the year for a continuation through Q4 or a reversion to the mean. However, in terms of big performance gaps between US stocks and both international and emerging markets in the first three quarters of the year, like the analysis we highlighted last week with sectors, historically there’s been no discernible trend of either a continuation or reversal of that trend in Q4. Click here to view Bespoke’s premium membership options.

Bespoke Brunch Reads: 10/10/21
Welcome to Bespoke Brunch Reads — a linkfest of the favorite things we read over the past week. The links are mostly market related, but there are some other interesting subjects covered as well. We hope you enjoy the food for thought as a supplement to the research we provide you during the week.
While you’re here, join Bespoke Premium with a 30-day free trial!
Florida
Cathie Wood’s ARK Departs NYC With Shift to Florida Office by
The team behind ARK Invest has closed its New York City office and moved its headquarters and operations to St. Petersburg, Florida, an untraditional hub for high finance. [Link]
Miami Vice’s Journey From Misfire to Masterpiece by Bilge Ebiri (Vulture)
A retrospective on Michael Mann’s 2006 reboot of the iconic 1980s television series, and how its many pitfalls have started to look much better with age. [Link]
Reopening
This Halloween, Americans Are Ready to Party Like It’s 2019 by Alyssa Meyers (Morning Consult)
Only 42% of American adults reported they were planning to celebrate Halloween during the pandemic-dominated 2020. But this year, numbers are back to normal, with more than half saying they’ll partake. [Link]
New Zealand admits it can no longer get rid of coronavirus by Nick Perry (AP)
Relative to its population, New Zealand has suffered roughly one quarter of one percent as many deaths as the US, but the sterling performance of lockdowns and test and trace in New Zealand has finally reached too high of a cost for the island nation. [Link]
Climate
Pick-up trucks and climate politics: will American drivers go electric? by Claire Bushey (FT)
A comprehensive review of the American auto industry’s efforts to get Americans to drive electric pickups, which the industry is hoping will play a spectacular role in fueling both profits and emissions reductions. [Link; soft paywall]
Feeding Cattle Seaweed Reduces Their Greenhouse Gas Emissions 82 Percent by Diane Nelson (UC Davis)
A study found that adding 3 ounce doses of seaweed to cattle feed helped reduce their methane emissions by more than 80% with no impact for their weight gain. [Link]
Labor Markets
The fast-food chain Raising Cane’s is sending corporate staff to work as fry cooks, cashiers, and recruiters in its restaurants amid an expansion drive and the labor shortage: report by Stephen Jones (Insider)
It’s getting so bad in low-prerequisite labor markets that one chicken finger chain is re-tasking corporate headcount from spreadsheets and presentations to deep frying and customer service. [Link]
Teens Are Being Trained to Drive 18-Wheelers Amid Truck Driver Shortage (Inside Edition)
A California program is putting teens behind the wheel to train them to drive trucks. Boosters hope the new drivers will alleviate a labor shortage and provide good-paying careers for teenagers just out of high school. [Link; auto-playing video]
Casino’s Open
Is the Stock Market Open at 3 a.m.? This Startup Says It Should Be by Alexander Osipovich (WSJ)
A new startup exchange has filed for permission to act as a 24/7 trading venue for stocks similar to the always-on crypto markets. Existing electronic exchanges for equity-linked assets like futures are still not operating around the clock, despite much longer trading hours than US cash equity markets. [Link; paywall]
Traders phone up gambling helplines as game-like broker apps spread by Madison Darbyshire (FT)
Day traders are piling in to gambling addiction recovery groups and the SEC is looking in to the practice of gamification by app-based brokers as well as how they undermine small investors. [Link; soft paywall]
Crypto
Anyone Seen Tether’s Billions? by Zeke Faux (Bloomberg)
A global hunt for the investments that back the world’s most popular stablecoin, and a deep dive into the team that claims to be standing guard over tens of billions in client assets. [Link; soft paywall]
An Irate Collector Is Suing the NFT Platform Nifty Gateway Over the Terms of a Very Weird Beeple Auction by Sarah Cascone (Artnet)
As if losing an auction for an extremely rare NFT wasn’t enough, one investor still had to pony up for the second-place offering, part of what can only be described as an obvious scam that is par for the course in the wild west of digital art. [Link]
Big Thoughts
The long-run effects of religious persecution: Evidence from the Spanish Inquisition by Maricio Drelichman, Jordi Vidal-Robert, and Hans-Joachim Voth (PNAS)
The upheaval of persecutions during the Spanish Inquisition was so dramatic that it has a direct impact on incomes, education levels, and social trust levels in Spain half a millennia after the original conflict. [Link]
We have no theory of inflation by Duncan Weldon (Value Added)
A long musing on the dearth of viable inflation models and why that complicates the task of monetary policy setting in both directions. [Link]
The Mafia
Lousy Management, Knucklehead Hires Plague Operations of Real-Life Sopranos by James Fanelli (WSJ)
A reliance on phones, less street smarts, and a cushy suburban upbringing make the newest generation of mobsters poorly suited to the role of wise guy, and a major liability when indictments come down. [Link; paywall]
Hand-Wringing
Valuation not stories ultimately determines investment returns by Richard Bernstein (FT)
The latest in a long string of luminaries blames the Federal Reserve for perceived ills in the market, while simultaneously comparing the current bubble to the tech boom in the late 1990s when monetary policy was much less accommodative. [Link; soft paywall]
Real Estate
The feared eviction ‘tsunami’ has not yet happened. Experts are conflicted on why. by Rachel Siegel and Jonathan O’Connell (WaPo)
The end of a national eviction moratorium has come and gone, but the number of evictions has not surged in a much of the country, puzzling experts who worried millions would be cast out during the pandemic. [Link; soft paywall]
Serial
Zodiac Killer Allegedly Identified by Team of Independent Investigators by Trace William Cowen (Complex)
While police representatives argue the findings are incorrect, a team of independent investigators claims to have identified the Zodiac serial killer who haunted the San Francisco Bay Area in the 1970s. [Link]
Vaccines
In major decision, WHO recommends broad rollout of world’s first malaria vaccine by Helen Branswell (StatNews)
A 4-dose malaria vaccine has been recommended for broad use by the World Health Organization following promising clinical trials in sub-Saharan Africa. [Link]
Governing
Idaho lieutenant governor bans vaccine mandates, tries to deploy National Guard during governor’s 2-day trip by Peter Weber (Yahoo!/The Week)
For the second time this year, the Lieutenant Governor of Idaho has usurped the Governor of that state to make policy changes while the Governor is out of the state. [Link]
Social Media
Facebook Is Not a Teen Favorite, Survey Says. These Social-Media Sites Are. by Eric J. Savitz (Barron’s)
Teenagers prefer Snapchat and TikTok to Facebook’s Instagram platform or the core site. Twitter and Twitch were also well down the popularity list. [Link; paywall]
Read Bespoke’s most actionable market research by joining Bespoke Premium today! Get started here.
Have a great weekend!
Best and Worst Performing S&P 500 Stocks in 2021
The fourth quarter is now off to the races and we thought it worthwhile to check in on the best and worst-performing S&P 500 stocks on a year-to-date basis. As shown below, there are currently six members of the index that have rallied over 100% this year. Apt for the year that its vaccine has rolled out, the biggest gainer of these has been Moderna (MRNA) with a 196.12% rally. It now has a market cap of $124.87 billion versus a market cap of only $41 billion at the start of the year. Of the 20 best performers, MRNA is also the only one with a market cap above $100 billion. The next largest is ConocoPhillips (COP) with a $95.76 billion market cap. COP is one of multiple Energy stocks on this list as well. Of the top 20 performers, Energy sector names dominate the list with 8 members.

Pivoting to the other end of the spectrum, Las Vegas Sands (LVS) is down the most this year having been cut by 36.18%. IPG Photonics (IPGP), Lamb Weston Holdings (LW), Viatris (VTRS), MarketAxess (MKTX), and Global Payments (GPN) also have fallen by at least 25%. Once again, there is only one member of this list with a market cap above $100 billion: Qualcomm (QCOM). One other interesting factor to note of the worst performers is there are several stocks that were at some point plays on pandemic trends, whether those be reopening or stay at home. For example, in addition to LVS, another gaming/reopening name, Wynn Resorts (WYNN), ranks as the eighth-worst performer YTD. Additionally, strong performers during the onset of the pandemic like Clorox (CLX), Activision Blizzard (ATVI), and Take-Two Interactive (TTWO) are all down double digits this year. Click here to view Bespoke’s premium membership options.

The Bespoke Report – 10/8/21 – Sitting in Limbo
This week’s Bespoke Report newsletter is now available for members.
After some rocky trading to kick off the month, it was hard for many to believe that the S&P 500 was actually up over 2% in the first full week of October. Regardless of how it got there, a win is a win no matter how messy it was. Despite the rally to kick-off October, the S&P 500 finished the week right around 3% from its record closing high on September 2nd.
Some people reading this are enjoying a three-day weekend in observance of Columbus Day on Monday, but the market will be open on Monday, and investors will be looking for major US indices to show some signs of which way they plan to break out of the current state of limbo we find ourselves in heading into the weekend. Will earnings season be the catalyst to get stocks back to their recent highs, or will the fact that this week’s rally ran out of steam just shy of the 50-day moving average end up, in retrospect, being the beginning of a new leg lower?
In this week’s Bespoke Report, we’ll look to shed some light on these questions as well as recap some of the key trends facing the market. There are a ton of insights on both markets and the economy in this week’s newsletter, and you can read it now with a two-week trial to our subscription service — Bespoke Premium. Click here to learn more about Bespoke Premium and start a two-week trial if you’re interested.


Intraday Commodity Spikes
Since the late spring, both silver and gold have been in steady downtrends spending much of that time below their 50-DMAs. Those downtrends remain in place, but both metals did find a short-term bottom on September 29th. While they have been rallying in the past week and a half, today each one has stalled out. From the early morning leading up to the Nonfarm Payrolls report, precious metals ramped higher with a surge immediately following the weaker than expected report. Only a couple hours after the release, gold and silver had erased a large portion of their earlier gains. In fact, silver is now 2.15% below its intraday high and gold is 1.36% below its high. For gold, in particular, that intraday reversal also marked a rejection of its 50-DMA which it—as well as silver—has struggled to stay above for most of the past several months.

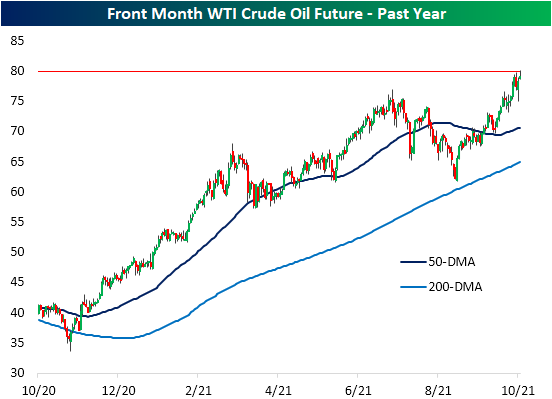
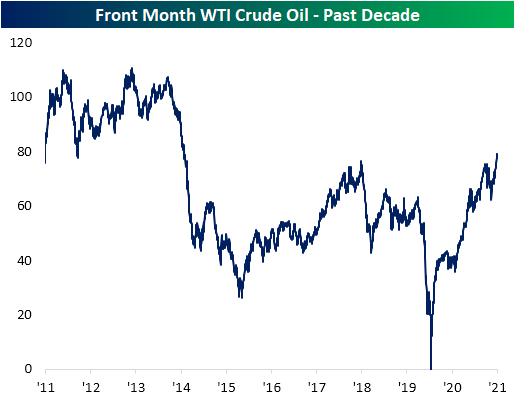
Crude oil is yet another commodity that is currently down off of its intraday highs, and like gold, the reversal came at a pretty interesting level. At its high Friday morning, front-month WTI futures rose above $80 for the first time since November 2014. Click here to view Bespoke’s premium membership options.
Columbus Day Performance
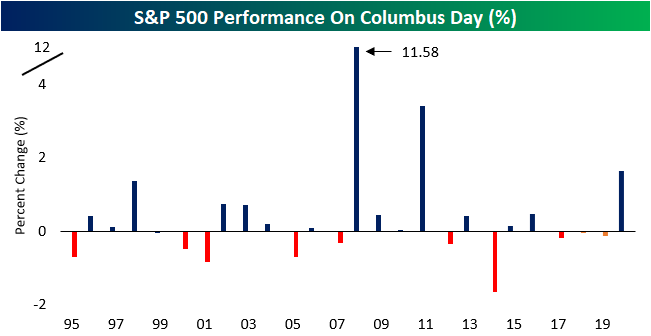
Columbus Day is an interesting trading day for financial markets as it is one of the few trading days of the year when the equity market is open, but the bond market is closed. This may lead investors to think that equity markets should perform positively, as investors do not have credit markets to allocate capital to on that specific day. However, looking at the S&P 500’s historical performance on Columbus Day over the last 25 years doesn’t necessarily show a real positive bias. Columbus Day tends to act just like any other trading day. Over the last 25 years, median performance on Columbus Day has been a gain of 10 basis points (bps) with positive returns 55.6% of the time. While that’s slightly higher than the median one-day gain of 7 bps for all trading days over the last 25 years, the difference isn’t significant. That’s not to say that Columbus Day hasn’t seen some outliers, though. Who can forget in 2008, during the middle of the Financial Crisis, when the S&P 500 rallied more than 11% on Columbus Day!
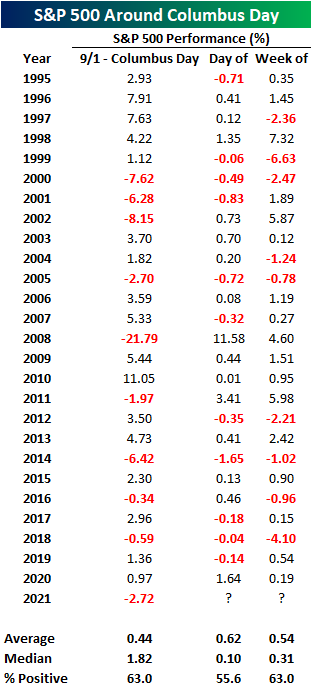
For the week of Columbus Day, the S&P 500’s median gain has been 0.31% with positive returns 63% of the time which also isn’t extraordinary relative to average weekly returns for the S&P 500 over the last 25 years. The worst Columbus Day weeks were in 1999 (-6.63%) and 2018 (-4.10%) while the best were in 1998 (+7.32%), 2002 (5.87%), and 2011 (+5.98%). Interestingly enough, in 2008, even after rallying over 11% on Columbus Day, the S&P 500 finished the week up just 4.60% as it erased more than half of its gains from the holiday session.

The table below lists the S&P 500’s performance leading up to and after Columbus Day for each of the last 25 years. With a decline of over 2.5% since the start of September, this year ranks as the weakest performance for the equity market since 2014. Click here to view Bespoke’s premium membership options.
Neutral Sentiment Grows
The S&P 500 has found some support in the past week but sentiment readings from AAII have not shown a major shift toward bullish sentiment. The percentage of respondents reporting as bullish this week fell for the second week in a row to 25.5%. That is still above the low of 22.4% from the week of 9/15.

Not only did bullish sentiment fall but so too did bearish sentiment. Whereas over 40% of respondents reported as bears last week, this week, the reading fell to 36.8%. That remains elevated relative to the past year, but it also marks the lowest level of bearish sentiment since September 9th.
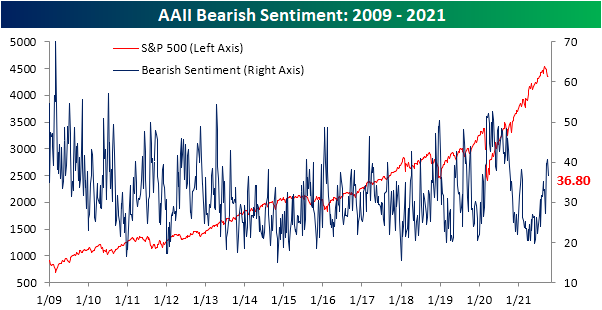
That means neutral sentiment saw a notable jump to 37.7% this week borrowing from the losses to the bullish and bearish camps. Since the start of the pandemic, this week’s reading ranks as the fifth-highest and is 6.3 percentage points above the historical average. That makes for the first time since the end of July that neutral sentiment was the predominant sentiment reading.

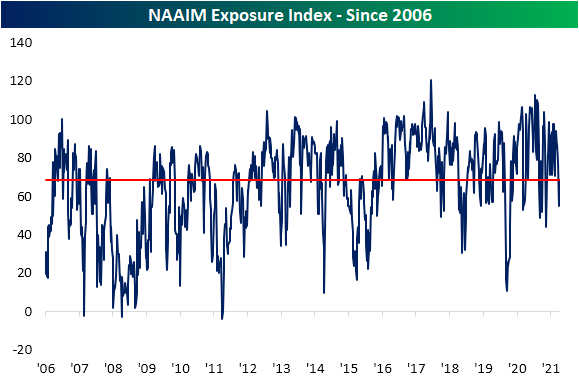
Apart from the AAII survey, the National Association of Active Investment Managers’ (NAAIM) Exposure Index also showed a reversal in pessimism this week. The index measures managers’ exposure to US equities. Readings of positive/negative 200 would indicate reporting managers are levered long/short, positive/negative 100 is fully long/short, and zero would be market neutral. Last week, this index hit a low of 55 which was the weakest reading since the spring. This week, we saw a modest bounce to 68.6. While improved, that is still below the spring and summer’s range. Click here to view Bespoke’s premium membership options.
Claims Continue to Unwind Pandemic Era Programs
After drifting higher throughout September, seasonally adjusted jobless claims finally saw an improvement this week. Not only did claims drop for the first time since the beginning of September, but the 38K decline from last week’s 2K upwardly revised number exceeded expectations of a 16K decline. Now at 326K, claims are at the second-lowest level of the pandemic behind the September 3rd reading of 312K.

On an unadjusted basis, claims were significantly lower. The non-seasonally adjusted number fell 41.4K to 258.9K. That set a new low for the pandemic and the week over week drop was the largest in ten weeks. With the expiration of pandemic era programs, PUA claims continue to account for an increasingly inconsequential share of initial claims.
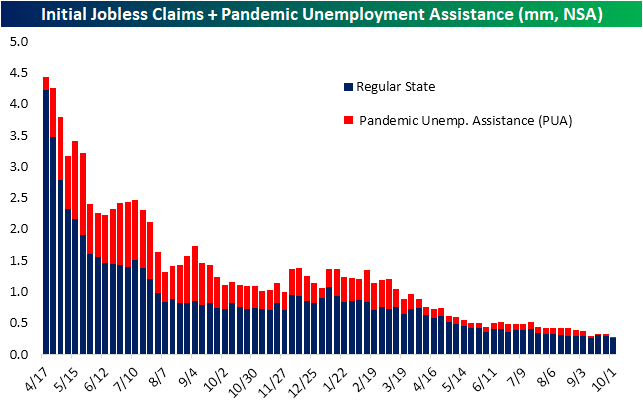
We would also note that the large decline in regular state claims goes completely against the usual seasonal pattern for the current week of the year. The 40th week of the year has historically seen claims rise WoW 87% of the time. In fact, that ranks as fourth highest in terms of the week of the year that most consistently have seen claims move higher week over week. In other words, the decline this week was strong enough to totally outpace any seasonal headwind.

Continuing jobless claims also came in below expectations this week. Regular state continuing claims through the week of September 25th fell to 2.714 million from the prior week’s 9K upwardly revised reading of 2.811 million. That makes for the lowest level of claims since March 2020 when claims were less than 1 million lower than current levels.

Including all other programs creates an additional week of lag making the most recent data through September 17th; the second week after the expiration of pandemic era programs’ expiration. Once again, the unwind in programs like PUA and PEUC drove the aggregate decline. Those two programs accounted for a combined 772.56K decline. Since the last week of August, these two programs together have seen claims fall by over 8 million. Those declines on top of nearly every other program also shedding claims means total continuing claims fell to a new low of 4.18 million; roughly a third of the level at the end of August. Click here to view Bespoke’s premium membership options.

Gas Prices Bucking Seasonal Trends…Or Are They?
Historically, the strongest part of the year for gas prices has been the summer. From the start of the year through the late spring, prices tend to rise, flattening out over the summer months, then declining from Labor Day into year’s end. We’re now about a month beyond Labor Day and 2021 gas prices are bucking that seasonal trend a bit. AAA’s national average for a gallon of regular gas just hit a new high for the year at $3.22. That is up 42.9% since the start of the year which compares to an average 14% YTD gain at this point of the year from 2005 through 2020. The only two years with larger YTD gains were 2005 and 2009.
The recent move higher in gas prices again goes against the historical seasonal average since 2005, but it is not exactly unheard of for prices to rise slightly from the end of August to the first week of October, and that’s even more true in recent years. As shown in the table below, gas prices consistently fell from August 31 to October 6th from the mid-2000s to 2015, but since then it has not been uncommon to see prices rise in that time frame. In fact, this year’s 1.48% gain since the end of August is middling versus well over 2% gains in 2018 and 2019.

Regardless of seasonal patterns, the recent increases leave the national average for a gallon of regular at the highest level since October 2014 which hurts consumers where it matters most- the wallet. Click here to view Bespoke’s premium membership options.

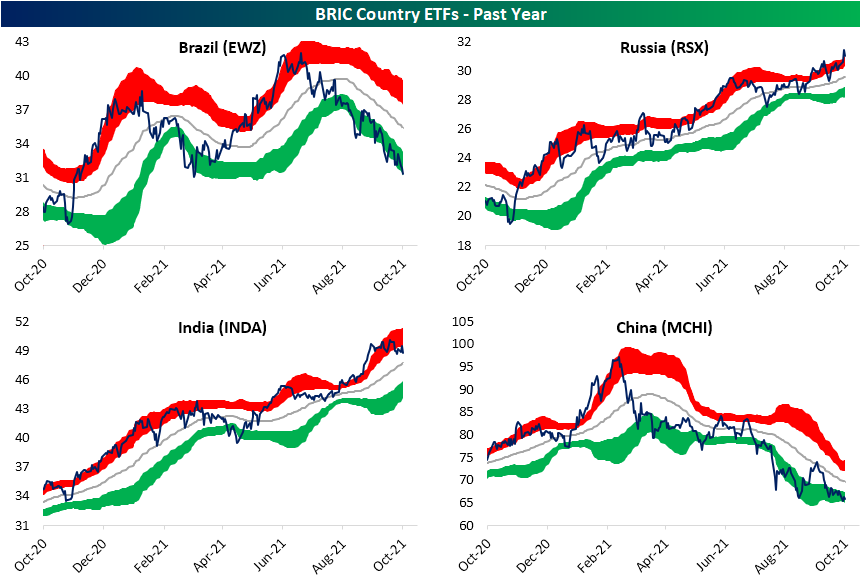
BRICs Diverge, Japan (EWJ) Pullback, and Germany (EWG) Breakdown
Peering across the ETFs tracking the stock markets of the 23 global economies tracked in our Global Macro Dashboard, the US is far from alone in having declined recently. As shown in our matrix below, the US (SPY) hit its 52-week high back on September 2nd and only a handful of other countries hit their own 52-week highs after that date: Russia (RSX), Norway (ENOR), Japan (EW), and Taiwan (EWT). Russia is perhaps the most notable of these countries. Not only was it the ETF to have most recently hit a 52-week high, but it is also the only one that is currently above its levels from 9/2 and the only one that is trading over one standard deviation above its 50-DMA. In fact, RSX is teetering on extreme overbought territory. As for the other ETFs, Norway (ENOR), India (INDA), and Malaysia (EWM) are the only ones that are even above their 50-DMAs at the moment.
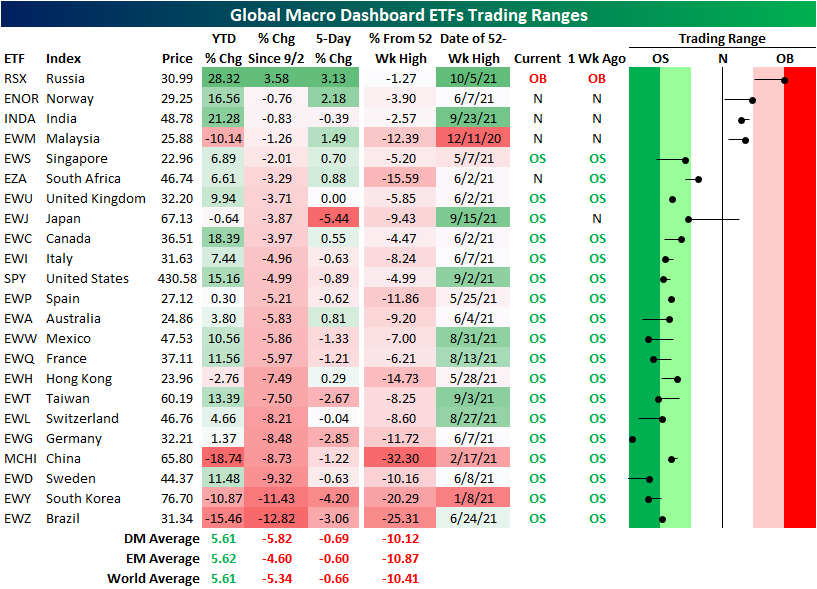
Again, Russia has experienced notable outperformance relative to most other country ETFs, but that is especially the case relative to other BRIC countries. Brazil (EWZ) and China (MCHI) have been in steady multi-month downtrends since their 52-week highs back in the first couple of months of the year. As a result of those downtrends, these two also have the worst YTD performance of all these country ETFs whereas RSX is the top performer followed by India (INDA). Additionally, since the US high on 9/2, Brazil has fallen 12.82% which ranks as the worst performance of any of these countries in that time frame. Only South Korea (EWY) has also fallen double digits in that same span of time. While it has also pulled back from its highs, the other BRIC country, India (INDA), is perhaps more similar to RSX with a steady uptrend over the past year. Currently, INDA is within 1% of its highs as well.
Pivoting away from EM markets, the G7 countries have broadly traded sideways over the past few months and are currently at the lower end of those ranges. There are exceptions to this though. Separating the downdraft over the past month, the US has actually trended higher since the spring. Germany (EWG) meanwhile is the only one that has totally broken down. In fact, it is currently the most oversold of all the 23 country ETFs highlighted above. With respect to its own history, the z-score readings (how many standard deviations from its 50-DMA the current price is) this month have all ranked in the bottom few percentiles of all periods since EWG began trading in 1996. Although EWG has broken down and is at the lowest level in months, Japan (EWJ) has experienced an even sharper short-term decline. In the past five days, EWJ has been the worst performer shedding 5.44%. EWJ has now erased all of the spike-up that occurred at the end of August through last month. If there is any silver lining to be found with regards to that decline, unlike EWG, Japan is for the time being above support at the summer lows. Click here to view Bespoke’s premium membership options.
