The Bespoke Report — Equity Market Pros and Cons — Q1 2022
This week’s Bespoke Report is an updated version of our “Pros and Cons” edition for Q1 2022.
With this report, you’re able to get a complete picture of the bull and bear case for US stocks right now. It’s heavy on graphics and light on text, but we let the charts and tables do the talking!
On page two of the report, you’ll see a full list of the pros and cons that we lay out. We then provide slides for each “pro” or “con” that we’ve highlighted.
To read this report and access everything else Bespoke’s research platform has to offer, start a two-week trial to Bespoke Premium.


Heard on Conference Calls: Q4 Earnings Season
Below are some of the most interesting quotes pulled from our Conference Call Recaps since the start of the Q4 earnings season:
Supply Chain/Inflation
- According to Apple CEO Tim Cook, the logistics environment “is very elevated in terms of the cost of moving things around. I would hope that at least a portion of that is transitory, but…the world has changed.”
- In regards to supply chain issues, Intel CEO Pat Gelsinger added, “As we predicted, these ecosystem constraints are expected to persist through 2022 and into 2023, with incremental improvements over this period.”
- Tesla CEO Elon Musk stated, “In 2022, [the] supply chain will continue to be the fundamental limiter of output across all factories. So, the chip shortage, while better than last year, is still an issue.”
- Although Johnson & Johnson reported solid results, multiple segments were negatively impacted by “raw material availability” and “supply chain constraints,” according to CFO Joseph Wolk.
- 3M CEO Mike Roman commented, “we’re going to see a volatile environment in the first half of 2022. Things should get better in the second half, but I would not expect a big snap back on stability of supply in 1Q of 2022.”
- Procter & Gamble CEO Jon Moeller pointed out that “Higher commodity and freight cost impacts combined were a 460 basis points hit to gross margins.”
- Moeller continued, “Transportation and labor markets remain tight, availability of materials remain stretched in some categories and in some markets, inflationary pressures are broad-based with little sign of near-term relief.”
COVID related
- The Netflix management team blamed “COVID overhang and macro-economic hardships in several parts of the world like LATAM” as a factor hindering growth.
- Intuitive Surgical reported that “COVID-19 has had, and will likely continue to have, an adverse impact on the company’s procedure volumes.”
- United Health CFO John Rex commented, “In the most recent weeks inpatient hospitalization levels for our members are similar to the January 2021 levels, even with national COVID case rates about 4x higher.”
Technological Development
- In terms of the metaverse, Microsoft CEO Satya Nadella commented, “And as the digital and physical worlds come together, we are seeing real enterprise metaverse usage, from smart factories to smart buildings to smart cities.”
- Nadella continued, “As every company becomes a digital company, they will need a distributed computing fabric to build, manage, secure and deploy applications anywhere.”
- American Express aims to stay at the “leading edge of technology and digital payment solutions to make American Express an essential part of our customers digital lives,” as per CEO Stephen Squeri.
- In November, Netflix unveiled its mobile gaming experience globally, which allows members to “discover and launch games from within the Netflix mobile app.”
- Tesla CEO Elon Musk believes that “over time, we think Full Self-Driving will become the most important source of profitability for Tesla”.
Broader Economy
- American Express is forecasting “higher than long-term aspirational levels of revenue growth” through 2023 due to elevated levels of consumer spending, according to the investor presentation.
- Union Pacific EVP Kenny Rocker stated that the company “will face continued challenges in our energy-related market.”
- In regards to the energy market, Baker Hughes CEO Lorenzo Simonelli added, “As we look ahead to 2022, we expect the pace of global economic growth to remain strong although slightly moderate compared to 2021. We believe the broader macro recovery should translate into rising energy demand for 2022 and relatively tight supplies for oil and natural gas.”
- Simonelli continued, “growth rates are likely to moderate from 2021 levels as central banks are expected to begin tightening monetary policy in order to reduce COVID-related stimulus plans and quell growing inflationary pressures.”
- Automatic Data Processing CFO Don McGuire commented, “a gradual ongoing recovery in labor force participation will support job growth in the first half of the year.”
- Boeing CEO David Calhoun referenced the international markets, stating, “Recovery continues broadening in Europe and South America [but] further lockdowns have stagnated recovery in China.”
In summary, management teams anticipate operating in a continued inflationary environment, but the supply chain constraints are expected to ease in the back half of 2022. Since COVID emerged, there has been an increased focus on digitization, which certain companies are attempting to capitalize on. In regards to the energy market, supply is expected to remain tight while demand strengthens, thus implying a higher price point for related commodities.
To stay up to date with Corporate America’s rhetoric, become an Institutional Subscriber today to get full access to our Conference Call Recaps. Click here to view a sample of the conference call recaps that you would be receiving on a daily basis during earnings season.
Dogs of the Dow Dominating
At the end of last year, we highlight the performance of the “Dogs of the Dow” in 2021. The Dogs of the Dow is a simple strategy that says to buy the ten highest yielding stocks in the Dow at the end of each year. In 2021, the Dogs underperformed, but so far in the new year, the complete opposite is true. As shown below, a little more than half of the Dogs are in the black year to date compared to only three (of twenty) non-dogs that are positive.
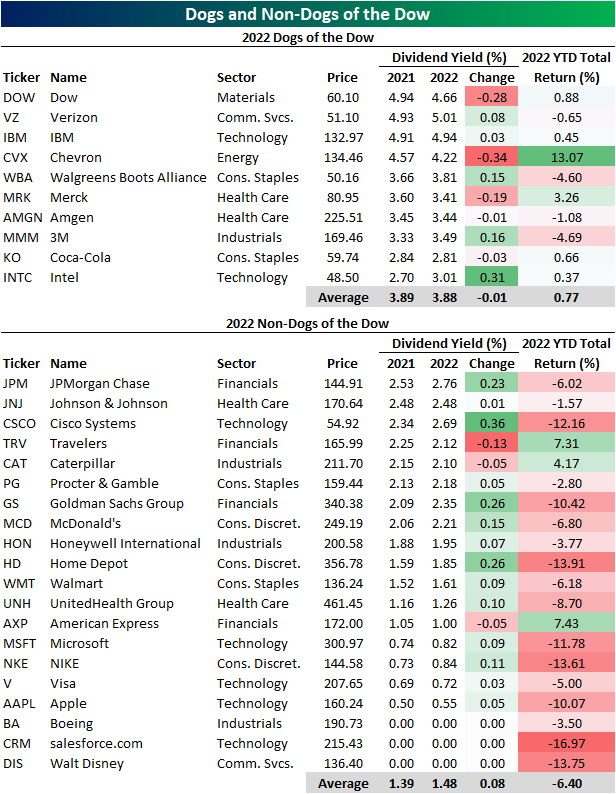
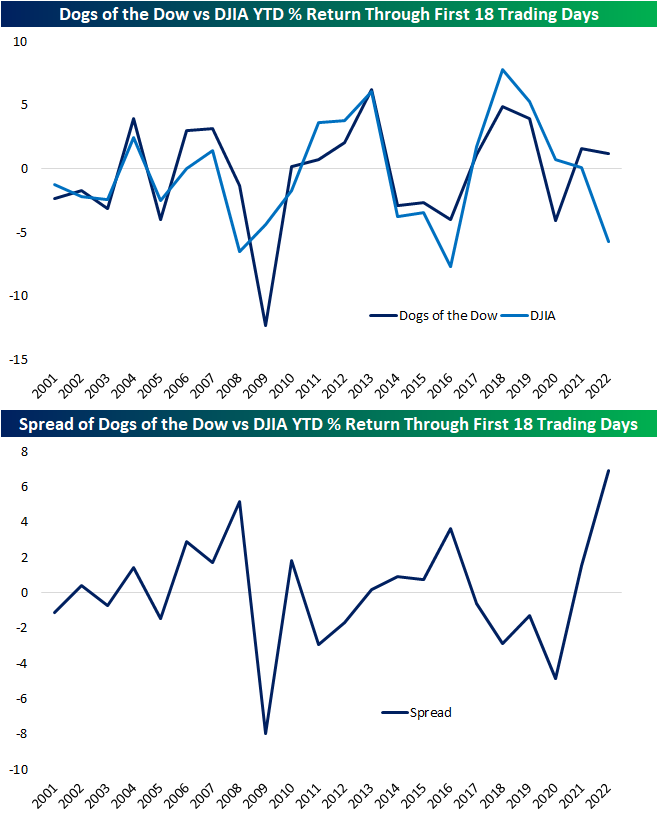
Taking a look at an index of the Dogs of the Dow going back to 2001, this year has marked the widest gap in returns between the Dogs and the broad Dow 30 through the first 18 trading days of the year. The only year that comes anywhere close to the gap in performance was 2008, and unlike this year, back then the Dogs were in the red at this point of the year. Click here to view Bespoke’s premium membership options.
Yield Curve Goes Flat
Even as the FOMC is still adding to its balance sheet, hawkish commentary from Powell and company has caused massive moves in the fixed income market resulting in a massive flattening of the yield curve. Today alone, the spread between the yield on the 10-year and 2-year US Treasuries has narrowed by nearly 10 basis points (bps). Even more extreme, is the fact that over the last three months the curve has flattened by more than 50 bps from well over 100 bps to just over 60 bps.
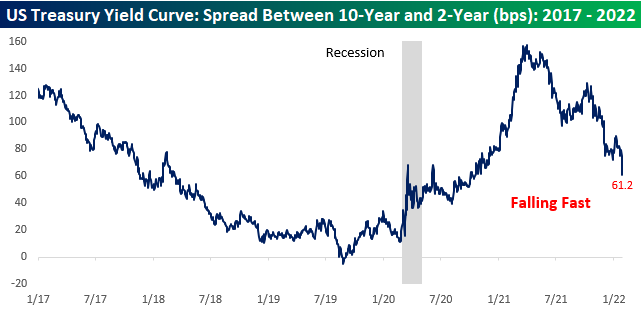
Looking at the three-month rate of change in the yield curve, it hasn’t flattened this fast in at least five years. Last summer, we saw a similar but not as severe of a move.

Taking a longer-term look, flatter yield curves aren’t necessarily a negative economic signal, but there is an inverse relationship between the level of the yield curve and recession concerns i.e., the flatter the curve gets the more the market starts to price in the odds of a recession. As shown in the chart below, every recession since the late 1970s has followed an inversion of the curve.

In terms of the pace of flattening in the 2s10s curve, the current pace has been the swiftest since January 2015, and longer-term, there haven’t been a whole lot of periods where the curve flattened at a faster rate. Looking on the bright side, though, a rapid flattening of the yield curve by itself has not been a siren song for an impending recession. As shown in the chart below, there have been numerous times over the last 40 years where the curve steepened by as much (red line) or more than it has in the last three months and the economy was nowhere near a recession. Click here to view and sign up for Bespoke’s premium membership options.

Extreme Bearish Sentiment
As equities continue to sell off, sentiment continues to tank in a broad sense. That being said, there was actually a higher share of respondents to the AAII survey reporting bullish sentiment this week. Coming off the lowest level since July 2020, bullish sentiment rose slightly and remains historically low at 23.1%.

Bearish sentiment, meanwhile, has surged 22.4 percentage points in the past month with more than half of respondents falling in the bearish camp this week. At 52.9%, it was the highest reading since the week of April 11, 2013. In other words, sentiment this week among survey respondents was more negative than even the COVID Crash. In all weeks since the start of the survey in 1987, there have only been 40 other weeks with as high if not higher of a reading.

Given the massive increase in bearish sentiment, the bull-bear spread has also outright collapsed. At -29.8, bears outnumber bulls by the widest margin again since April 2013.

Given bullish sentiment was actually higher as bears surged, the difference came from a big drop in neutral sentiment. Neutral sentiment fell by 8.4 percentage points to 23.9%. That is only the lowest neutral sentiment reading since the first week of September of last year, but it was the biggest week-over-week decline since November 2020.

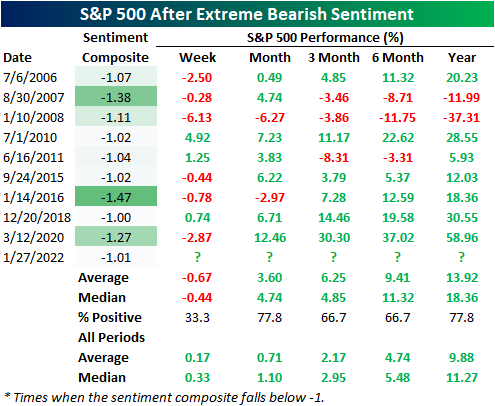
The AAII survey was far from being alone in indicating bearish sentiment. The Investors Intelligence survey of newsletter writers saw the most bearish readings since the spring of 2020 and the NAAIM Exposure index also saw one of the more modest readings of the past year. Using all of these readings combined, we created our sentiment composite below to get a more general feel for sentiment across these indicators. This week, that composite fell below -1 meaning on average sentiment indicators are a full standard deviation below (or in a bearish direction) their normal reading. Of course, that was the first time such a reading has been observed since the COVID crash.

With data beginning in 2006, there have only been nine other times in which the sentiment composite has fallen below -1 for the first time in at least three months. In the table below, we show those instances and how the S&P 500 has performed going forward. Overall, that bearish sentiment proves to be correct in the next week as the S&P 500 has declined two-thirds of the time. One month to one year later, though, returns have been biased to the positive side with positive returns at least two-thirds of the time. Click here to view Bespoke’s premium membership options.
Small Improvements in Claims
Initial jobless claims fell to 260K this week after last week’s higher than expected reading that was revised even higher to 286K this week. Claims were expected to drop this week, but the actual decline was 5K larger than forecasts.
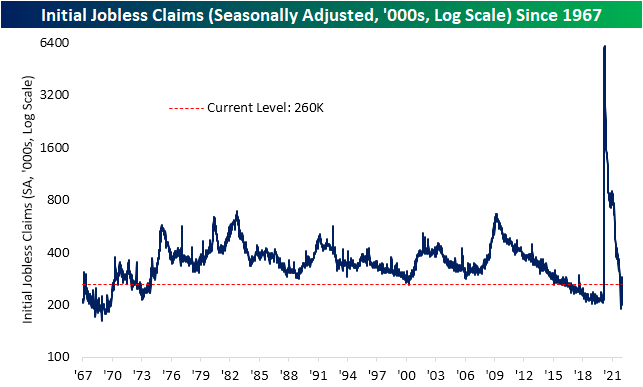
The beginning of the year typically sees a seasonal high in claims which abates into the early spring. In fact, the third (last week) and fourth (this week) weeks of the year are some of the most consistent periods for week over week declines in the NSA number. Specifically, the third week of the year has never seen a WoW increase in the NSA number and the fourth week of the year (this week) has only seen claims rise 9% of the time; the fifth-best of any week of the year.
Given this, last week’s weaker than expected adjusted number was a result of a smaller than normal decline in NSA claims. This week’s drop of 73.3K to 267.6K was again smaller than normal, but much closer to the historical average of a 76.5K decline. In other words, the actual drop in claims before seasonal adjustment continues to be weaker than normal for this point of the year potentially as a result of high COVID case counts. Regardless, the actual level of claims for the current week of the year is basically right in line with the average from the few years prior to the pandemic.

Continuing claims are delayed an extra week to the initial claims number making the most recent print through the week of January 14th. Claims rose that week from 1.624 million to 1.675 million. That was the third increase in a row, but all things considered, it was only a minor increase as the level of claims remains well below the range of the past several decades and is even below levels from the second half of December. Click here to view Bespoke’s premium membership options.

Brazil and Russia Go In Opposite Directions
Earlier today, we updated our Global Macro Dashboard highlighting major economic data points of 22 major global economies. In the table below, we show the ETFs tracking the stock markets of those same countries and their performance YTD, since their 52-week high, and where that leaves them within their trading ranges (standard deviations from the 50-DMA).
With only four ETFs up in a meaningful way year to date, heavy selling has not just been isolated to the US. Brazil (EWZ) has bucked the trend, though, rallying 10.33%. Despite the strong start to the year, EWZ is still one of the ETFs down the most from its 52-week high. The huge rally this month leaves EWZ deeply overbought alongside South Africa (EZA). While there are only two overbought countries, nearly half of the list is oversold. South Korea is the most oversold of these, but it has not experienced the largest decline this year. Russia (RSX) takes that crown as RSX has fallen 16.65% YTD as geopolitical tensions with Ukraine arise and the threat of sanctions weighs on that market

As previously mentioned, two of the biggest movers are the first half of the BRIC countries. While the decline for RSX recently has been severe, it is a leg lower in a longer-term downtrend that has been in place since the fall. Brazil, meanwhile, has been in a downtrend since last spring, but the recent surge has resulted in it definitively breaking that trend. China’s (MCHI) downtrend is approaching a year in length, but there has not been much in the way of technical improvements. The same can also be said for India (INDA) which has failed to reclaim its 50-DMA.
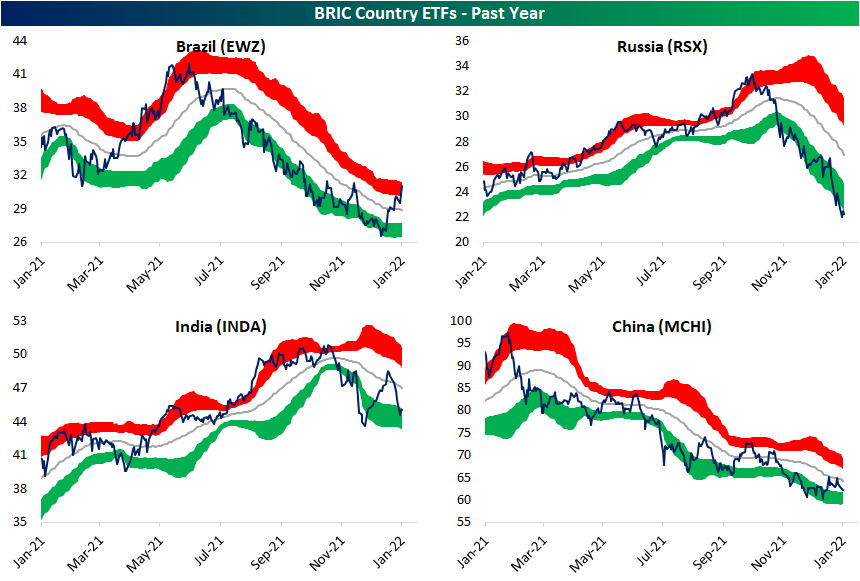
While no other BRIC country ETF has broken out of its downtrend, Hong Kong (EWH) and South Africa (EZA) have both been stronger. That being said, EWH has begun to reverse lower after reaching overbought territory, and EZA failed to take out resistance at the fall highs and has since been consolidating. Click here to view Bespoke’s premium membership options.


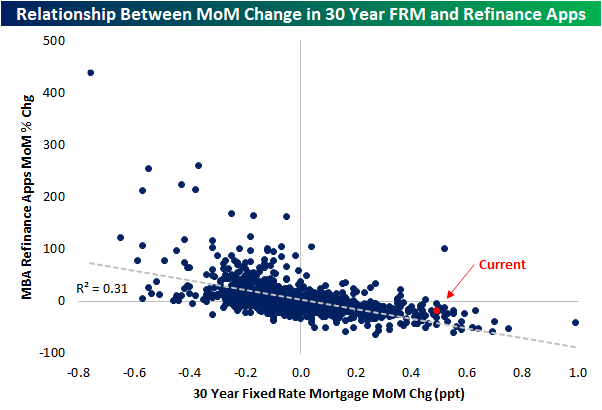
Mortgage Rates Surge, Refis Slump
The recent rise in rates has lifted the national average for a 30-year fixed-rate mortgage to 3.68% which is nearly a half percentage point higher than it was just one month ago. That is also the highest rate since April 2020.

Such a large jump in rates in only a month’s span is not totally without historical precedent, but it is on the large side of monthly moves. Going back to 1998, the current one-month change in rates stands in the top 2% of all periods. It is also the largest jump since March 2020.

Weekly data from the Mortgage Bankers Association released this morning has reflected that rise in rates. Mortgage applications fell over 7% WoW on a seasonally adjusted basis. Refinance applications experienced a sharper 12.6% WoW decline as the index hit the lowest level since the first week of 2020 bringing the total decline over the past month up to 17.5%. While applications are falling somewhat dramatically, current levels are now only slightly above the historical average.

The moves in refinance applications relative to mortgage rates are consistent with what could be reasoned. As the price to (re)finance a home rises, there will be fewer applications, and the data is consistent with that line of thought. In the chart below, we show the relationship between the MoM changes in mortgage rates and refinance applications. Typically as rates rise, mortgage apps fall and vice versa. The most recent week’s data sits toward a more extreme end of things though the drop in refinance applications is not as large as might have been expected.
Pivoting over to related stocks, the iShares Home Construction ETF (ITB) is up half of one percent today, albeit having come off of the morning’s highs on the weaker than expected MBA numbers and stronger than expected new home sales figures. The bounce over the past few days brings ITB back up toward its 200-DMA which acted as support back in the early fall. Overall, ITB’s pandemic uptrend is also still more or less in place.
Meanwhile, mortgage REITs (which is a more direct play on MBA data) proxied by the iShares Mortgage Real Estate ETF (REM) have gotten hit harder recently with a more defined downtrend since the late fall. While it too is bouncing in the past few sessions with a 1.6% gain today, the technical damage has been more severe than the homebuilders.Click here to view Bespoke’s premium membership options.


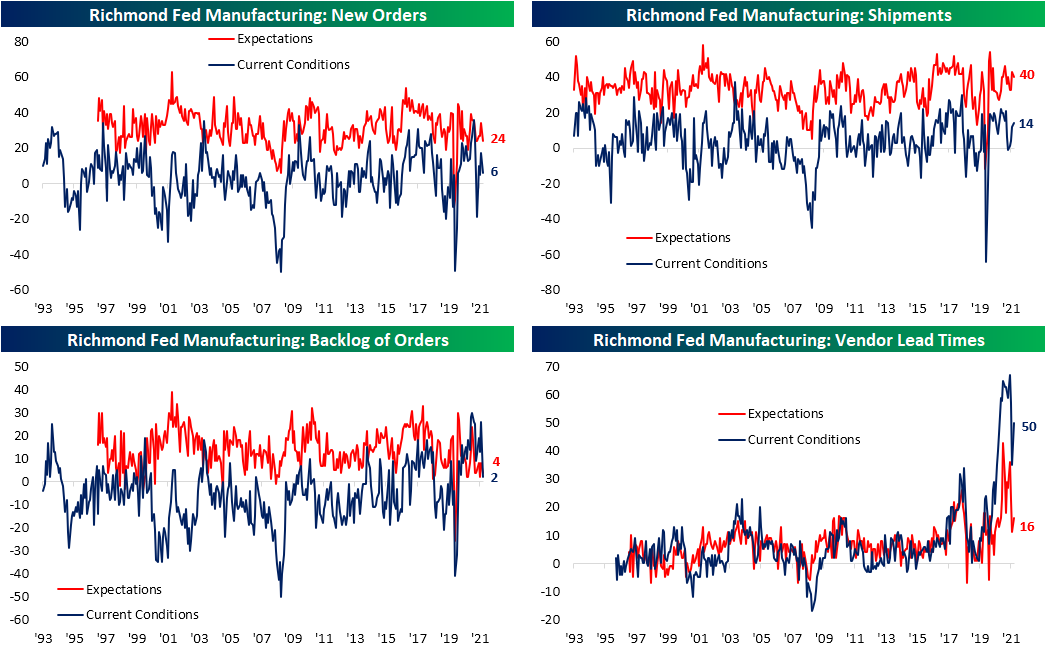
Another Regional Fed Index Declines
The latest regional manufacturing index out of the Richmond Fed was released today covering the month of January. Whereas the Empire Fed reading plummeted and the Philly Fed bounced, the Richmond Fed’s index more went the way of the former. The index was cut in half falling 8 points to a level of 8. The current level continues to indicate expansionary activity but at a slower rate.

Breadth was weak in the report with most categories falling month over month across both current conditions and expectations. A handful of these were historically large declines too. For example, the decline in the Service Expenditure expectations index was the largest on record. Whereas last month many categories saw readings in the upper few percentiles of their historical ranges, this month most were more middling. But there are some exceptions as prices, vendor lead times, and wages all remain at or close to record highs.
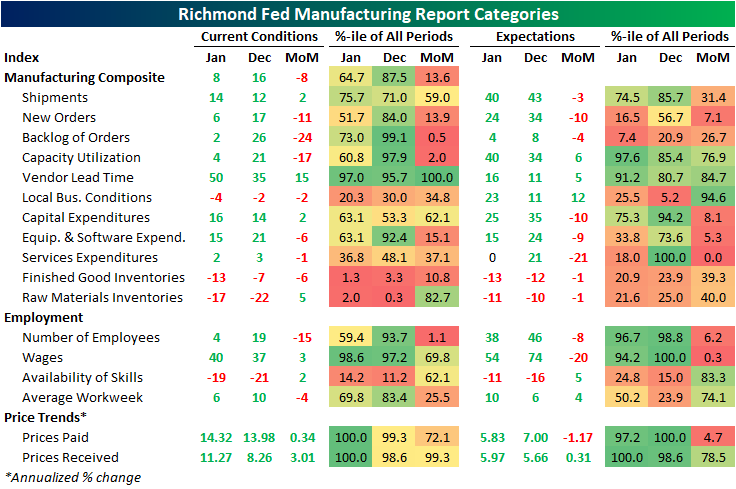
Growth in new orders slowed significantly. The 11 point drop ranks in the 13th percentile of all monthly changes. The drop in backlogs was much more dramatic, though, with its 24 point decline ranking as the third-largest on record. Even though shipments accelerated, so too did vendor lead times with a record 15 point MoM increase. While there was that sharp increase, the index remains below the levels it sat at for most of last year.
Another area to experience a sharp decline in January was the index for the number of employees. The 15 point decline ranks as the sixth-largest on record indicating a rapid deceleration in hiring. The average workweek also declined meaning existing employees worked fewer hours. The index tracking the availability of skills continued to recover off of historic lows, but the current levels still point to a large talent gap. Wages also saw a minor bump this month, but expectations fell sharply with the month-over-month decline tied for the second-largest drop on record.

Not only were prices for labor higher but so too were prices paid and received. Both indices set new record highs well above any reading observed prior to the pandemic. Expectations moved in opposite directions though. Expectations for prices paid fell to a 5.83% annualized rate while expectations for prices received rose to a record high of 5.9%. Click here to view Bespoke’s premium membership options.

Semis Slide Below 200-Day
Breadth has been all-around bad recently. For example, as we highlighted in our Sector Snapshot, the 10-day advance-decline lines for the S&P 500 and the Tech sector are hovering close to the lowest levels since March 2020. We’re about as oversold as it gets from a short-term trading perspective. The semis are starting to break down too. Today, assuming it keeps up the pace of declines, the Philly SOX index is looking to close below its 200-DMA for the first time since the spring of 2020 as the uptrend off the COVID lows is on the ropes.

It has been well over a year since the Philadelphia Semiconductor index, or the SOX, has last closed below its 200-DMA. Assuming no historic jaw-dropping afternoon rally the likes of which haven’t been seen since…yesterday, the group is looking to end a 435 trading day streak of closes above its 200-DMA. Going back through the history of the index beginning in the mid-1990s, there have only been three streaks that have gone on for longer.

While it is not a particularly large sample size, given its reputation as a leading sector, we wanted to highlight the performance of the semis and the broad market after long streaks above the 200-DMA for semis come to an end. The only outright consistently negative performance in the following weeks and months was in 2000 during the dot com bust following the end of the streak in August 2000. Overall, median performance one week and one month later has been far stronger than the norm for the semis, Tech, and S&P 500. Going further out, things are more mixed relative to each index’s respective norm. For example, the semis are typically worse than normal 3 and 6 months out but have a larger than normal median performance one year out. Technology and the S&P 500 more broadly, meanwhile, have seen worse than normal performance 6 and 12 months out and inline performance 3 months later.
