Bespoke’s Morning Lineup – 12/2/21 – Apple (AAPL) Falls
See what’s driving market performance around the world in today’s Morning Lineup. Bespoke’s Morning Lineup is the best way to start your trading day. Read it now by starting a two-week trial to Bespoke Premium. CLICK HERE to learn more and start your trial.
“Our liquidity is fine. As a matter of fact, it’s better than fine. It’s strong.” – Kenneth Lay
Good Morning Subscriber,
Today marks the 20-year anniversary of the Enron bankruptcy, and if you think the last few days in the market have been lousy, it was nothing compared to late 2001 when we were in the middle of the dot-com bust, coming out of 9/11, and heading into another rough year in 2002 when Worldcom eventually collapsed as well.
Futures are higher this morning, but traders aren’t even waiting until the opening bell to raise cash as Nasdaq futures have reversed into the red and the Dow and S&P 500 have also given up much of their earlier gains. One of the main culprits behind the weakness this morning is a report from Bloomberg that Apple (AAPL) has told suppliers that demand for the iPhone 13 after the holidays may not be as strong as previously estimated. AAPL had been a bright spot in the Nasdaq over the last few trading days but is trading down over 3% in the pre-market.
Read today’s Morning Lineup for a recap of all the major market news and events from around the world, including the latest US and international COVID trends.
Yesterday was an extremely disappointing day for small caps as the Russell 2000 rallied more than 2% intraday only to give it all back and a lot more throughout the trading day. By the time the closing bell rang, the Russell 2000 was down over 2% on the day. Since the Russell 2000 tracking ETF (IWM) launched in early 2000, yesterday was just the 9th time that the ETF saw a similar intraday rally (+2%) only to finish the day down more than 2%. Each of those days is shown as a red dot in the chart below. Despite over 20 years of trading history for IWM, all eight prior occurrences were confined to a two-month period in 2008 (six occurrences) and a three-week period in 2020 (two occurrences).
Unlike yesterday’s reversal, most of the other occurrences came well into market declines. The only exception was on 3/3/20. Interestingly enough, that occurrence also followed a period of sideways trading for the Russell where it broke out of a multi-month range (but didn’t reach a new high) only to reverse and sell-off sharply into the COVID crash. It’s unlikely the Omicron variant will cause the same sort of market turmoil that COVID initially created in early 2020, but the Fed is certainly not going to be nearly accommodative going forward as they have been since early 2020.
This morning, Russell 2000 futures are indicated higher by about 1%, but to put that in perspective, the gain isn’t even enough to bring the index back to where it was trading 15 minutes before the close yesterday.

Start a two-week trial to Bespoke Premium to read today’s full Morning Lineup.
Stocks with Aggressive Valuations Getting Crushed
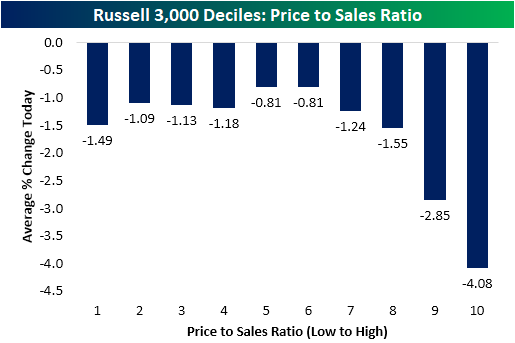
One theme popping in and out of recent price action has been the underperformance of stocks with higher valuations. That was once again apparent today. In the chart below, we break down the Russell 3,000 into equal-sized deciles (10 groups) based on their price to sales ratios (sorted from those with the lowest ratio to the highest). As shown, the stocks with the highest P/S ratios significantly underperformed today with the decile of the most elevated ratios falling over 4% on average. The ninth decile similarly experienced outsized declines of 2.85% compared to the average stock in the index which fell 1.6% today.
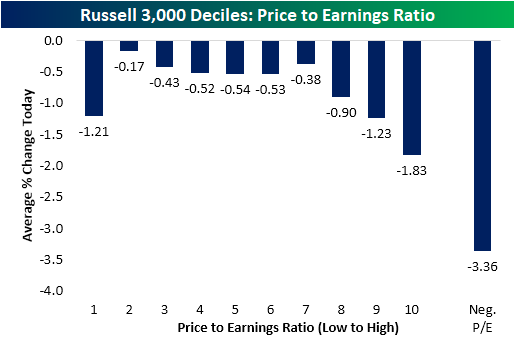
Turning to another common valuation metric, the P/E ratio, the dynamic is just as evident. In the chart below we again broke the Russell 3,000 into equal-sized deciles except we separated out all stocks with negative earnings as well. Nearly a third of the index has a negative P/E ratio at this point! As shown, the stocks with negative earnings (no P/E ratio) got absolutely crushed today with an average drop of 3.36%. Click here to view Bespoke’s premium membership options.
Semis Outperforming Software
Over the last year, the performance of semiconductor stocks has been highly correlated to that of software stocks. Over the last 12 months, the median 50-day rolling correlation coefficient between the iShares Expanded Tech-Software Sector ETF (IGV) and the iShares Semiconductor ETF (SOXX) was +0.77. Currently, the 50-day rolling correlation coefficient is 0.59 due to a recent divergence between the performance of the two ETFs, and since the start of November, the two ETFs have actually been inversely correlated (-0.31). As you can see in the chart below, SOXX has significantly outperformed IGV since the start of November. gaining 11.7% versus a 6.6% decline for IGV.

As implied by the chart above, the relative strength of SOXX vs IGV has moved upwards since the start of November. Although SOXX has mostly outperformed IGV over the last 12 months, the difference between the two is currently the largest of the last 12 months with a 24 percentage point spread between the performance of the two ETFs.

Looking back over time, when we have seen similar performance disparities where SOXX outperforms IGV by 15 percentage points or more in a month (with no prior occurrences in the prior three months), forward performance has been mixed. In terms of the next week’s performance, in two of the three prior periods, SOXX underperformed over the following week, but over the following month and three months, SOXX continued to outperform. A sample size of three is on the small side, and even with just three occurrences there is no clear trend in performance, so we wouldn’t read too much into the results. Click here to view Bespoke’s premium membership options.

Bespoke Market Calendar — December 2021
Please click the image below to view our December 2021 market calendar. This calendar includes the S&P 500’s average percentage change and average intraday chart pattern for each trading day during the upcoming month. It also includes market holidays and options expiration dates plus the dates of key economic indicator releases. Start a two-week free trial to one of Bespoke’s three research levels.

Bespoke’s Morning Lineup – 12/1/21 – Loves Me, Loves Me Not
See what’s driving market performance around the world in today’s Morning Lineup. Bespoke’s Morning Lineup is the best way to start your trading day. Read it now by starting a two-week trial to Bespoke Premium. CLICK HERE to learn more and start your trial.
“I am a warrior, so that my son may be a merchant, so that his son may be a poet.” – John Quincy Adams
You may think that the market has been volatile over the last several trading days, but just be thankful it’s not 1824. Back in November of that year, no candidate for President received the required majority of electoral votes in the election which forced Congress, on December 1st, to turn the election over the House of Representatives and basically choose between Andrew Jackson and John Quincy Adams. The actual winner wasn’t decided for more than two months when John Quincy Adams came out on top in early February 1825. Despite coming in second in the actual election, Adams’ victory came thanks to the backing of Henry Clay in what was called the ‘Corrupt Bargain’, and because he wasn’t the most popular candidate in the election, Adams’ presidency was largely considered to be unimpactful. Can you imagine in this political climate if the House was actually deciding an election today?
Futures are higher this morning as investors can’t decide which way they want the market to go as the S&P 500 goes back and forth between 1% losses and 1% gains in a game of ‘Loves Me, Loves Me Not’. One thing to note is that just as Monday’s 1% rally was weaker in magnitude than Friday’s drop, we’re seeing the same pattern play out today where the S&P 500 is on pace to open higher by 1.4% after Tuesday’s 1.95% decline.
In yesterday’s rout, only seven stocks in the S&P 500 finished the day higher, which was the weakest breadth reading since June 11th, 2020. Breadth in small caps wasn’t nearly as weak as the S&P 500 yesterday (more than 400 stocks traded higher), but its breadth reading on Friday was also the weakest since June 11th.
On the data docket today, the ADP Private Payroll report for November was released at 8:15 AM and came in higher than expected with little impact on futures. The only two other reports on the calendar today are Construction Spending and ISM Manufacturing which will be released at 10 AM. Powell and Yellen will also be testifying in front of the House this morning, and yesterday, the S&P 500 was only down modestly while the Nasdaq was actually higher before Powell’s testimony.
Read today’s Morning Lineup for a recap of all the major market news and events from around the world, including the latest US and international COVID trends.
2021 has really been a pretty crazy year for small-cap stocks. After doubling from its COVID lows, the Russell 2000 peaked in early March and traded in a sideways range through the summer and into the fall. After several close calls at a 10% correction, including a 9.7% drop on a closing basis through mid-July, the Russell finally broke out of its trading range in early November to trade at a new record high. From its first new high on 11/2, though, the breakout for IWM didn’t last long. After rallying an additional 3.4% in the four trading days since its first new closing high since March, it’s been a one-way trip lower for small caps ever since, and through yesterday’s close, IWM closed down 10.1% from its record high earlier this month. What the Russell couldn’t do in more than six months from early March through the end of Summer, it did in just 15 trading days this month!

Start a two-week trial to Bespoke Premium to read today’s full Morning Lineup.
Technology and Communication Services Diverge
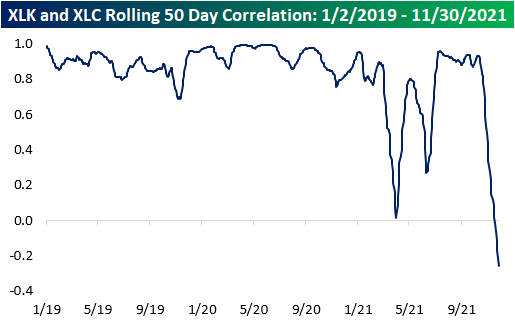
Typically, the Technology and Communication Services sectors tend to have high levels of correlation. However, beginning in mid-October, that relationship started to change course. While there have been other performance divergences between the two sectors this year, the current disparity is particularly noteworthy. Since mid-October, the Technology Select Sector SPDR Fund (XLK) and the Communications Services Select Sector SPDR (XLC) have been moving in opposite directions causing the YTD performance spread between the two sectors to widen out to the most extreme level of the year with Technology outperforming by 15.9 percentage points.
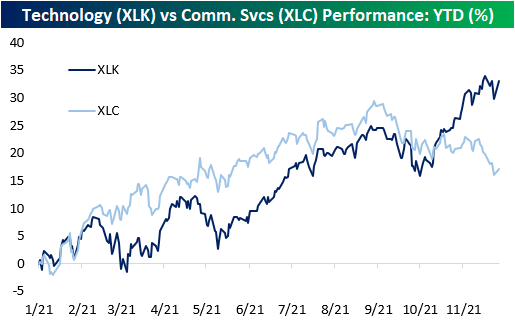
Since the start of 2019, just after Standard and Poors switched major stocks like Facebook (FB) and Alphabet (GOOGL) out of the Technology sector and into Communication Services the two ETFs tracking these sectors have had a median 50-day rolling correlation coefficient of +0.89, which implies a strong relationship between the two. For the years 2019 and 2020, the minimum correlation coefficient was +0.68, which still signifies a strong relationship. In 2021, though, the relationship has reversed and actually inverted this month, meaning that over the last 50 days, the two sectors are moving in opposite directions.Click here to view Bespoke’s premium membership options.
Natural Gas Tanks
Since Friday’s close, US natural gas future prices have declined 16.4% as of 11:00 AM on Tuesday, but there have been price discrepancies across the globe. We discussed these differences between natural gas prices in the US versus Europe in today’s Morning Lineup. In the US, natural gas prices have not seen a two-day decline in excess of 15% since 12/31/18 and going back to 2000, two-day pullbacks of this magnitude have only occurred 12 other times, four of which occurred within a month and a half time period (12/13/2000 – 1/30/2001). Heading into the current decline, the speculator net position was in a normal range, so dramatically offsides positioning from futures traders is likely not the driving factor behind this move. For more information on that positioning data, check out Monday’s Closer.

Looking ahead, forward returns of natural gas after a two-day pullback of more than 15% (without another occurrence in the prior three months) tend to be negative (which can be seen as a positive for consumers as it translates to lower energy costs). The day after the six prior periods shown, the average next-day performance for natural gas was a decline of 0.7% (median: -2.9%). Over the next week, the average decline was just 0.4% but the median decline was much greater at 6.1%. Looking out over the next one and three months, performance continued to weaken with average declines of 8.8% (median: 9.2%) and 4.9% (median: -8.7%), respectively. Downside momentum in natural gas was also pretty consistent across as natural gas was only positive across all the time windows shown one-third of the time. Click here to view Bespoke’s premium membership options.

Bespoke’s Morning Lineup – 11/30/21
See what’s driving market performance around the world in today’s Morning Lineup. Bespoke’s Morning Lineup is the best way to start your trading day. Read it now by starting a two-week trial to Bespoke Premium. CLICK HERE to learn more and start your trial.
“History doesn’t repeat itself, but it often rhymes.” – ???
On this day in 1835, Samuel Clemens aka Mark Twain, considered by many to be one of the greatest American writers, was born. While the quote above has often been attributed to Twain, there is no documented evidence that he ever said the last part of the quote. One variation he has written was “History never repeats itself, but the Kaleidoscopic combinations of the pictured present often seem to be constructed out of the broken fragments of antique legends.” Not quite as succinct but along the same lines.
Whoever said it, the fact that history doesn’t repeat itself, but it often rhymes is often on display in financial markets. While there’s no historical parallel to the current period of COVID and the unprecedented amount of stimulus that has been put into the system, human emotions are always a driving factor in market movements, and when faced with increased uncertainty, many investors choose to sell first and ask questions later- even if the headlines driving the market lower today (vaccines and COVID treatments potentially being less effective against the Omicron variant) were also in the market yesterday as well.
Equity futures are indicating a sizable decline at the open with the Dow leading things lower. The moves in the Energy and Treasury market have been even more notable with WTI trading under $68 a barrel, nat gas down over 6% after a 10% decline yesterday, and the yield on the 10-year down below 1.44% to its lowest level since late September.
Read today’s Morning Lineup for a recap of all the major market news and events from around the world, including the latest US and international COVID trends.
There’s been quite a bit of bifurcation in sector performance over the last several trading days. While four sectors are up over the last five trading days, they’re all among the smallest sectors in the market. At the bottom of the list, two sectors (Communication Services and Industrials) are down over 2% while another two are down more than 1.5% (Consumer Discretionary and Materials). Technology, the S&P 500’s largest sector is also down but by a more modest 0.68%.

Start a two-week trial to Bespoke Premium to read today’s full Morning Lineup.
Another Deceleration Out of Dallas
November regional Fed manufacturing surveys have been pretty mixed but generally have shown activity decelerating. The fifth and final report out of the Dallas Fed released this morning reiterated that slowdown in manufacturing activity. The Dallas Fed’s headline reading was expected to show a modest increase from 14.6 to 15.0. Instead, as with other regional Fed surveys, activity decelerated with Business Activity falling to 11.8. While current conditions did not improve as rapidly as expected, expectations were relatively optimistic and have risen sharply over the past two months recovering most of the decline since June’s high.

While General Business Activity was lower, under the hood the report was pretty good with more categories moving higher than lower. Additionally, the bulk of these categories remain at historically strong levels. In fact, Company Outlook is the only one in the lower half of its historical range. General Business Activity and Captial Expenditures are the only others that are not in the upper quartile of readings.
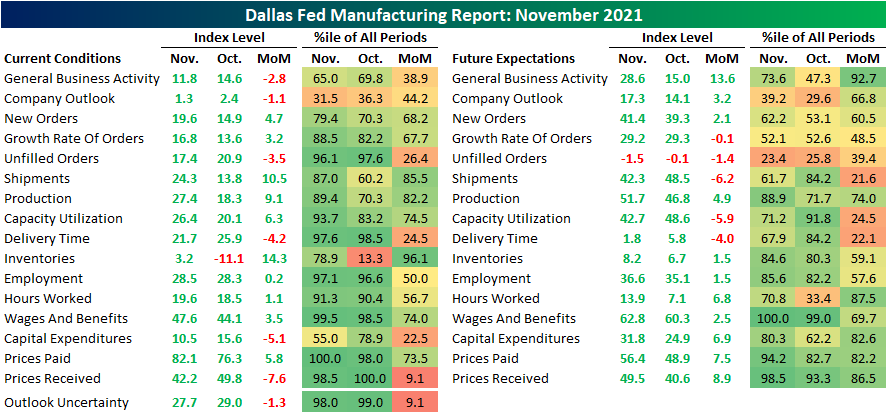
Demand has continued to rebound with New Orders rising from 14.9 in October to 19.6 this month. Given the higher Order Growth Rate, Unfilled Orders also continue to rise at a historically elevated rate, though, that reading did fall in November as Shipments have picked up.

That increase in Shipments also likely had to do with alleviation for supply chains as the index for Delivery Times fell by 4.2 points. Other regional Fed surveys echoed those results this month with declines in Delivery Times of their own. That being said, the index remains historically elevated, and the commentary of the report points to a slew of supply chain-related issues holding back business. Given Delivery Times were not as long and production has risen, Inventories rose back into positive territory.

While there is evidence of improving supply chains, prices for raw materials are still rising. The index for Prices Paid has resumed its move higher and set the first record high since June. Conversely, Prices Received experienced a sharp reversal lower from a record high set last month.

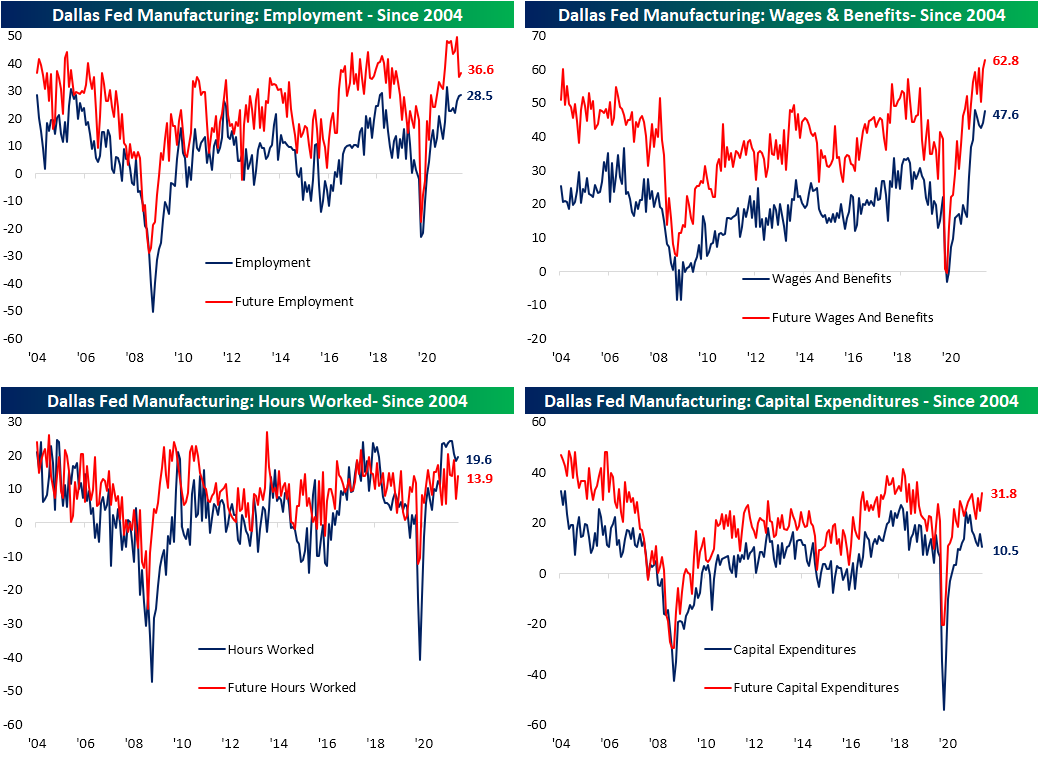
The price of labor is also continuing to rise. The index for Wages and Benefits came in only a half-point below the June record high. Even though current conditions narrowly missed a new high, expectations did set a new record. Not only did firms report that they expect to pay more for labor, but the same goes for Capital Expenditures. That category’s expectations index hit the highest level since March 2019 in November even while the current conditions index came in at the lowest level since the end of 2020. Pivoting back to labor, the index for Employment and Hours Worked were both moderately higher in November. Expectations for these two categories also rebounded after steep drops in October. Click here to view Bespoke’s premium membership options.
Texas Tea Double Digit Dip
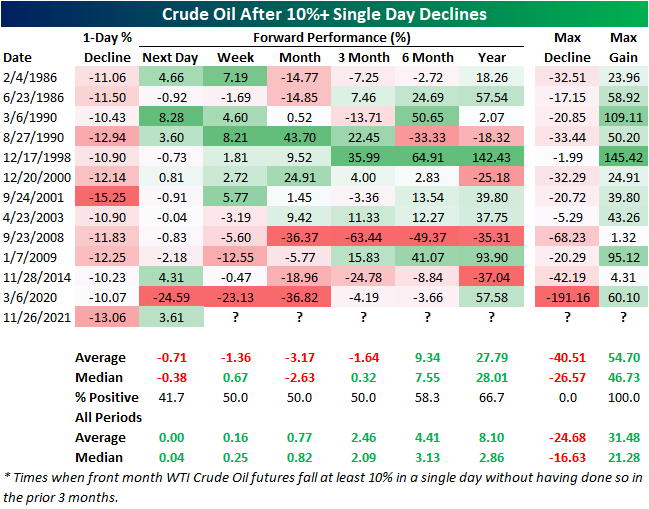
Crude oil prices are back on the rise this week after a sharp decline last Friday. As for how severe of a drop it was, front-month WTI futures fell 13.06% which was the worst single-day decline since April of last year; the same month that saw crude prices dive into negative territory. Looking back to 1983, including last Friday, there have only been 32 days in which crude has fallen double-digit percentage points in a single session. Outside of the series of volatile moves in March and April 2020, November 28, 2014 was the last time that there was as sharp of a decline of at least 10 percentage points.

Crude prices are rebounding today and are currently back above $70, although they’ve been pulling back all morning. In the table below, we show the other dozen times prior to Friday in which crude oil fell at least 10% in one day without having done so in the prior 3 months. As shown, today’s rebound is actually pretty abnormal with WTI typically declining the day after a 10% drop.
As for longer-term forward performance, crude has continued to average declines out over the next three months with positive returns only half the time. On the other hand, six months to one year out has tended to see stronger than normal returns for the commodity. Click here to view Bespoke’s premium membership options.