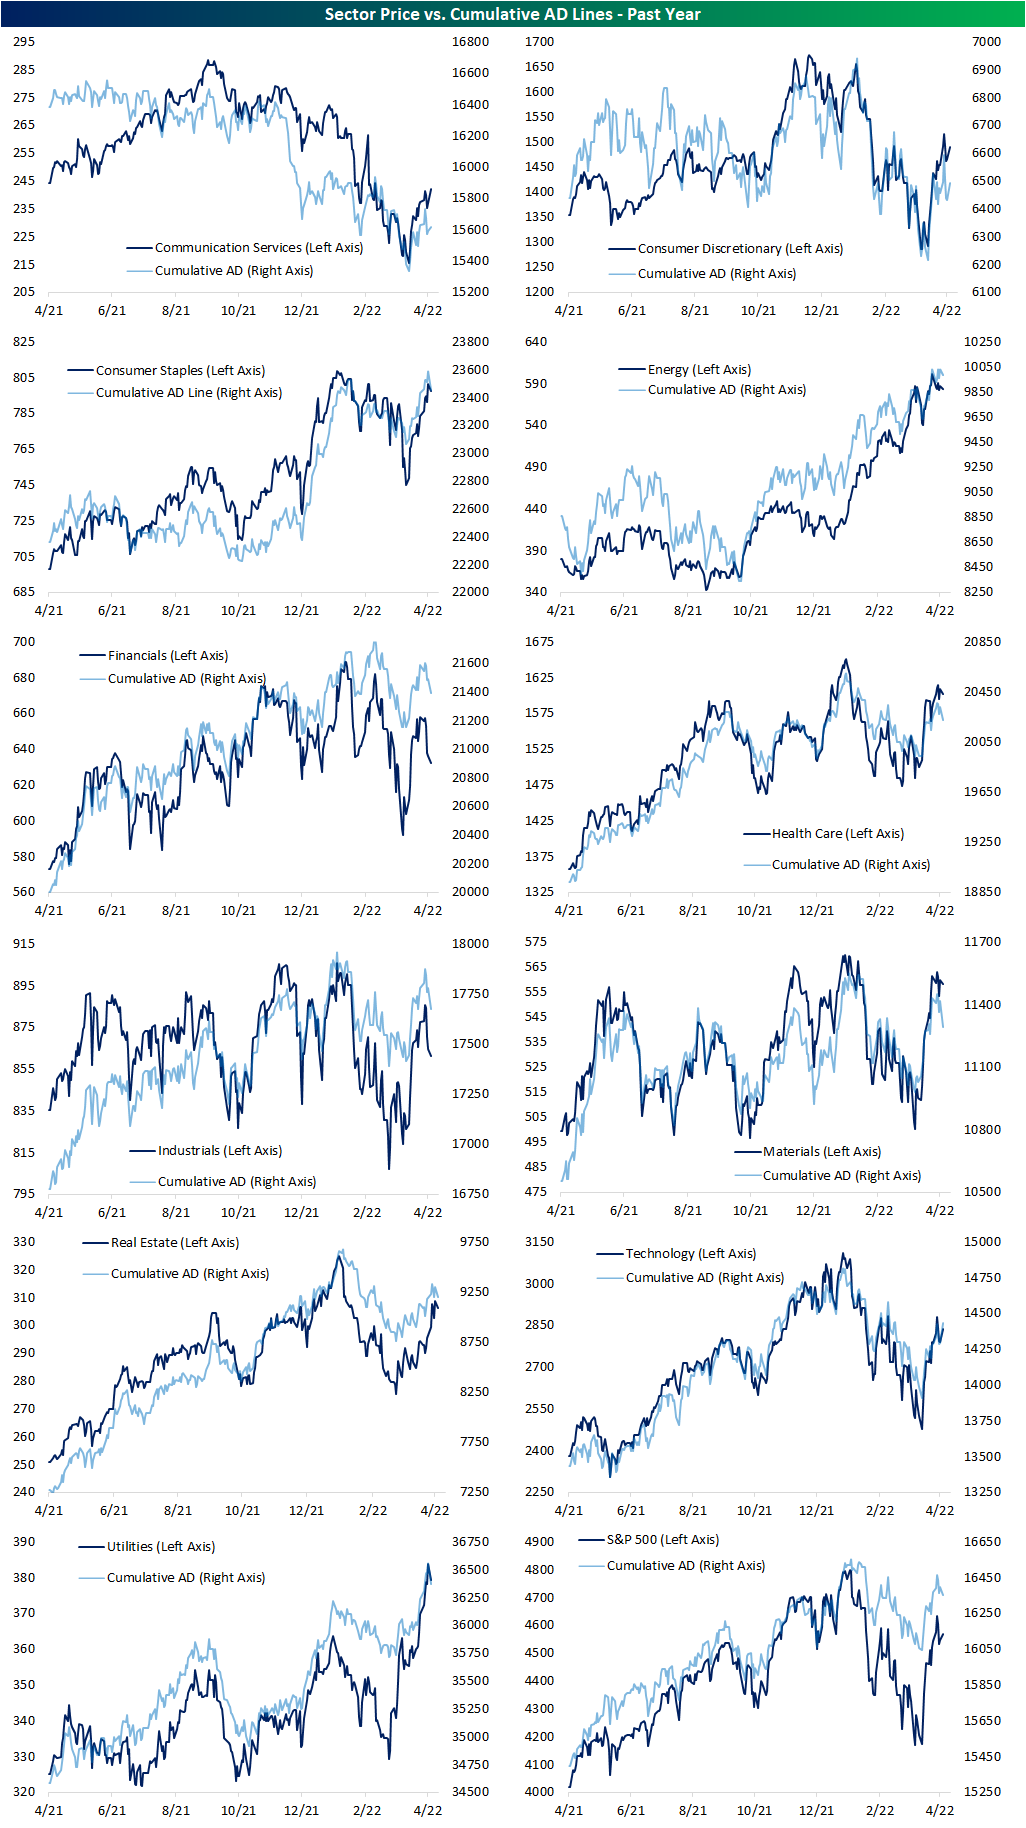
Sector Price and Breadth Update
In an earlier tweet, we highlighted some charts from our Sector Snapshot highlighting the new highs in multiple sectors’ cumulative advance-decline (A/D) lines as of Friday. The cumulative A/D line is used to signal confirmation of a trend by indicating broad participation of an index’s underlying stocks in a rally or decline. In the charts below, we show those same A/D lines updated through today with price also included on the opposite axis.
Utilities, Consumer Staples, and Energy are seeing their AD lines pull back from new highs, but price has been somewhat disconnected. On the one hand, for Consumer Staples, unlike the A/D line, price never broke out above the late 2021/early 2022 levels. Energy, meanwhile, has seen breadth hold up fairly well while its price has been experiencing a more consistent decline in recent days. On the other hand, Utilities have seen price and breadth move more healthily in sync with one another. Communication Services has been somewhat the inverse of these three sectors. While breadth is positive today, the cumulative A/D line is not setting any new short-term highs even as the price is. That is mostly a result of the huge gain in Twitter (TWTR) having an outsized impact on the sector.
Most other sectors have recently seen consistent moves between price and breadth without any sort of major new highs or lows. Technology is close to moving above last week’s high on both a price and breadth basis while both readings for Financials and Industrials have been falling sharply. For Materials, another cyclical sector, breadth and price have been moving in the same direction, but the decline in the cumulative A/D line stands out slightly more. Click here to view Bespoke’s premium membership options.
 .
.
Bespoke’s Morning Lineup – 4/4/22 – Elon Flips the Bird
See what’s driving market performance around the world in today’s Morning Lineup. Bespoke’s Morning Lineup is the best way to start your trading day. Read it now by starting a two-week trial to Bespoke Premium. CLICK HERE to learn more and start your trial.
“Given that Twitter serves as the de facto public town square, failing to adhere to free speech principles fundamentally undermines democracy.” – Elon Musk
Heading into today, it was looking like a quiet start to what was looking like a slow week as the economic calendar is light and earnings season doesn’t kick off for at least another week. That changed a bit following news that Elon Musk had taken a passive 9.2% stake in Twitter (TWTR) pushing the stock up by more than 25% in pre-market trading to its highest level since late November. Last week on Twitter, Musk made the statement at the top of this note and then followed up with the question, “What should be done?” Well, this morning we appear to be getting an answer. Twitter has long been criticized for not realizing its full potential, and TWTR shareholders are hoping Musk can move the company in that direction.
Read today’s Morning Lineup for a recap of all the major market news and events from around the world, including the latest US and international COVID trends.
With the stock poised to open up more than 20% this morning, it will be just the fourth time in its history as a public company in 2013 that TWTR has gapped up more than 20%. Two of those days were in reaction to earnings (July 2014 and February 2018), and then on the day of its IPO in November 2013. Today, it’s all Elon.

Start a two-week trial to Bespoke Premium to read today’s full Morning Lineup.
Bespoke Brunch Reads: 4/3/22
Welcome to Bespoke Brunch Reads — a linkfest of the favorite things we read over the past week. The links are mostly market related, but there are some other interesting subjects covered as well. We hope you enjoy the food for thought as a supplement to the research we provide you during the week.
While you’re here, join Bespoke Premium with a 30-day free trial!
Russia
Russia Built Parallel Payments System That Escaped Western Sanctions by Alexander Osipovich and AnnaMaria Androtis (WSJ)
While Russia’s central bank and debt markets have been badly hobbled by sanctions, consumer payments are flowing thanks to the country’s homegrown payments system. [Link; paywall]
War with Russia? Finland has a plan for that by Richard Milne (FT)
Finland’s larger neighbor has long been a threat, and the response from Finnish society has been a layered approach that builds best practices for national defense into all aspects of social planning. [Link; soft paywall]
Politics
Democrats: Go Directly to the Center by Ruy Teixeira (The Liberal Patriot)
A plea for Democrats to hue away from the left ahead of midterms later this year, though whether they can recover from the traditional mean-reversion against the majority during a President’s first term regardless of their pitch to voters is an open question. [Link]
Why are women voters moving to the left? by Stephen Bush (FT)
Across the developed world, women are increasingly voting to the left, with the patterns holding across a range of countries over the past decade or so. [Link; soft paywall]
Driving
A Rugged Newcomer Looks to Fill a Void Left by Land Rover by Mercedes Lilienthal (NYT)
Upstart auto manufacturer INEOS Group is hoping to seize the terrain vacated by Jaguar Land Rover when it discontinued its venerable Defender SUV in 2016. [Link; soft paywall]
ES…Something
Expensify’s unusual diversity drive by Jamie Powell (FT Alphaville)
A SaaS company that IPO’d last year is going to contribute 25% of salaries paid to white, male employees to a foundation that focuses on housing equity, youth advocacy, food security, reentry services, or climate justice. [Link; registration required]
Seeing Green
Positive Drug Tests Among U.S. Workers Hit Two-Decade High by Will Feuer (WSJ)
Roughly one in twenty five drug tests processed by Quest Diagnostics last year came back positive as legalized marijuana spread across the country. [Link; paywall]
Speculation
Ben McKenzie Would Like a Word With the Crypto Bros by David Yaffe-Bellany (NYT)
The fascinating story of how the former star of The OC has become a voice of reason and anti-crypto activist in the midst of a campaign against his fellow celebrities’ constant shilling. [Link; soft paywall]
Organized Crime
Citrus fruits, scurvy and the origins of the Sicilian mafia by Alessia Isopi and Arcangelo Dimico (The Conversation)
The origins of la cosa nostra in Sicily during the 19th century are obscure, but probably had a lot to do with the booming demand for citrus brought on by a desire to keep sailors away from scurvy during long-distance sea voyages. [Link]
Renewables
Global wind and solar growth on track to meet climate targets by Forrest Crellin (Reuters)
If the wind and solar industry can continue growing at its 10 year growth rate over the next decade, there will be enough renewable energy supplanting carbon-based generation to reduce sufficiently to limit warming to 1.5 degrees Celsius. [Link]
Study Up
Class Attendance in College: A Meta-Analytic Review of the Relationship of Class Attendance With Grades and Student Characteristics by Marcus Credé, Sylvia G. Roch, and Urszula M. Kieszczynka (Review of Educational Research)
Regular class attendance is an incredibly consistent predictor of academic success across a wide variety of outcomes and controls, outperforming all other variables. [Link; 25 page PDF]
Read Bespoke’s most actionable market research by joining Bespoke Premium today! Get started here.
Have a great weekend!
The Bespoke Report – 4/1/22 – Just a Mirage?
This week’s Bespoke Report newsletter is now available for members.
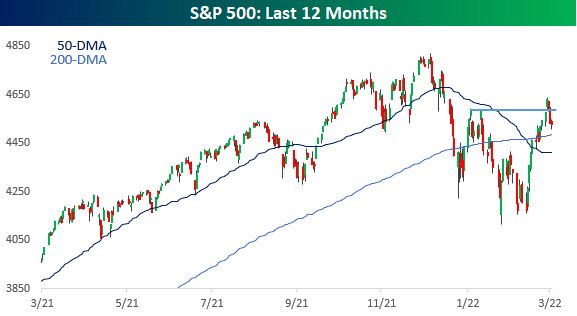
After a bounce in the second half of March that surprised just about everyone watching, the last two trading days of Q1 and the first trading day of Q2 have called into question whether or not the rally was the real thing. On the positive side, the gains that stalled out earlier this week pushed the S&P 500 back above its 50 and 200-day moving averages as well as the highs from early February forming a higher high in the process. On the negative side, the highs from February didn’t hold for long as Thursday’s waterfall decline to close out the quarter took the S&P 500 back below those levels.
Friday started off with some gains, but sellers quickly took control as equities weakened throughout the day before some stabilization into the close. While the February highs are overhead resistance again, bulls will be closely watching the major moving averages for signs of support. This week’s declines haven’t been enough yet to cause bulls to lose hope, but it won’t be a worry-free weekend either.
With the beginning of a new quarter, markets are in a bit of a limbo period as investors await what is likely to be a volatile earnings season, but there was still a lot to cover this week. There’s not enough time (or computer memory) to cover everything that transpired this week, but we tried to cover some of the most pressing macro issues. Make sure to check it all out in this week’s Bespoke Report.
To read this week’s full Bespoke Report newsletter and access everything else Bespoke’s research platform has to offer, start a two-week trial to one of our three membership levels.


Bespoke Market Calendar — April 2022
Please click the image below to view our April 2022 market calendar. This calendar includes the S&P 500’s average percentage change and average intraday chart pattern for each trading day during the upcoming month. It also includes market holidays and options expiration dates plus the dates of key economic indicator releases. Click here to view Bespoke’s premium membership options.

Bespoke’s Crypto Report – 4/1/22
Bespoke’s Crypto Report contains numerous technical, momentum, and sentiment charts for bitcoin, ethereum, and other key cryptos. Page 1 of the report includes our weekly commentary on the space and attempts to identify any new trends that are emerging. The remaining pages include important overbought/oversold levels to watch, charts on historical drawdowns and rallies, seasonality trends, futures positioning data, Google search trend shifts, and more. Our weekly Crypto Report is produced so that followers of the space can more easily stay on top of price action, technicals, seasonality, and sentiment.
Sign up for a monthly or annual subscription to Bespoke Crypto to receive our weekly Crypto Report and anything else we publish related to cryptos. Note: If you’re currently a Bespoke Premium, Bespoke Newsletter, or Bespoke Institutional subscriber, you’ll need to subscribe to Bespoke Crypto as an add-on to receive access. The weekly Crypto Report and any additional crypto analysis is not included with our Premium, Newsletter, or Institutional memberships. You can sign up for Bespoke Crypto and receive our Crypto Report in your inbox weekly using the monthly or annual checkout links below. If you sign up for the annual plan, the first year of access is 50% off!
Bespoke Crypto Access — Monthly Payment Plan ($49/mth)
Bespoke Crypto Access — Annual Payment Plan ($247.50 for the first 12 months, then $495/year in year 2 and beyond)

Bespoke Investment Group, LLC believes all information contained in this service to be accurate, but we do not guarantee its accuracy. None of the information in this service or any opinions expressed constitutes a solicitation of the purchase or sale of any securities, commodities, or cryptocurrencies. This service contains no buy or sell recommendations. This is not personalized advice. Investors should do their own research and/or work with an investment professional when making portfolio decisions. As always, past performance of any investment is not a guarantee of future results. Bespoke representatives or clients may have positions in securities discussed or mentioned in its published content.
Bespoke’s Consumer Pulse Report — April 2022
Bespoke’s Morning Lineup – 4/1/22 – Clean Slate
See what’s driving market performance around the world in today’s Morning Lineup. Bespoke’s Morning Lineup is the best way to start your trading day. Read it now by starting a two-week trial to Bespoke Premium. CLICK HERE to learn more and start your trial.
“The strength of the team is each individual member. The strength of each member is the team.” – Phil Jackson
It’s a new quarter today, but markets will get right into it today with a good deal of economic data. For starters, we get the March employment report at 8:30 eastern, and then at 10 AM, we’ll get Construction Spending and the ISM Manufacturing report. While payrolls are expected to show a modest decline, ISM Manufacturing is expected to see a modest bounce. With the employment report, though, the devil will be in the details.
In Europe, equities are trading higher following what has generally been weak manufacturing PMI data in the region. Interest rates are moving higher on the day while crude oil has dropped below $100 per barrel.
After a plunge into the close yesterday, futures are looking to claw back those losses in early trading, but even at current levels, we’re only basically back to where we were a half-hour before yesterday’s close.
Read today’s Morning Lineup for a recap of all the major market news and events from around the world, including the latest US and international COVID trends.
April may bring showers in terms of the weather, but historically it has been one of the greener months of the year. Over the last 100 years, the Dow’s average gain of 1.46% with positive returns 62% of the time ranks as the third-best of any month behind July (1.65%) and December (1.52%). In the last 50 years, the 68% frequency of positive returns hasn’t been the most consistent, but the 2.21% average gain is easily the highest of any month. Likewise, the average gain of 2.21% in the last 20 years has also been the strongest of any month. Not only that, but with just three down Aprils over the last 20 years, no other month during this period has been more consistent to the upside.

Start a two-week trial to Bespoke Premium to read today’s full Morning Lineup.
The Bespoke 50 Growth Stocks – 3/31/22
The “Bespoke 50” is a basket of noteworthy growth stocks in the Russell 3,000. To make the list, a stock must have strong earnings growth prospects along with an attractive price chart based on Bespoke’s analysis. The Bespoke 50 is updated weekly on Thursday unless otherwise noted. There were no changes to the list this week.
The Bespoke 50 is available with a Bespoke Premium subscription or a Bespoke Institutional subscription. You can learn more about our subscription offerings at our Membership Options page, or simply start a two-week trial at our sign-up page.

The Bespoke 50 performance chart shown does not represent actual investment results. The Bespoke 50 is updated weekly on Thursday. Performance is based on equally weighting each of the 50 stocks (2% each) and is calculated using each stock’s opening price as of Friday morning each week. Entry prices and exit prices used for stocks that are added or removed from the Bespoke 50 are based on Friday’s opening price. Any potential commissions, brokerage fees, or dividends are not included in the Bespoke 50 performance calculation, but the performance shown is net of a hypothetical annual advisory fee of 0.85%. Performance tracking for the Bespoke 50 and the Russell 3,000 total return index begins on March 5th, 2012 when the Bespoke 50 was first published. Past performance is not a guarantee of future results. The Bespoke 50 is meant to be an idea generator for investors and not a recommendation to buy or sell any specific securities. It is not personalized advice because it in no way takes into account an investor’s individual needs. As always, investors should conduct their own research when buying or selling individual securities. Click here to read our full disclosure on hypothetical performance tracking. Bespoke representatives or wealth management clients may have positions in securities discussed or mentioned in its published content.
Bears Go Back Into Hibernation
The last couple weeks of the first quarter have seen equities reverse a sizable portion of this year’s losses and sentiment has rebounded in sync, though, bullish sentiment turned slightly lower this week in spite of the S&P 500’s move higher. From the weekly AAII sentiment survey, bullish sentiment shed 0.9 percentage points coming in at 31.9%. Even after that decline, the current level of reported optimism remains above all others (outside of last week) since early January, but bullish sentiment still would need to rise another 6 percentage points to move back up to its historical average.

While more investors are not reporting much optimism, fewer are outright bearish. Bearish sentiment fell for a second week in a row falling another 7.9 percentage points to 27.5%. With a little over a quarter of respondents reporting as bearish, this sentiment reading is at the lowest level since November. That is also now the biggest two-week decline in bearish sentiment (22.3 percentage points) since November 2009 when it had fallen 23.74 percentage points in a two-week span.

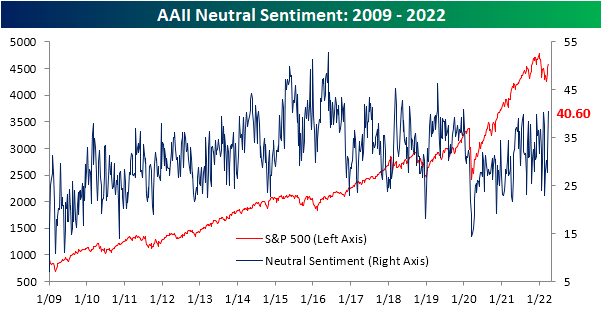
Finally, we would note that given bearish sentiment has plummeted at a historic rate without much of an increase in bullish sentiment, neutral sentiment has picked up the difference. That reading clipped above 40% this week for the highest level since January 2020.
Other sentiment surveys like the Investors Intelligence one and NAAIM’s Exposure Index have also pivoted more bullish this week. As a result, our sentiment composite is close to zero meaning across these three indicators, sentiment is now only just slightly below the historical average. Click here to view Bespoke’s premium membership options.
