The Ups and Downs of Sentiment
In today’s Morning Lineup, we discussed the sideways range the S&P 500 has found itself in over the past eight trading days. With indecisive price action, sentiment—as measured by the AAII’s weekly survey— has been equally undecisive. After picking up substantially last week from 19.8% to 32.0%, the percentage of respondents reporting as bullish has reversed most of its gains coming in at 21.0% this week%

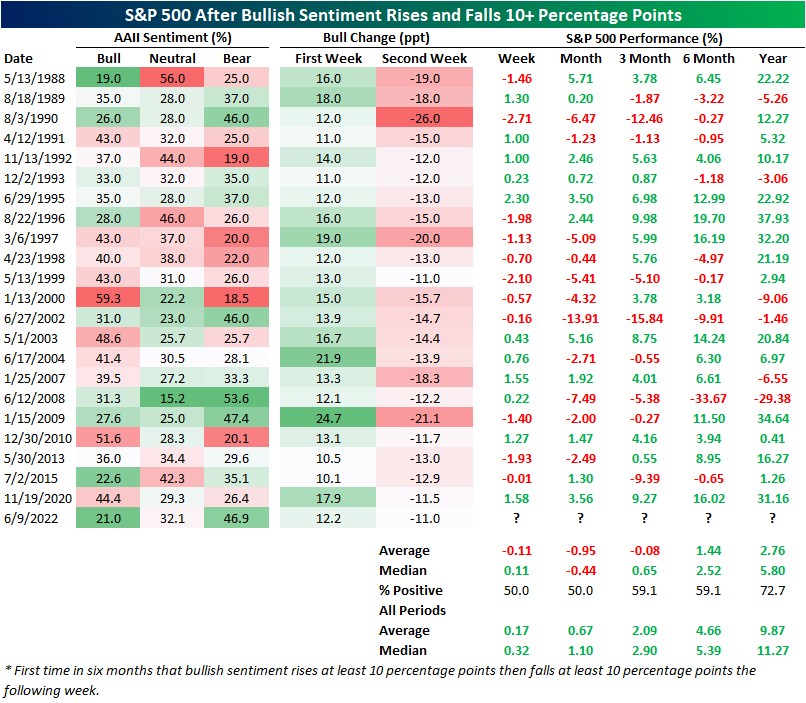
Back-to-back weeks of double-digit moves (either positive or negative for both weeks) in bullish sentiment are relatively rare with only about 4.6% of all weeks in the history of the survey dating back to 1987 seeing such a move. Of those, less than two dozen resemble this week with bulls rising by at least 10 percentage points in the first week followed by a 10 or more percentage point drop the next week for the first time in at least six months. The most recent occurrence (of any double-digit back-to-back moves) was over a year ago in November 2020 when bulls rose by an even larger 17.9 percentage points followed by an 11.5 point drop. We would also note that the current situation has the second-lowest reading in bullish sentiment of these past instances behind May 1988—roughly one year after the survey began—when it was two percentage points lower.
As we have frequently noted in the past, low bullish sentiment has actually tended to be a positive signal for forward performance of equities. Although that could pose an optimistic sign for the S&P 500 going forward, big swings up then down then have not tended to be the best sign for equities. As shown below, after similar moves in bullish sentiment, performance for the S&P 500 one week and month later has been positive only half the time with an average decline of 0.11% and 0.95%, respectively. While performance is more often than not positive three months later, the S&P 500 has averaged an 8 bps decline versus the norm of an average gain of 2.9%. Six and twelve-month performance is similarly more consistently positive but does not outperform the norm.
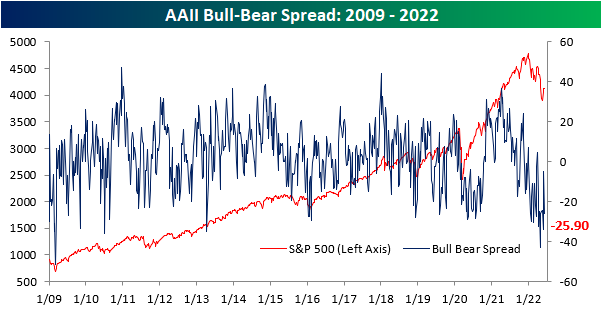
As bulls stepped back this week, bears recouped nearly 10 percentage points rising from 37.1% to 46.9%. While that is still below the readings above 50% observed throughout April and May, historically that is an elevated reading well above the historical average of 30.7%.

Given this, the bull-bear spread moved deeper into negative territory meaning bears continue to heavily outweigh bulls. Bears currently outnumber bulls by 25.9 percentage points. Again, that is a very low level albeit not as extreme as only a couple of weeks ago. Click here to learn more about Bespoke’s premium stock market research service.
Claims Better Behind Seasonality
Seasonally adjusted initial jobless claims came in well above expectations today rising from 202K to 229K. Only an increase of 4K had been penciled in by economist forecasts. Although that increase brings claims up to the highest level in about six months, looking back historically it is still within the range of readings in the few years prior to the pandemic and that is also well below the typical readings for much of the history of the data.

Turning over to non-seasonally adjusted claims, recent readings have been much less volatile. In fact, compared to the seasonally adjusted number whose 27K increase was the largest since July of last year, unadjusted claims experienced a meager 1K uptick relative to last week. While the 1K increase during the current week of the year is very much normal (since 1967 72% of the time the 23rd week of the year has seen NSA claims rise WoW), it wasn’t a particularly large increase. On average, the same week of the year has seen unadjusted claims rise 31K. With the caveat that it covered a holiday week and revisions are still possible, that basically means the bulk of the move this week in the adjusted number was due to that seasonal adjustment rather than a material increase in claims. Taking another look at the unadjusted number, the current week of the year is well below the readings for comparable weeks in the years before the pandemic. In other words, the non-seasonally adjusted number points to a bit more strength than the adjusted number leads on.

Taking another look at the effects of seasonal adjustment, below we show the current series for seasonally adjusted and unadjusted claims as well as the adjusted numbers but using 2019 seasonal factoring (essentially removing any impacts on seasonal adjustment of the outlier-like high readings of the pandemic). While there are some minor discrepancies like how the current series had been understating claims relative to 2019 factoring earlier this year and the 2019 factoring was much more volatile around the holidays last year, overall the adjusted series have tracked one another well indicating that the extremely elevated readings of 2020 and 2021 have not had a major impact in undermining the effectiveness of seasonal factoring.

As the unadjusted initial claims number saw little change, continuing claims—lagged an additional week to the initial claims number— were unchanged week over week. Remaining at 1.306 million, it continues to be the strongest reading in several decades. Click here to learn more about Bespoke’s premium stock market research service.

Bespoke’s Morning Lineup – 6/9/22 – Stuck in a Range
See what’s driving market performance around the world in today’s Morning Lineup. Bespoke’s Morning Lineup is the best way to start your trading day. Read it now by starting a two-week trial to Bespoke Premium. CLICK HERE to learn more and start your trial.
“Everything must be taken into account. If the fact will not fit the theory—let the theory go.” – Agatha Christie

Below is a snippet of content from today’s Morning Lineup for Bespoke Premium members. Start a two-week trial to Bespoke Premium now to access the full report.
Well. it was looking like a positive day. Futures were comfortably higher earlier but have pulled back as we approach the opening bell following the ECB’s monetary policy announcement. The European central bank will be ending asset purchases on July 1st, and hiking rates by 25 bps in July and at least another 25 bps at the September meeting.
The only economic data on the calendar today are initial and continuing jobless claims. Initial jobless claims came in at 229K which was more than 20K above forecasts and the highest level since January. Continuing claims, meanwhile, were unchanged at 1.306 million. While initial claims are still at the low end of their historical range, they have also been trending steadily higher now for 12 weeks.
In today’s Morning Lineup, we discuss market and economic developments in China (pgs 4 & 5), the latest ECB rate decision (pg 5), and economic data out of Asia, Europe, and Mexico (pg 6).
With all the volatility that has emblematized 2022, the Memorial Day weekend seems to have really flipped a switch to the Summer doldrums. Over the last eight trading days, the S&P 500 has traded in what has been a relatively tight trading range. During this period, the S&P 500 has traded on either side of 4,125 each day, and the total spread between the intraday high and low has been 2.5% which represents the narrowest eight-day trading range of the year. Investors have been longing for a period of calm in the markets, and for now, at least they’re getting it.

Start a two-week trial to Bespoke Premium to read today’s full Morning Lineup.
Mortgage Activity Falling Off A Cliff
The economic calendar was light today with the only US releases of note being wholesale trade sales and inventories on top of the regularly scheduled weekly releases for Wednesday. Perhaps the most notable data point was the weekly reading on mortgage applications from the Mortgage Bankers Association. As the national average for a 30 year fixed rate mortgage has resumed its move higher and is once again above 5.5%, mortgage refinance applications continue to fall as fewer homeowners are balking at the highest rates in over a decade. The MBA’s index tracking refinance applications fell for a fifth week in a row. On top of all the other declines over the past year and a half, the index currently sits at the lowest level since December 2000.
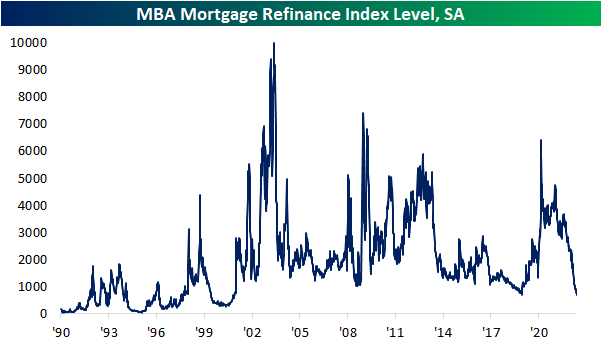
While refinancing activity has completely turned a corner from the historically impressive readings earlier in the pandemic, purchase applications are not as historically depressed, but the picture hasn’t been particularly promising. Falling another 7.1% week over week, today’s reading is one of the worst levels since the spring of 2020, and excluding those early days of the pandemic, it would be the worst reading since November 2016.

Taking a look at the non-seasonally adjusted number, claims have been running at a healthy level relative to the past decade, albeit below the pace of the past couple of years. Late spring is typically when applications set an annual peak as was the case this year (blue dots in first chart below). The high was now exactly one month ago which brings to question how the current decline from the seasonal high stacks up to prior years. As shown in the second chart below, the unadjusted number has fallen just short of 30% over the past four weeks which is one of the most rapid declines from a high of any year since at least 1990. The largest and last time with a comparable drop was in 2010 when it fell almost 40%. 1995, 1999, and 2001 are the only other years that have seen even larger declines from an annual peak than this year.


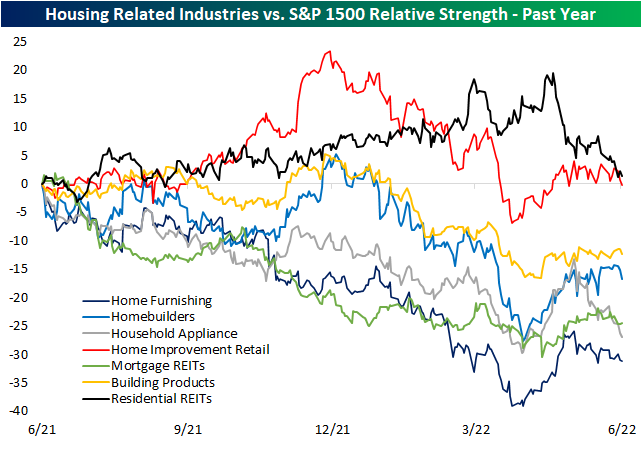
While the macro backdrop for housing continues to deteriorate, S&P 1500 stocks that are part of various housing-related industries have underperformed the broader market over the past year. Below we show the relative strength lines of a handful of these industries’ S&P 1500 indices versus the S&P 1500 since this time last year. Some groups like Mortgage REITs, Household Appliances, and Home Furnishing have been steady underperformers over the past year while there were others that had managed to hold out. For example, Residential REITs and home improvement stores were actually outperforming handily up until only a few months ago. Of course, the past few months have seen a complete unwind of that outperformance as they have now posted inline returns to the broader market. Click here to learn more about Bespoke’s premium stock market research service.
Bespoke’s Morning Lineup – 6/8/22 – A Yen for the Dollar
See what’s driving market performance around the world in today’s Morning Lineup. Bespoke’s Morning Lineup is the best way to start your trading day. Read it now by starting a two-week trial to Bespoke Premium. CLICK HERE to learn more and start your trial.
“You must always examine what’s working, evolve your ideas, and change the way you do things.” – Marc Benioff
Below is a snippet of content from today’s Morning Lineup for Bespoke Premium members. Start a two-week trial to Bespoke Premium now to access the full report.
Treasury yields and crude oil are moderately higher this morning and that has put pressure on equities which are just modestly lower. There’s not a lot of economic data to speak of, but weekly mortgage applications fell 6.5% to their lowest level, outside of the early COVID days, since 2016. There isn’t much in the way of a catalyst for this morning’s weakness on the equity side of things, but the fact that the OECD lowered economic growth forecasts for this year and next hasn’t helped.
In today’s Morning Lineup, we discuss the OECD’s downgrade of global growth forecasts (pg 4), central bank actions in emerging markets (pg 4), market activity in Asia and Europe (pg 4), and economic data out of Asia and Europe (pg 5).
The US Dollar is up over 1% versus the yen this morning as the one-way trade in that currency pair continues. Over the last year, the dollar has rallied more than 20% versus the yen, and since the start of the year, the gain has been more than 16%. From a longer-term perspective, the dollar’s rally puts it at the highest level versus the yen since February 2002, and if it rallies another half of one percent, it will be at the highest level since 1998. This rally spells trouble for Japanese consumers, but for manufacturers in the country, the weak yen is a welcome trend.

Start a two-week trial to Bespoke Premium to read today’s full Morning Lineup.
Solar ETF (TAN) Flares
Yesterday, the Biden administration announced plans for a new federal program to support solar panel manufacturing via removal of import tariffs. In response, solar stocks proxied by the Invesco Solar Energy ETF (TAN) ripped higher gaining 4.26% on the day. Although TAN actually saw an even larger 5.5% single-day gain just last Thursday, yesterday’s move does rank in the top decile of all daily moves on record for the ETF. Perhaps more importantly, that also marked the first time the ETF moved above its 200-DMA intraday since December. However, those gains did not hold as TAN moved a few cents back below its 200-DMA by the close, and today it continues to hover slightly below that moving average. We would also note those levels are smack dab in the middle of the past year’s range and are at similar levels to the low end of the second half of last year’s range. In other words, solar stocks may have gotten a boost from the news yesterday, but the technical picture is at a bit of a crossroads and not decisively positive.

As solar stocks struggle to decisively make a move above their 200-DMA, the First Trust Global Wind ETF (FAN) is only managing to move above its 50-DMA. Even though also a part of the clean energy space, wind-related clean energy stocks did not receive much of a bump from yesterday’s news as the group was only a modest 1% higher at the intraday highs compared to an over 7% gain for TAN at its highs. As FAN still needs to rally another 4.7% before joining solar stocks in testing its 200-DMA, the overall technical picture for FAN has been much less positive. The past year’s downtrend is more defined as the ETF has repeatedly failed to move back above its 200-DMA over the course of the past year with the most recent attempt being earlier this spring.

While solar shows a bit more promise than wind from a technical standpoint, overall the picture hasn’t changed much for clean energy as a whole. The largest clean energy ETF, the iShares Global Clean Energy ETF (ICLN), has likewise been stuck under its 200-DMA; having come up short yesterday following the rally off of the 52-week low last month and another failed attempt to move above its 200-DMA in April.

At the moment, clean energy stocks have failed in breaking out, but versus the broader market the move certainly stands out. In the chart below we show the relative strength line over the past five years for the Solar Energy ETF (TAN) versus the S&P 500 (SPY). Beginning in late 2018 that line was consistently on the rise followed by an enormous surge in the second half of 2020 through the end of the year. That steep rise in the line means this cohort of stocks experienced massive outperformance relative to the S&P 500. Of course, as fast as it went up, the line came crashing back to Earth in the first half of 2021 with further follow-through up until earlier this year. In late January, the relative strength line made its way back down to and successfully tested the longer-term and more gradual uptrend line off the late 2018 levels, and that continued to hold throughout the spring. In the past couple of weeks and especially after yesterday’s surge, the line has dramatically broken out of the past year and a half’s downtrend. Click here to learn more about Bespoke’s premium stock market research service.

Weakness in Retail
The broader retail space has been weak relative to the S&P 500 so far this year. Much of this weakness came after Target’s (TGT) and Walmart’s (WMT) earnings calls, in which management noted margin compression, inventory gluts in certain categories, shifting consumer preferences, and weakness in consumer spending as inflation in food and energy reduces discretionary budgets. Institutional subscribers can view our Conference Call Recaps on these two companies by clicking here. On a YTD basis, the VanEck Retail ETF (RTH) has underperformed the S&P 500 (SPY) by 4.5 percentage points, trading down by 18.2% as of today. A chart of the relative strength of RTH vs SPY over the last year is shown below.

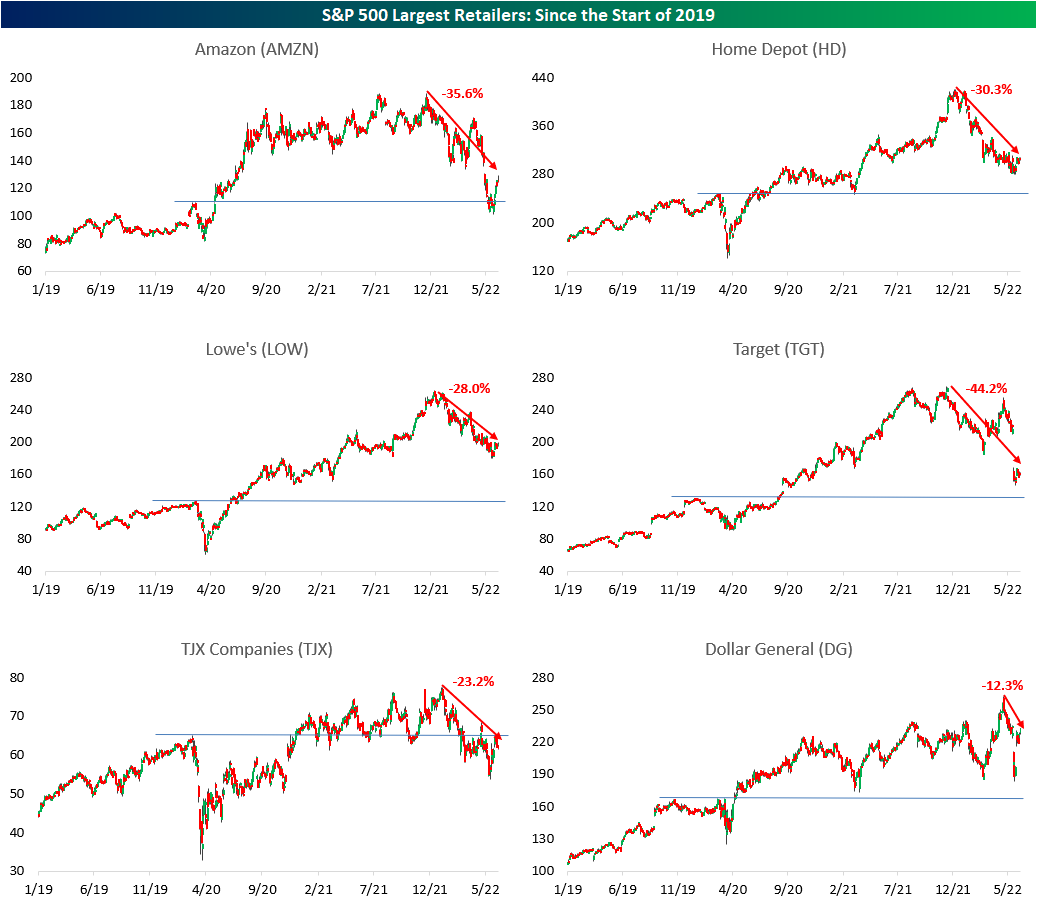
Within the S&P 500, there are 21 stocks that make up the Retailing industry, and in the table below, we have outlined the performance of the 10 largest stocks by market cap. You’ll notice that companies like Costco (COST) and WMT aren’t listed, but that’s because they are actually part of the Food and Staples Retailing industry. As you can see, seven of these ten stocks are down more than the average S&P 500 member on a YTD basis, and six are further from their respective 52-week highs than the average S&P 500 member. However, only two of these stocks are below their pre-COVID highs, whereas more than a third of (35.8%) of S&P 500 components are below their pre-COVID highs.

Below are charts of each of the 10 stocks listed above since the start of 2019. Included on each chart is the percentage that each is off its 52-week high. As you can see, AutoZone (AZO), Dollar Tree (DLTR) and Dollar General (DG) have held up relatively well amidst broader market weakness, likely due to their positioning on the value chain. The market seems to believe that consumers will move down the value chain amidst rising inflation, which makes our latest Little Known Stocks Report even more compelling. Click here to become a Bespoke premium member today!

Bespoke’s Morning Lineup – 6/7/22 – Off Target…Again
See what’s driving market performance around the world in today’s Morning Lineup. Bespoke’s Morning Lineup is the best way to start your trading day. Read it now by starting a two-week trial to Bespoke Premium. CLICK HERE to learn more and start your trial.
“The only thing you can be sure of is that there are times when large numbers of stocks are priced too high and other times when they’re priced too low.” – Benjamin Graham
Below is a snippet of content from today’s Morning Lineup for Bespoke Premium members. Start a two-week trial to Bespoke Premium now to access the full report.
Everything seems to be trading lower this morning. Futures were already lower overnight, but Target’s (TGT) second profit warning in less than three weeks has dragged them lower. TGT is trading down over 9%, which is even more than the 6% that Bitcoin is trading down following proposed legislation in the Senate to regulate cryptocurrencies. Although the two senators bringing forth the legislation both just noted in an interview that they could see bitcoin as a diversified part of investor retirement portfolios.
In today’s Morning Lineup, we discuss the latest proposed crypto legislation (pg 4), the larger than expected rate hike in Australia (pg 4), market activity in Asia and Europe (pg 4), TGT’s warning (pg 5), and economic data out of Europe (pg 5).
TGT has long been considered one of the most well-run retailers in the United States, so when a company of its caliber is forced to revise guidance less than three weeks after already significantly cutting guidance, you can only imagine how hard this environment has been for businesses across the economy. In its announcement this morning, TGT pointed to a ‘rapidly changing environment’, ‘external volatility’, and ‘unusually high transportation and fuel costs’ as reasons for lowering Q2 margin guidance from 5% down to 2%. On the bright side, the company said that the actions it was taking now should help improve long-term margins in the second half of the year and that demand remained generally strong. You can’t fault the company for taking proactive steps to address conditions, but there’s no guarantee that the environment is suddenly going to stop ‘rapidly changing’, or that external volatility will suddenly abate, and it certainly doesn’t seem like transportation and fuel costs are going to decline from their ‘unusually high’ levels.
With the stock indicated to gap down close to 10% this morning, TGT has now declined 46% from its high less than seven months ago. For a stock that had a market cap of more than $125 billion late last year, a decline of this magnitude is significant, to say the least. TGT remains just about 10% above its pre-COVID peak so we can’t yet add it to the list of stocks that have unwound all of their post-COVID gains, but it’s getting close.

Start a two-week trial to Bespoke Premium to read today’s full Morning Lineup.
Bespoke’s Morning Lineup – 6/6/22 – On the Rebound
See what’s driving market performance around the world in today’s Morning Lineup. Bespoke’s Morning Lineup is the best way to start your trading day. Read it now by starting a two-week trial to Bespoke Premium. CLICK HERE to learn more and start your trial.
“The eyes of the world are upon you. The hopes and prayers of liberty-loving people everywhere march with you.” Dwight D Eisenhower
Below is a snippet of content from today’s Morning Lineup for Bespoke Premium members. Start a two-week trial to Bespoke Premium now to access the full report.
It’s a bounceback Monday for the markets to kick off the week as news regarding China’s COVID restrictions and the country’s crackdown on the tech sector may be easing. Nasdaq futures are leading the charge higher, but the S&P 500 is also indicated to open up by over 1%. Oil is modestly higher, although off its earlier highs, Treasury yields are slightly higher, and crypto is sharply higher.
In today’s Morning Lineup, we discuss weekend developments in the Russia-Ukraine war (pg 4), the upcoming UK no-confidence vote (pg 4), and economic data out of China and the rally in that country’s tech sector (pg 5).
The week is starting off on a positive note for equities, but remember that today’s levels at the open still won’t be enough to erase last Friday’s declines. Additionally, all of the major averages are still trading below their 50 and 200-day moving averages, and they remain mired in pretty well-defined downtrends with a series of lower highs and lows. The only one of the three indices listed below that has broken its short-term downtrend is the Nasdaq 100, but it’s also seen the steepest declines. As we head into the new week, the Russell 2000 is down in six of the last seven weeks, and the Nasdaq 100 and S&P 500 are down in eight of the last nine weeks.

As far as individual sectors are concerned, it remains a case of Energy (XLE) and everybody else as the former is the only sector in overbought territory. The only other sectors even above their 50-DMAs at this point are Materials (XLB) and Utilities (XLU). If there’s any silver lining at this point, it’s that while most sectors remain below their 50-DMAs, only one (Consumer Staples, XLP) is actually at oversold levels.

Start a two-week trial to Bespoke Premium to read today’s full Morning Lineup.
Bespoke Brunch Reads: 6/5/22
Welcome to Bespoke Brunch Reads — a linkfest of the favorite things we read over the past week. The links are mostly market related, but there are some other interesting subjects covered as well. We hope you enjoy the food for thought as a supplement to the research we provide you during the week.
While you’re here, join Bespoke Premium with a 30-day free trial!
Real Estate
Big U.S. Cities Lost More Residents as Covid-19 Pandemic Stretched On by Paul Overberg and Janet Adamy (WSJ)
Among the ten largest cities in the country, only two (San Antonio and Phoenix) saw population grow last year, while cities with a resident population of less than 1mm but more than 500k saw aggregate declines as well. [Link; paywall]
The Hamptons summer rental market is facing an unexpected chill as inventory piles up and prices come down by Robert Frank (CNBC)
Travelers are moving further afield than the far end of Long Island and as a result demand for rentals in the Hamptons is crashing with summer demand falling well short of estimates. [Link]
States Help Business Owners Save Big on Federal Taxes With SALT-Cap Workarounds by Richard Rubin (WSJ)
Closely-held businesses are getting billions in tax benefits by skirting the SALT cap using a conversion that converts personal income taxes to business taxes. Regular wage earners are unable to enjoy the deduction. [Link; paywall]
Crypto
Crypto Goes Shopping for a Regulator It Can Push Around by Max Chafkin (Bloomberg)
The heaviest hitters in the crypto industry are pushing for regulation of the space to be taken on by the CFTC rather than the more aggressive and administratively powerful SEC. [Link; soft paywall]
Crypto Industry Sees Surge in Lawsuits as Investor Losses Pile Up by James Fanelli (WSJ)
Predictably, the near-inevitable cascade of losses emerging in the crypto industry are being litigated. Various flavors of fraud were being alleged even before the brutal fall in many crypto assets over the winter. [Link; paywall]
Financial Stability
‘Everything Is Terrible, but I’m Fine’ by Derek Thompson (The Atlantic)
Despite improving prospects thanks to higher checking account balances and incomes, Americans are feeling more dire about the national economy. Why? [Link]
The Racial Gap in Stock Market Participation (FRBSL On The Economy)
Across all income brackets, far fewer Black Americans hold investments in the stock market, with roughly one-third of the stock market participation of white households depending on income levels. [Link]
Missed Payments, Rising Interest Rates Put ‘Buy Now, Pay Later’ to the Test by AnnaMaria Andriotis (WSJ)
Wildly popular installment plans which allow consumers to purchase items immediately and pay for them over four or more later payments are proving more expensive for lenders than anticipated. [Link; paywall]
Streaming
Ted Sarandos Talks About That Stock Drop, Backing Dave Chappelle, and Hollywood Schadenfreude by Maureen Dowd (NYT)
A profile of Netflix CEO Ted Sarandos, featuring nautical musings, personal tragedy, layoffs, and Hollywood schadenfreude. [Link; soft paywall]
Fantasy Football
Mike Trout Would Rather Talk About the Angels by Tyler Kepner (NYT)
You know your fantasy football league is getting a little bit carried away when it leads to an on-field fight between two of its members. [Link; soft paywall]
Retro
The Wall Street Hotel Aims to Make 1700s-Era Finance Cool Again by Nikki Ekstein (BNN Bloomberg)
Lower Manhattan is being graced by a new place to stay: a new 180 room hotel located just across the street from the literal roots of the New York Stock Exchange. [Link]
Sanctions
U.S. Technology, a Longtime Tool for Russia, Becomes a Vulnerability by Ana Swanson, John Ismay, and Edward Wong (NYT)
The flow of critical inputs in to Russia via imports from a range of countries has slowed to a trickle, and that poses major challenges to Putin’s ability to make war in the Ukraine, let alone operate a modern economy at scale. [Link; soft paywall]
Read Bespoke’s most actionable market research by joining Bespoke Premium today! Get started here.
Have a great weekend!