Inflation Concerns Peak
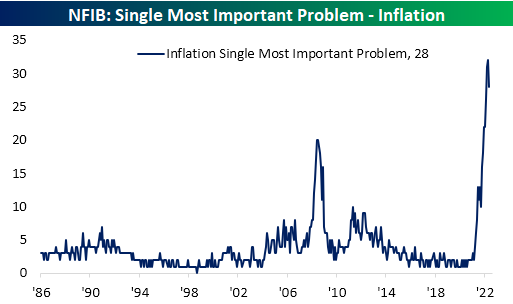
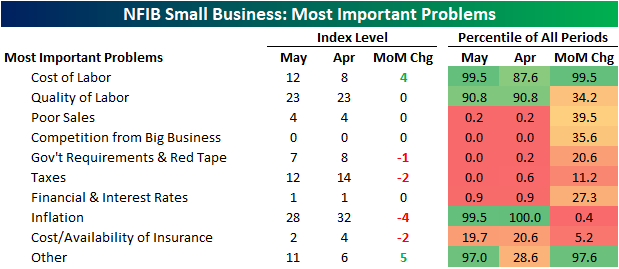
The NFIB released the results of its May survey of small businesses this morning, and even though the report showed the outlook for business conditions collapsed to a record low, there were other at least partially promising signs under the hood. Primarily, the percentage of respondents reporting inflation as their biggest concern finally appears to have peaked. After reaching a record high of almost a third of responses in April, a still-elevated but improved, 28% of small businesses reported inflation as their biggest concern. The decline in concerns over inflation ranked as the largest decline of any reported problem, but conversely, “other” saw the largest increase as it rose 5 percentage points month over month. Now at 11%, that reading is near some of the highest levels on record going back to 2008 (this response does not have as long dated of a history as the others which go back to 1986)
While the percentage of respondents reporting inflation as their biggest concern has peaked for the time being, that is not to say fewer businesses are concerned about rising costs. Behind the increase in “Other”, the next biggest month-over-month increase was cost of labor which rose four percentage points. That brings it to the highest level since December on its own as well as on a combined basis with quality of labor (which was unchanged month over month).

Inflation was not the only reading to fall month over month as fewer respondents also reported taxes as their biggest concern. Alongside another government-related reading, government requirements and red tape, the combined reading is at a record low.

Government-related indices were not alone with record low readings. 0% of respondents indicated that competition from big businesses was their most pressing issue as well while poor sales and financials & interest rates are just off record lows of their own. Click here to learn more about Bespoke’s premium stock market research service.
Bespoke’s Morning Lineup – 6/14/22 – One Way Market
See what’s driving market performance around the world in today’s Morning Lineup. Bespoke’s Morning Lineup is the best way to start your trading day. Read it now by starting a two-week trial to Bespoke Premium. CLICK HERE to learn more and start your trial.
“He says we’re going the wrong way.”
“Oh, he’s drunk. How would he know where we’re going.” – Planes, Trains & Automobiles

Below is a snippet of content from today’s Morning Lineup for Bespoke Premium members. Start a two-week trial to Bespoke Premium now to access the full report.
After four days of basically getting their faces beat inside out, bulls are trying to make a comeback this morning aided in part by a PPI report that wasn’t stronger than expected. Small business sentiment also managed to come in slightly better than expected, although it remains weak. One item covered in today’s Morning Lineup commentary is the fact that inflation expectations in the latest ZEW survey didn’t show a pickup in inflation expectations for the US or Eurozone.
In today’s Morning Lineup, there’s a lot covered as we discuss trading in APAC and European markets (pg 4), whether or not the Fed will go 50 or 75 bps tomorrow (pg 5), overnight economic data in Asia and Europe (pg 6), and much more.
Over the last two years or so, the market has come full circle. In February and March of 2020, there was that five-week period where the only direction the market would move was lower. Shortly after, the Federal Government and Federal Reserve unleashed massive amounts of stimulus, and the market started to turn around. By early 2021, the market had completed a complete 180, and the only direction it could move was higher. Then, late last year as government stimulus started to dry up and the Federal Reserve started to get religion on inflation, cracks in the market started to emerge. By early this year, we were calling it a one-step forward and two-step backward market where every positive day was offset by at least two bad days taking the market to progressively lower levels in the process.
As painful as the one-step forward and two-step backward market felt, at least there were some positive days. Over the last few days, it has become a one-directional market, and the direction has been extreme in the wrong way. Over the last four trading days, the net advance/decline (A/D) reading for the S&P 500 has been negative 400 or lower meaning that in each of the last four trading days there have been 400 more stocks that traded lower on the day than higher. To give you some perspective on how extreme this type of streak is, since 1990, there have been ten years where for the entire 12 months there weren’t even four days where the net A/D reading for the S&P 500 was at negative 400 or lower. As shown in the chart below, there has never been a streak of similar duration, and the only time there were even three consecutive days of -400 readings was in August 2015 at the height of concerns over the Chinese yuan devaluation.

Start a two-week trial to Bespoke Premium to read today’s full Morning Lineup.
S&P 500 Yields vs 10-Year
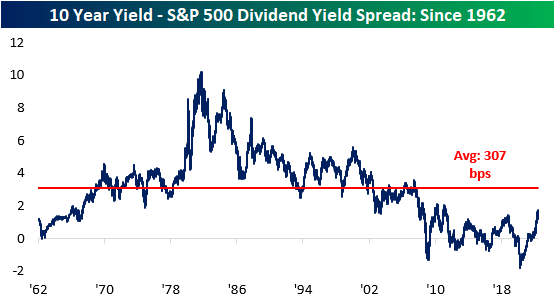
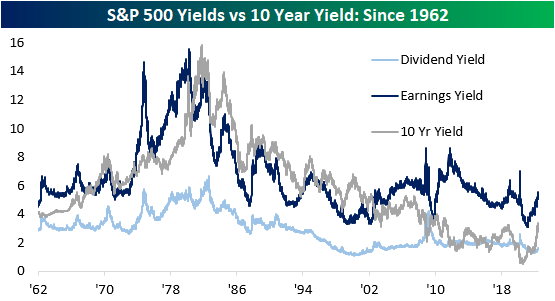
In recent years, one of the major arguments made for equity market bulls was the fact that there was no alternative (TINA). TINA was a tough strategy to argue against as fixed income markets were offering incredibly low, if anything in the way of yields, especially relative to inflation expectations. However, the Fed’s hawkish pivot has caused yields to tick significantly higher, reaching the highest level in about a decade in early June. This certainly changes the investment landscape, as alternatives to equities become more attractive and the discount rate used to revert future corporate cash flows to present-day dollars increases.
The 10-year Treasury note is now offering investors a yield of 3.4%, which is more than 2 times higher than the level at the start of the year. Notably, the current 10-year yield of 3.4% is 172 basis points higher than the dividend yield of the S&P 500 (which is 1.6%). This widening spread decreases the attractiveness of equities and increases the appeal of fixed income assets, which can lead to further downside in the S&P 500. Although the spread has moved significantly higher as of late, it is still compressed relative to historical averages, meaning that yields could still rise further and the spread between long-term Treasuries and the S&P 500’s dividend yield would be narrower than the long-term average.
Another metric worth tracking is the earnings yield of the S&P 500 versus the 10-year yield. The earnings yield (the inverse of the P/E ratio) is currently 218 basis points higher than the 10-year yield. If this spread were to turn negative, it would imply that risk-free assets would be generating superior earnings than riskier equities. Nonetheless, the S&P 500 earnings yield is still well above that of the 10-year yield, so equities do still appear attractive on an absolute basis, implying that investors are still being compensated for the excess risk taken by investing in public equities. Throughout history, there have been periods where the earnings yield was less than the 10-year yield for extended periods of time, and while this would seem counter-intuitive, unlike fixed income, where capital appreciation is capped, capital appreciation for equities is theoretically unlimited.
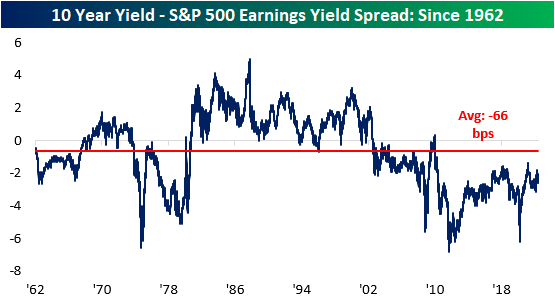
The chart below aggregates the S&P 500 earnings yield, dividend yield, and the 10-year treasury yield. As you can see, the earnings yield has been higher than the treasury yield since 2002. The tightening of this spread decreases the attractiveness of equities relative to 10-year Treasuries, which we have seen occur over the last several months. Click here to become a Bespoke premium member today!
Biggest Decliners Since 6/7
There’s been no hiding from pain in equity markets since last Tuesday (June 7th). As mentioned in our Morning Lineup today, the S&P 500 is on pace to decline by 1%+ on four consecutive days, and if we hold onto these levels through the close, the index will have dropped over 2% for three consecutive days. This period of weakness comes on the back of another hotter than expected CPI print, continued disruption from the war in Ukraine, and a 10-year yield healthily above 3%. As of midday, the Russell 3000 was down 9.5% since the close on 6/7 and 22% YTD.
As is the case for every pullback, long-term investors should look for beaten-down names with solid growth runways. The first step of this process is to recognize which names have pulled back the most and then begin looking for diamonds in the rough. The table below shows the 18 Russell 3000 members who are down more than 25% since 6/7 with a market cap of at least $1 billion. For the entire Russell 3000, the average stock in the index is down 24.4% YTD (median: -24.3%) and 10.44% since 6/7 (median: -9.86%). Narrowing that field down to stocks with market caps of at least $1 billion, the average stock is down 17.4% on a YTD basis (median: -20.5%) and has traded down by 10.3% since 6/7 (median: -9.8%).
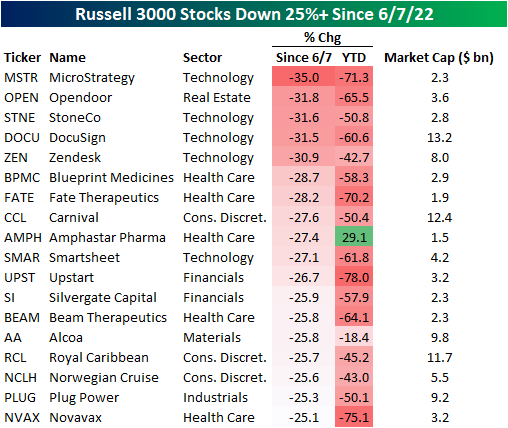
The exposures of these 18 stocks are quite mixed, as the list includes both pandemic darlings (i.e. Opendoor- OPEN, DocuSign- DOCU) and some of the biggest pandemic era decliners (i.e. Carnival- CCL) and Royal Caribbean-RCL). On a median basis, these stocks trade 4.5 times sales and are expected to see revenue increase by 38.6% over the next twelve months. Of these 18 names, Beam Therapeutics (BEAM) is expected to see the largest sales decline (-38.7%) and Norwegian Cruise (NCLH) is expected to see the largest increase (449.8%). Relative to sales, BEAM is the most expensive at 37.4 times LTM sales and OPEN is the cheapest at 0.3X.
Individual stock performance since 6/7 does appears little correlated to YTD performance. As shown, only 8.1% of the variation in the percent change since 6/7 can be explained by YTD performance. Click here to become a Bespoke premium member today!

Bespoke’s Morning Lineup – 6/13/22 – More Monday Weakness
See what’s driving market performance around the world in today’s Morning Lineup. Bespoke’s Morning Lineup is the best way to start your trading day. Read it now by starting a two-week trial to Bespoke Premium. CLICK HERE to learn more and start your trial.
“Come what may, all bad fortune is to be conquered by endurance.” – Virgil
Below is a snippet of content from today’s Morning Lineup for Bespoke Premium members. Start a two-week trial to Bespoke Premium now to access the full report.
It’s not a pretty picture for risk assets of any kind this morning as equity indices around the world are down over 2%, US futures are down by about the same amount, treasuries are selling off hard, and crypto prices are down sharply. Concerns over inflation and its impact on economic growth have become heightened over the last several days, and unlike prior periods in recent history where growth has come into question, with inflation pressures as strong as they are, there is little optimism that the Fed can help to cushion the blow.
In today’s Morning Lineup, there’s a lot covered this morning as we discuss prior streaks of 1%+ and 2%+ declines for the market (pg 4), the plunge in crypto prices (pg 5), overnight movements in the yen (pg 6), action in Asian and European markets (pg 6), overnight economic data in Asia and Europe (pg 7), and much more.
The first trading day of the week has already been weak for the market, but today’s 2%+ downside gap in SPY will be, by far, the largest downside gap to start a week of the year and the largest since March 2020.

Start a two-week trial to Bespoke Premium to read today’s full Morning Lineup.
Bespoke Brunch Reads: 6/12/22
Welcome to Bespoke Brunch Reads — a linkfest of the favorite things we read over the past week. The links are mostly market related, but there are some other interesting subjects covered as well. We hope you enjoy the food for thought as a supplement to the research we provide you during the week.
While you’re here, join Bespoke Premium with a 30-day free trial!
Work
Microsoft says it will not enforce non-compete clauses in U.S. employee agreements by Akash Sriram (Reuters)
Microsoft will do away with noncompete clauses in the contracts of all but the most senior executives in the wake of research showing that noncompetes serve to suppress employee pay. The software giant also signaled it would “not resist” unionization efforts by employees. [Link]
A Full Return to the Office? Does ‘Never’ Work for You? by Emma Goldberg (NYT)
After spending two years taking care of all their responsibilities without leaving their homes, white-collar workers are calling management’s bluff when it comes to full-time returns to the office. [Link; soft paywall]
Who Killed the Phillips Curve? A Murder Mystery by David Ratner and Jae Sim (FEDS Notes)
The authors argue that labor market policies rather than aggressive monetary policy defenses of inflation targets have led to a disconnect between the unemployment rate and inflation. [Link; 36 page PDF]
Texas Tea
The world must brace itself for a further surge in oil prices by David Sheppard (FT)
Oil is continuing to rip as price forecasts soar amidst solid demand and no hope of any relief for the tight supply of crude around the world. [Link; paywall]
The Option To Write Options – A Suggestion For SPR Rulemaking by Skanda Amarnath, Arnab Datta, and Alex Williams (Employ America)
A change in Department of Energy administrative rules offers the opportunity to intervene more intensively in the oil market in order to make sure producers have confidence in a long-term floor for prices that will incentivize capex. [Link]
Violence
Rural America Reels From Violent Crime. ‘People Lost Their Ever-Lovin’ Minds.’ By Dan Frosch, Kris Maher, and Zusha Elinson (WSJ)
While cities have gotten most of the attention for recent increases in violent crime off of record lows, murders and other forms of violent crime are also soaring in rural areas across the country, suggesting common narratives for the causes that are unique to cities are likely misplaced. [Link; paywall]
Rent
Manhattan landlords are rejecting single tenants who don’t make over 160k by Tiffany Ap (Quartz)
A one bedroom apartment in Manhattan carries a median asking rent of $4k per month, meaning that with the standard margin of safety for landlords nobody making under $160k per year can rent the median apartment on the market in the city. [Link]
Tech
How AI Could Help Predict—and Avoid—Sports Injuries, Boost Performance by Eric Niiler (WSJ)
Very precise measurements of individual players’ joints are nearing the level of accuracy that could allow real-time prevention and prophylaxis against serious player injury. [Link; paywall]
Ukraine
Low, Fast And Dangerous: A Firsthand Account Of Ukraine’s Secret Helicopter Rescue Missions by Howard Altman (The Warzone)
An incredible oral history of helicopter flights that served to resupply and evacuate Ukrainian troops pinned down for a month at Mariupol’s giant Azovstal steel plant. [Link]
Demographics
Could China’s population start falling? by Xiujian Peng (BBC)
Years of suppressing birth rates in China has taken birth rates from 2.6 35 years ago to a 1.15 in 2021, lower than the US or Japan and so weak that the Chinese population will almost certainly start shrinking over the next year or so. [Link]
Investing
Highflying Tiger Global Humbled by Unraveling of Giant Tech Bet by Eliot Brown and Juliet Chung (WSJ)
One of the biggest winners of the post-global financial crisis boom in the technology industry was the monster Tiger Global complex. In 2022, though, the massive hedge fund is struggling with a legendary string of losses. [Link; paywall]
Read Bespoke’s most actionable market research by joining Bespoke Premium today! Get started here.
Have a great weekend!
The Bespoke Report – 6/10/22 – CP-Oh My…
This week’s Bespoke Report newsletter is now available for members.
Every week, we show numerous charts to illustrate key trends in the market and economy in order to try and make sense of whatever is going on in the market. These days, though, only one chart matters—prices at the pump. Heading into this weekend, the national average price of a gallon of gas approached $5, a level it will almost certainly breach over the weekend. Not only are prices at a record high, but the pace of increase has been unprecedented. Since the COVID lows, the national average price has nearly tripled. Since the start of 2021, prices are up 122%, and this year prices are up 52% in less than six months. For just about every issue facing the market these days, gas prices are in some way related to it.
We jus published this week’s report which covers the meteoric rise in gas prices, inflation, and all the other issues weighing on markets.

To read this week’s full Bespoke Report newsletter and access everything else Bespoke’s research platform has to offer, start a two-week trial to one of our three membership levels.


Bespoke’s Morning Lineup – 6/10/22 – This is What It’s Come To
See what’s driving market performance around the world in today’s Morning Lineup. Bespoke’s Morning Lineup is the best way to start your trading day. Read it now by starting a two-week trial to Bespoke Premium. CLICK HERE to learn more and start your trial.
“Inflation is when you pay fifteen dollars for the ten-dollar haircut you used to get for five dollars when you had hair.” – Sam Ewing
Below is a snippet of content from today’s Morning Lineup for Bespoke Premium members. Start a two-week trial to Bespoke Premium now to access the full report.
For many investors, today’s CPI report for May has been the most anticipated event of the week, so we hope now that the day is here that these individuals have a hobby that they can fall back on once 8:30 comes and goes. Futures are on either side of the unchanged line heading into the report, so much of today’s performance will hinge on how the report comes in relative to expectations and then what the numbers imply for next Wednesday’s FOMC decision.
In today’s Morning Lineup, we discuss market reaction to yesterday’s ECB decision (pg 4), market activity in Asia and Europe (pg 4), and economic data out of China and Europe (pg 5).
After hovering all morning and in the early afternoon just below the unchanged level, investors rushed for the exits in the last hours of trading yesterday pushing the S&P 500 down over 2%. Most of those declines came in the last hour of trading as the S&P 500 fell 1.25%, finishing right near the low of the day.

Yesterday’s last hour decline was the sixth last hour decline of more than 1% already this year and the largest last hour decline since January. Since the start of 2020, there have now been a total of 19 last-hour declines of 1%+. While there were numerous occurrences in the early days of COVID, there was a full one-year stretch from late November 2020 through November 2021 with no such occurrences. While a sharp sell-off in the last hour of trading brings up fears of “what does the market know that I don’t”, the reality is that next day performance shows no clear-cut trends. Of the 18 prior occurrences since the start of 2020, the S&P 500’s median one-day performance has been a gain of 0.28% with positive returns 55% of the time.

Start a two-week trial to Bespoke Premium to read today’s full Morning Lineup.
The Bespoke 50 Growth Stocks – 6/9/22
The “Bespoke 50” is a basket of noteworthy growth stocks in the Russell 3,000. To make the list, a stock must have strong earnings growth prospects along with an attractive price chart based on Bespoke’s analysis. The Bespoke 50 is updated weekly on Thursday unless otherwise noted. There were 14 changes to the list this week.
The Bespoke 50 is available with a Bespoke Premium subscription or a Bespoke Institutional subscription. You can learn more about our subscription offerings at our Membership Options page, or simply start a two-week trial at our sign-up page.

The Bespoke 50 performance chart shown does not represent actual investment results. The Bespoke 50 is updated weekly on Thursday. Performance is based on equally weighting each of the 50 stocks (2% each) and is calculated using each stock’s opening price as of Friday morning each week. Entry prices and exit prices used for stocks that are added or removed from the Bespoke 50 are based on Friday’s opening price. Any potential commissions, brokerage fees, or dividends are not included in the Bespoke 50 performance calculation, but the performance shown is net of a hypothetical annual advisory fee of 0.85%. Performance tracking for the Bespoke 50 and the Russell 3,000 total return index begins on March 5th, 2012 when the Bespoke 50 was first published. Past performance is not a guarantee of future results. The Bespoke 50 is meant to be an idea generator for investors and not a recommendation to buy or sell any specific securities. It is not personalized advice because it in no way takes into account an investor’s individual needs. As always, investors should conduct their own research when buying or selling individual securities. Click here to read our full disclosure on hypothetical performance tracking. Bespoke representatives or wealth management clients may have positions in securities discussed or mentioned in its published content.
Run For Cover: CPI On Deck
Tomorrow is the day everybody has been waiting for as CPI for the month of May will hit the tape at 8:30 AM eastern. The fact that people have literally been talking about this report for the last several days illustrates how much of an issue inflation has become for the market over the last six months since Fed Chair Powell first started to take a more hawkish approach to inflation. For a market concerned about inflation, recent reports certainly haven’t been soothing for investors. Over the last 24 months, there have been just three months where headline CPI has come in weaker than expected (6/10/20, 11/12/20, and 9/14/21). Ironically enough, on each of those three days, the S&P 500 actually traded lower, although to be fair, all three of these reports were before Powell ditched the term transitory.

Although CPI reports over the last two years have been coming in either higher or in line with expectations, market performance on these days has been right around the flatline with a median decline of 0.08% for the S&P 500 with positive returns 11 out of 24 times.

While median returns for the S&P 500 have been right around the flatline over the last two years on CPI days, more recent returns have been much weaker. Since Powell ditched ‘transitory’ in late November, the S&P 500 has declined on the day of the CPI report four times (the last four reports). Over the last six months, the S&P 500’s median performance on CPI days has been a decline of 0.18%. On an individual sector basis, Energy (surprise!) has been the best performing sector with a median gain of 1.1%, while Technology’s median performance has been of the same magnitude but in the opposite direction. Along with Technology, Financials and Communication Services have both faced declines of 0.8%. Click here to learn more about Bespoke’s premium stock market research service.
