Stocks with the Largest Price to Sales (P/S) Declines
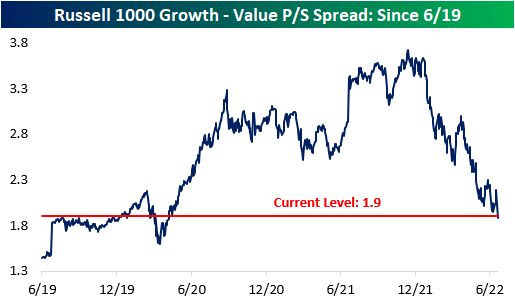
It’s no secret that there has been a massive pullback in valuation multiples, and stocks that had higher multiples have been hit much harder by the recent market pullback. This comes as rate hikes increase the discount rate and the era of “free money” comes to an end, which inherently lowers the risk appetite of investors. The chart below shows the price to sales (P/S) spread between the Russell 1000 growth index and the Russell 1000 value index. Naturally, growth stocks should always trade at higher multiples, but the spread became magnified throughout the pandemic. The spread peaked in mid-November 2021 at 3.7, but it has contracted by 1.8 points to 1.9 as of today’s open. Whereas the growth index has seen its P/S ratio decline by 36.4%, the value index has only seen a P/S decline of 13.0%. The growth index currently has a P/S ratio of 3.6, compared to 1.7 for the value index. The P/S spread between the two indices is now inline with pre-COVID levels, so the stretched growth multiples of the pandemic-era have come full circle. Click here to learn more about Bespoke’s premium stock market research service.
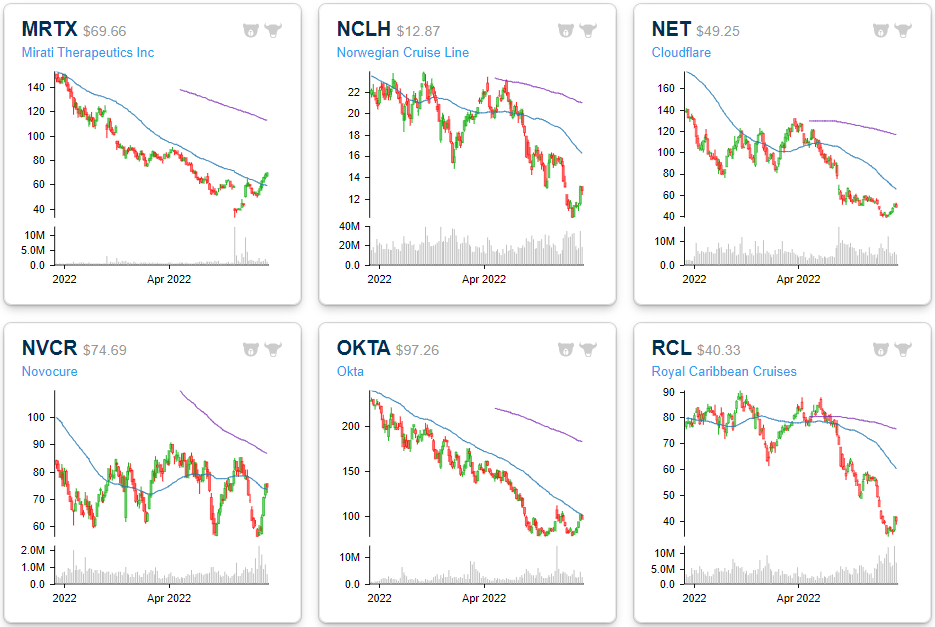
Dissecting this further, we took a look at the 20 Russell 1000 stocks that have seen their P/S multiples compress the most since their respective 52-week highs. Leading this group is Lucid (LCID), which has seen the P/S ratio decline by a whopping 275,309 points. This comes as sales increased substantially and the price declined significantly (-68.2% since the 52-week high). Even still, LCID’s P/S ratio remains in the stratosphere at 359. Next on this list is Norwegian Cruise (NCLH) and Carnival (CCL), which have experienced a similar phenomenon. Sales fell off a cliff for the cruise lines following COVID, causing their P/S ratios to spike. As sales have returned on the re-opening and share prices have continued to decline, P/S ratios have fallen significantly. The largest decliners in share price since their respective 52-week highs on this list are Upstart (UPST), DocuSign (DOCU) and Unity Software (U), which have declined by 90.4%, 79.0% and 78.9%, respectively. Upstart has seen its P/S ratio fall from 37.8 down to 3.0. The median stock on this list trades 10.8 times LTM sales, which is still aggressive to say the least. Most stocks topped out either last summer or in October/November.

The six month price charts below are available using our Chart Scanner tool. You can click here to view a custom portfolio of these twenty stocks if you’re already a subscriber. As you can see, the vast majority are in sustained downtrends. However, if interest rate pressures subside and risk appetites increase, these twenty names could benefit through multiple expansion. Click here to learn more about Bespoke’s premium stock market research service.


Bespoke’s Morning Lineup – 6/28/22 – Stocks, Oil, and Yields All Higher
See what’s driving market performance around the world in today’s Morning Lineup. Bespoke’s Morning Lineup is the best way to start your trading day. Read it now by starting a two-week trial to Bespoke Premium. CLICK HERE to learn more and start your trial.
“When the final result is expected to be a compromise, it is often prudent to start from an extreme position.” – John Maynard Keynes

Below is a snippet of content from today’s Morning Lineup for Bespoke Premium members. Start a two-week trial to Bespoke Premium now to access the full report.
Just like yesterday, futures are higher this morning but off their highs from earlier this morning. Surprisingly, the rally has been accompanied by rising oil prices and higher treasury yields, but news that China has cut the required quarantine time for incoming travelers in half has investors optimistic that the country may further loosen its zero-COVID policy. Hopefully the outcome today is better than yesterday.
In economic news, Wholesale Inventories rose 2.0% which was below consensus forecasts but the level still remain elevated relative to history with May being the fourth straight month of 2% readings or higher.
In today’s Morning Lineup, we discuss the news coming out of the G7 meetings, overnight moves in Asian and European markets, and a look at polling numbers ahead of the mid-term elections.
Despite strength this morning, commodities have succumbed to profit-taking recently, and the majority of the ETFs tied to the sector have seen declines over the last week. Leading the way to the downside, Natural Gas (UNG) and the DB Agriculture Fund (DBA) have seen declines of over 5% in just the last week putting them into oversold levels. While the weakness in commodities has been a welcome development and sparked optimism that inflation pressures may finally be starting to roll over, the majority of these same ETFs are still up sharply YTD. UNG is up over 77% YTD even after the 6.6% decline in the last week, while the Commodity Total Return ETN (DJP) still sits on a gain of over 25%. In order for investors to really be confident that commodity price pressures have really turned the corner, we’ll need to see the weakness that has characterized the end of the quarter follow through into the second half.

Start a two-week trial to Bespoke Premium to read today’s full Morning Lineup.
Bespoke’s Paul Hickey on Fox Business
Bespoke co-founder Paul Hickey appeared on Making Money with Charles Payne this afternoon to discuss Fed policy, investor sentiment, the mega-caps, and homebuilders. You can view the segment here or by clicking the image below. Learn more about Bespoke’s membership options if you’re new to the site!

Stocks on 7+ Month Losing Streaks
The US stock market has been weak and in a downtrend since late 2021, and there are some individual names that haven’t been able to post a positive month in quite some time. Of all S&P 1500 members, there are actually eight stocks with a market cap of at least $2 billion that are on a monthly losing streak of seven or more months. Six of these eight names are members of the Consumer Discretionary sector (the worst performing sector on a YTD basis), which is down 27.8% in 2022 (as of Friday’s close). The largest company on this list is Nike (NKE), which reports after the close today. The stock would need to gain about 7.5% through the end of the month to break its seven month losing streak. The average stock on this list would need to gain 6.7% through the close on 6/31 to break their respective streaks. Etsy (ETSY) is the closest to breaking its streak, needing to gain just 0.9%, while Under Armour (UAA) is the furthest, needing 13.7%. On a YTD basis, these stocks are down an average of 41.4% (median: -35.0%), meaning they would need to gain ~70% through year’s end to finish 2022 in the green.

Below is a quick look at one-year price charts for these eight stocks. (You can click here to create a custom portfolio of these names if you’re a Bespoke client.) Unsurprisingly, these stocks on 7+ month losing streaks are trading in pretty steep long-term downtrends, and they’ve got a lot of work to do to get back to where they were trading late last year. New uptrends can’t emerge until these long monthly losing streaks finally come to an end. Click here to learn more about Bespoke’s premium stock market research service.

Demand Destroyed in Dallas
Economists were not anticipating a particularly strong Dallas Fed Manufacturing Activity reading as forecasts were calling for it to remain in contractionary territory at -6.5 (though that would have been an improvement versus last month’s -7.3 reading). Instead of the modest improvement that was expected, the index plummeted further hitting a new cycle low of -17.7. The region’s manufacturing economy experienced the largest decline in activity since the spring of 2020. Before that, 2016 was the last time this index was this low.
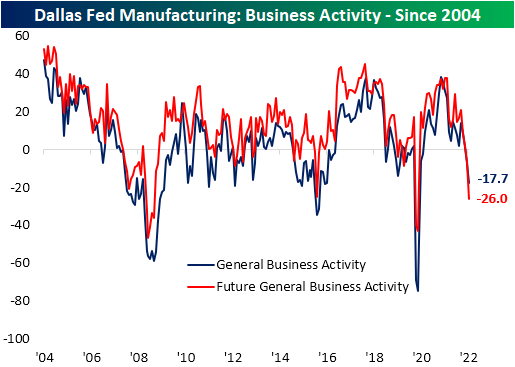
Looking across the categories of the report, there was little to like. Demand took a big hit with production slowing down in tow. Meanwhile, supply chains appeared to face increased stress contrary to other readings on that space over the past few months. Expectations painted a significantly soured outlook with several near record month-over-month declines as the indices reached low single digit percentile readings.

As mentioned above, Texas area manufacturers appeared to have reported a significant slowdown in demand as the index for New Orders dropped double digits and into the first contractionary reading since May 2020. Dropping hand in hand was the New Orders Growth Rate and Unfilled Orders. For the latter, the decline in expectations actually surpassed the spring of 2020 low and is now only one point above the December 2008 record low. Shipments was the only one of these indices to narrowly remain in expansion in June.

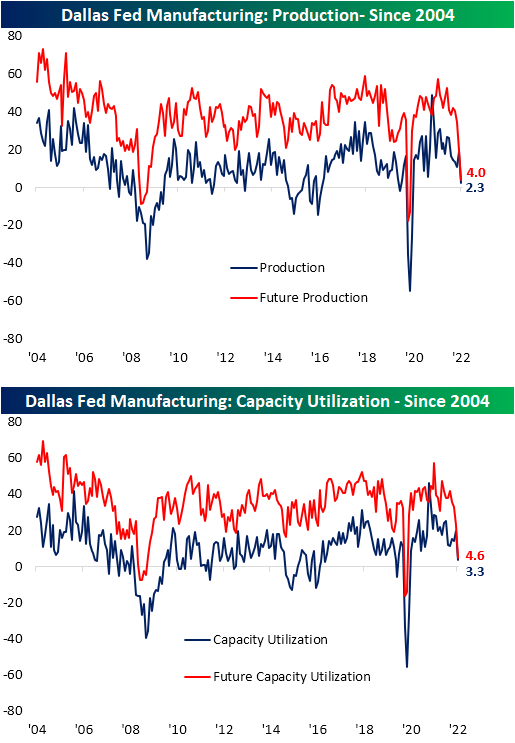
Manufacturers have quickly responded to that demand destruction by cutting back on production and capacity utilization. Expectations have seen even larger declines, although each of these indices, for the time being, remain at expansionary rather than contractionary levels.
High prices and long lead times have been thorns in the side of businesses throughout much of the pandemic, and for better or for worse, that trend appears to be turning around. Both Prices Paid and Received pulled back across expectations and current conditions in June. Both indices have now erased most of the moves higher since Q1 of last year.
Supply chain indices had a bit more puzzling and inconsistent of a print. After massive improvements last month that was echoed throughout several other data points external to this report, current conditions for Delivery Times returned right back up to where they were earlier this year. In fact, the 15.6 point month over month surge was the second largest on record behind the 21 point jump in March of last year. However, the expectations index lends some evidence that it may be a one-off increase. Expectations cratered with the largest one month decline on record. Not only was the move massive, but at -17.7, it is the lowest reading since March 2009. Inventories saw a similar move with current conditions indicating a large build in inventories as expectations called for a substantial decline further down the road. Given the weaker readings on New Order Expectations, that decline in Inventory Expectations is likely more of a function of expected improvements in supply chains.

Apart from the large declines across expectations indices, another indication of increased pessimism could also be found in the Outlook Uncertainty index. This is a more recent series included with the report dating back to only the start of 2018. As shown below, after spiking during the first half of 2020, it normalized up until last summer when it began to rise again, albeit more gradually. This month saw the index breakout in a big way as it experienced the second largest month-over-month increase on record behind March 2020. Click here to learn more about Bespoke’s premium stock market research service.

Cryptos Reach Historic Oversold Streak
Cryptos have started off the new week with more declines as Bitcoin is down over 2.5% today and Ethereum has fallen nearly a full percentage point more. For both, those moves drive them deeper into oversold territory, which as we discussed in last Friday’s Crypto Report, is already an extended streak of oversold readings. For Bitcoin, today marks the 17th straight day trading at least one standard deviation below its 50-DMA. While it stands out from all oversold streaks going back to 2014, it is not the longest streak on record or even in recent months. In fact, before a brief stint within neutral territory, Bitcoin traded over one standard deviation below its 50-day for 25 straight days ending May 29th of this year and that followed another 32 day long streak that ended in February.
Although its history is not as long as Bitcoin, Ethereum has been trading in oversold territory for an even more impressive length of time. Today is the 54th oversold day which has far surpassed the previous record of 38 days. To add injury to insult, the prior record streak occurred earlier this year as Ethereum is now trading at a third of the price it was trading at to start the year. Click here to learn more about Bespoke’s premium stock market research service.

The Bespoke Emerging Market 50 – 6/27/22
The Bespoke Emerging Market 50 tracks emerging market equities that have either strong earnings growth, the potential to recover substantially in the foreseeable future, or unique upside based on the current geopolitical environment. As the name implies, all of these companies are domiciled in emerging market economies (with ADRs). In this report, we highlight risks and opportunities in emerging markets before diving into the differences between our basket and the iShares MSCI Emerging Markets ETF (EEM). The back half of the report involves a brief summary of each of the 50 stocks in the basket, including fundamental insights, growth opportunities, and risks. The Bespoke Emerging Market 50 is updated on a quarterly basis.

The Bespoke Emerging Market 50 is available at the Bespoke Premium level and higher. You can sign up for Bespoke Premium now and receive a 14-day trial to read our Emerging Market 50 report. To sign up, choose either the monthly or annual checkout link below:
Bespoke’s Morning Lineup – 6/27/22 – Two Minute Warning
See what’s driving market performance around the world in today’s Morning Lineup. Bespoke’s Morning Lineup is the best way to start your trading day. Read it now by starting a two-week trial to Bespoke Premium. CLICK HERE to learn more and start your trial.
“In times of rapid change, experience could be your worst enemy.” – J. Paul Getty
Below is a snippet of content from today’s Morning Lineup for Bespoke Premium members. Start a two-week trial to Bespoke Premium now to access the full report.
Bulls finally caught a break last week with the S&P 500 up well over 5%, and they’ll be looking to finish up the quarter on a positive note as we head into the end of the first half. The bears are still comfortably in the lead heading into the half, but a late ‘field goal’ or even ‘touchdown’ for the bulls in the final days would make things look a little more respectable to kick off the second half. Futures are higher this morning but have been drifting as the opening bell approaches and treasury yields rise as the 10-year trades back near 3.2%. Investors continue to be tossed around by moves in the treasury market as market rallies tend to push yields higher and eventually to levels that cause angst on the part of equity investors.
Durable Goods orders were just released and came in higher than expected, while later on, we’ll get updates to Pending Home Sales (10:00 AM Eastern) and the Dallas Fed report for June (10.:30). On the earnings front, we’ll hear from Jefferies (JEF) and Nike (NKE) after the close.
In today’s Morning Lineup, we discuss the news coming out of the G7 meetings, overnight moves in Asian and European markets, US rig counts, and overnight economic data from Asia and Europe.
With gains of over 6%, last week was a very good one for US equities. Good, that is for every sector except Energy. Sectors leading the rally included Consumer Discretionary, Health Care, and Real Estate, but Technology and Utilities also outperformed. Despite the big gains last week, all five sectors are still in the red YTD, and only Health Care is above its 50-day moving average (DMA). Ironically enough, Energy was the only sector down on the week and is the furthest below its 50-DMA, but it is also the only sector up YTD and with a gain of over 30% it’s leaving the other ten sectors in its dust.

Speaking of the Energy sector, while it has easily been the best performing sector over the last year, the last week of the month has been routinely weak for the Energy sector. As shown in the chart below, over the last year, the sector has underperformed the S&P 500 in the last week of the month ten out of twelve times with a median margin of 2.5 percentage points in underperformance. Energy has been a high octane sector lately, but it hasn’t had much in the way of endurance on a month-to-month basis.

Start a two-week trial to Bespoke Premium to read today’s full Morning Lineup.
Bespoke Brunch Reads: 6/26/22
Welcome to Bespoke Brunch Reads — a linkfest of the favorite things we read over the past week. The links are mostly market related, but there are some other interesting subjects covered as well. We hope you enjoy the food for thought as a supplement to the research we provide you during the week.
While you’re here, join Bespoke Premium with a 30-day free trial!
Cancer & Carcinogens
A turning point in cancer by Eric Topol (Substack)
Scientists have released an unprecedented series of breakthroughs related to cancer treatment, covering a wide range of therapies and types of cancer which could have huge impacts on overall mortality and quality of life. [Link]
FDA to Order Juul E-Cigarettes Off U.S. Market by Jennifer Maloney (WSJ)
E-cigarette leader Juul has been ordered off the US market after a two year review of data as part of an authorization process. Juul limited marketing and its flavor range in 2019, but its history of targeting teens will reportedly keep it off the market. [Link; paywall]
Supply Side
How Much Do Supply and Demand Drive Inflation? by Adam Hale Shapiro (FRBSF Economic Letters)
An analysis of PCE inflation suggesting that supply-side factors have been responsible for about 80% more inflation than demand-side factors (though those have also added substantially to overall PCE inflation. [Link]
The Supply-Side Damage Has Begun: The Dark Side Of Fed Tightening by Skanda Amarnath (Employ America)
The Fed’s tightening campaign has led to significant damage in housing markets already, and that damage is likely to lead to long-term damage to the supply side, making housing more expensive long-term. [Link]
Real Estate
Empty Wall Street Offices to Be Revived as Apartments by Rebecca Picciotto (WSJ)
A giant office tower at 55 Broad St is being renovated and converted into apartments as strong demand for rental units meets a slowdown in demand for central business district office. [Link; paywall]
Sky-High Housing Prices Look Back Down to Earth by Charlie Wells (Bloomberg)
After a staggering surge in home prices around the world, higher rates and eye-watering valuations are coming back to bite recent buyers. [Link; soft paywall]
Investing
JPMorgan Says Retail Investors Are Finally Bailing on Stocks by Lu Wang (Yahoo/Bloomberg)
After sticking with stocks all the way down, smaller investors may be starting to capitulate…just in time for stocks to rally, if the contrarian history of retail investors is any indication. [Link]
Facebook, Netflix and PayPal Are Value Stocks Now by Gunjan Banerji (WSJ)
Former high-flying tech names Meta (FB), Netflix (NFLX), and PayPal (PYPL) are all headed from growth to value per FTSE Russell methodologies which are updating the lists of stocks by style. [Link; paywall]
Ecology
World’s biggest bacteria discovered in Caribbean mangrove swamp by Clive Cookson (FT)
An absolutely enormous bacteria 50x as large as the previous record has been discovered in a mangrove swamp in Guadalupe; unlike virtually all other bacteria species, these are literally visible to the naked eye. [Link; paywall]
New Kings
Khabane Lame unseats Charli D’Amelio as top TikTok star with 142.8M fans by Andrew Court (NYP)
A former machine operator whose videos parody excesses of other creators has become the most-followed creator on TikTok. [Link; auto-playing video]
This Teen Has Already Broken Some of Usain Bolt’s Records. He’s Getting Faster. by Jeré Longman (NYT)
An 18-year old has become the fourth-fastest 200-meter runner in world history, and is a serious contender for the US championships this year. [Link; soft paywall]
Read Bespoke’s most actionable market research by joining Bespoke Premium today! Get started here.
Have a great weekend!
The Bespoke Report – 6/24/22 – The Frantic Fed
This week’s Bespoke Report newsletter is now available for members.
Equity markets turned in a more positive week as interest rates traders mulled the possibility of lower commodity prices bailing out a Fed that looks intent on committing a policy error. We discuss the Fed’s missteps, the widespread declines in a number of major commodity markets, the relationship between recessions and bear markets, the messages being sent by interest rates, why oil supply problems aren’t fixed even if prices have dropped, the implications of large declines like the last few weeks for forward returns, global equity market performance and trends, bad overseas economic data this week, slowing manufacturing surveys in the US and around the world, housing affordability, interest rate sensitive sectors of the stock market, and more in this week’s Bespoke Report.
To read this week’s full Bespoke Report newsletter and access everything else Bespoke’s research platform has to offer, start a two-week trial to one of our three membership levels.

