First Day of the Month Trends
Earlier today, we sent out our Chart of the Day highlighting seasonal trends for the month of September. Breaking this down further, below we break down some seasonal trends for the first trading day of September relative to all other months over the last 50 years (since 1972). During this span, the first trading day of September has been weaker than the first trading day of any other month with the S&P 500 averaging a decline of 0.11%. However, the positivity rate is above 50% and the median performance is a gain of 0.05%, and much of the negativity comes after the index posts a gain in August.
Over the last 50 years, September has averaged a loss of 0.32% (median: -0.07%) on the first trading day of September following gains in August, trading lower 54% of the time. On an average basis, September has been the worst first trading day of the month following gains in the prior month, but when it comes to both median and positivity rates, August is worse. On the other hand, when August resulted in losses for the S&P 500, September has averaged a gain of 0.16% on the first trading day of September, posting gains 59% of the time. Click here to learn more about Bespoke’s premium stock market research service.

The chart below is included to help you visualize the comparative performance of the first trading day in September relative to other months. Perhaps one of the more surprising aspects of this chart is that fact that despite being known as a positive month, positivity rates on the first trading day of December have been weak. Along with August, it is the only month where the first trading day of the month has been down more often than it has been up regardless of whether the prior month was up or down.

August Declines All Around the World
The end of August is here and US equities, as measured by the S&P 500 ETF (SPY), have been on a wild ride. At the mid-month high, SPY was sitting on a 4.3% month-to-date gain, but that has more than entirely been erased as it is on pace to finish the month down closer to 3.5%. The country ETF of each other major global economy that we track in our Global Macro Dashboard is a similar story. Across these countries, on average, they had reached a 3.13% gain at their month-to-date highs, but today they are down an average of 3.5% MTD. Overall, developed markets have faired much worse than emerging market countries with average declines of 4.82% versus 1.24%, respectively. In fact, there are only two ETFs—Brazil (EWZ) and India (INDA)—that are currently positive for the month. Meanwhile, China (MCHI) is unchanged. On the other end of the spectrum, Sweden (EWD) has been the worst performer nearing an 11% decline with a number of other European nations following up with the next worst performance.
With stock markets around the world giving up the ghost in August, most have moved back below their 50-DMAs or even into oversold territory. There are no country ETFs more than one standard deviation above their moving averages although EWZ and INDA have only moved out of overbought territory in the past week.

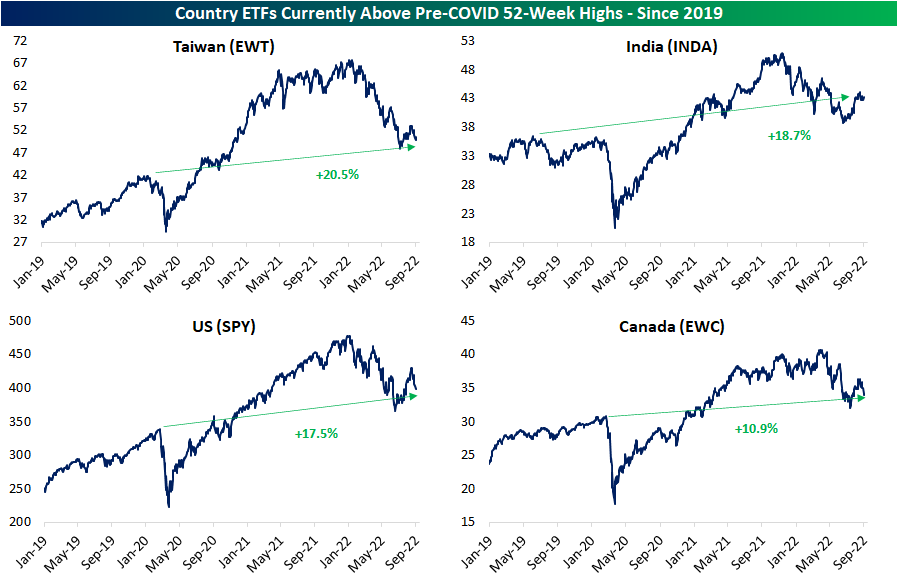
As we show in the table above, this year’s declines have resulted in the average country ETF falling 24% below its 52-week high. Those declines bring the vast majority of these countries back below pre-COVID highs as well. At the moment, there are only four countries that remain above pre-COVID 52-week highs: Taiwan (EWT), India (INDA), the United States (SPY), and Canada (EWC). This exclusive group would need to fall substantially further to revert back to those prior highs, and as shown in the chart below, each one would also still have support at lows from earlier this year before pre-COVID highs become a technical level worth eying. Click here to learn more about Bespoke’s premium stock market research service.
September Seasonality: Mega-Caps
As we get ready to enter September, the five US mega-caps have a lot to recover in order to erase their year-to-date losses, with the average stock being down 19.4% so far in 2022. Although investors hope for a recovery, historical seasonal trends for the month of September do not bode well for these five stocks. Over the last ten years, Apple (AAPL), Alphabet (GOOGL), Amazon (AMZN), Microsoft (MSFT), and Tesla (TSLA) have all struggled in September, with all of them averaging losses during the month. On a median basis, only GOOGL has posted positive returns in September, while AAPL has been the weakest performer.
September is the only month in which none of the five mega-cap stocks have averaged a gain. However, just as April showers tend to bring May flowers, September’s pain has been October’s gain. On an average basis, all five of the US mega-caps have averaged gains of at least 1.6% with Alphabet, Microsoft, and Tesla all averaging gains of more than 4%. Click here to start a two-week trial to Bespoke Premium and receive our paid content in real-time.

Bespoke’s Morning Lineup – 8/31/22 – Welcome Back ADP
See what’s driving market performance around the world in today’s Morning Lineup. Bespoke’s Morning Lineup is the best way to start your trading day. Read it now by starting a two-week trial to Bespoke Premium. CLICK HERE to learn more and start your trial.
“The market is not an invention of capitalism. It has existed for centuries. It is an invention of civilization.” – Mikhail Gorbachev

Below is a snippet of content from today’s Morning Lineup for Bespoke Premium members. Start a two-week trial to Bespoke Premium now to access the full report.
Futures have been trading on either side of unchanged throughout the overnight session as equity markets look to break the post-Jackson Hole losing streak. Treasury yields are higher, but crude oil is lower again as WTI has broken below $90 per barrel.
In economic news, after a summer sabbatical, ADP released its re-tooled Private Payrolls report which came in well below forecasts at a level of 132K versus consensus forecasts for a reading above 300K. The only other report on the calendar for the last trading day of August is the Chicago PMI at 9:45. That report is expected to improve slightly to 52.4 from last month’s weaker-than-expected reading of 52.1.
In yesterday’s Chart of the Day, we discussed the weakening breadth picture in the S&P 500 since the rejection of the 200-DMA back on 8/16. This is illustrated in the 10-day advance/decline (A/D) line for the S&P 500 which dropped yesterday to its most oversold levels since mid-June.

One sector where breadth has been notably weak has been Technology. As shown in the chart below, not only has the 10-day A/D line for the S&P 500’s largest sector dropped to its lowest levels since June, but the Technology sector’s 10-day A/D line hasn’t been more oversold in the last year.

Our Morning Lineup keeps readers on top of earnings data, economic news, global headlines, and market internals. We’re biased (of course!), but we think it’s the best and most helpful pre-market report in existence!
Start a two-week trial to Bespoke Premium to read today’s full Morning Lineup.
High Correlation Between Stocks and Bonds
So far in 2022, stocks and bonds have both sold off, leading investors with a balanced portfolio to experience historically painful drawdowns. Rates have risen, and partially because of this fact, equities have had a tough year. The S&P 500 ETF (SPY) is down 16.0% on a YTD basis, while the iShares Core US Aggregate Bond ETF (AGG) has shed 11.3% of its value. Typically, rates fall alongside equities, as investors shift their capital allocations to safer assets. 2022 has been different, though, and has seen selling in both bonds and equities. This has resulted in a historic level of positive correlation between the ETFs SPY and AGG going back to 2004 when AGG first started trading. Click here to start a two-week trial to Bespoke Premium and receive our paid content in real-time.
Although the 200-day correlation between stocks (SPY) and bonds (AGG) has been higher once before (in late 2009), the current level remains particularly elevated. The current 200-day correlation sits at 0.87, which signifies a strong positive relationship. In the last 200 days, stocks have moved in the opposite direction of rates on most days, as the market is incredibly focused on the bond market as the Fed transitions from an accommodative to a restrictive stance in the face of higher inflation. Interestingly, the correlation coefficient does appear to be rolling over, moving lower in each of the last 15 trading sessions. Historically speaking, the correlation coefficient has tended to turn negative not long after rolling over, as illustrated by the chart below.

The more we zoom in, the more the rollover becomes clear. The higher frequency measures, such as the 100 and 50-day correlation coefficients, have already moved substantially off of their recent highs, even though they are still elevated relative to history. The 100-day correlation coefficient is now at just 0.70, while the 50-day coefficient is even lower at 0.55, the lowest levels since mid-June and mid-May, respectively. This tells us that the 200-day correlation will likely pull back further, thus giving SPY a chance to gain even as rates rise, and visa-versa. As evidence of this, today SPY is down over 125 basis points even as AGG is up six bps, moving in opposite directions. To make a long story short, bonds and stocks may begin to diverge in terms of performance as the correlation between the two assets begins to roll over. Now you just have to figure out which direction they’ll each go! Click here to start a two-week trial to Bespoke Premium and receive our paid content in real-time.


The rolling 100-day correlation between stocks and bonds has been over 0.5 (or 50%) for 129 trading days, which is the longest streak since the inception of AGG by a considerable margin. Although the coefficient is declining, the 100-day correlation would need to drop another 0.2 points for this streak to end. Click here to start a two-week trial to Bespoke Premium and receive our paid content in real-time.

Chinese Stocks Helping FANG+
Given the market cap weighted methodology of the index, the S&P 500 receives outsized impacts from the largest stocks making mega caps like Apple (AAPL) or Amazon (AMZN) a critical group to look at. The FANG+ index which tracks some of the largest and most highly traded tech giants helps to provide a glimpse at the performance of said mega caps. On a relative basis versus the S&P 500, the NYSE’s FANG+ index has been trending lower since last November around the time of the peak of the growth/Tech trade, but it peaked even further back in early 2021. The relative strength line then hit a low in the late spring of this year and has been on the move higher alongside the S&P 500 ever since. In the past few weeks, however, the line has begun to roll over moving in line with that downtrend.
One important factor to note about the FANG+ Index is the membership of two Chinese mega-cap stocks: Baidu (BIDU) and Alibaba (BABA). Given the past year and a half’s news slate regarding the potential delisting of Chinese stocks on US equity markets, these two names are in a different boat than the rest of the FANG+ cohort, and that has been reflected in price action. Put differently, the FANG+ index is a good, but far from perfect, proxy for mega caps because of the inclusion of Chinese names which face exogenous risks that do not apply to US-based mega-caps. Excluding those two, the FANG+ index’s relative strength line versus the S&P 500 peaked far later in late 2021, and the recent turn lower has been a more concrete rejection of a breakout from the recent downtrend.

While delisting risk has generally plagued BABA and BIDU for more than a year leaving them 70% and 58% below all-time highs, respectively, at least in the short term there has been some relief. Headlines out late last week reported the signing of a cooperative agreement for auditing these companies resulting in a lower—but still real—probability of delisting. As a result, BIDU and BABA have left their peers behind as the only two FANG+ members in the green since the broader market’s August 16th high. For BIDU, that positive performance so far has held in spite of a weak reaction to earnings Tuesday as well. In other words, positive news for Chinese members of the FANG+ stocks has helped to mask a degree of the weakness of one of the more important indicators of broader market health. Click here to learn more about Bespoke’s premium stock market research service.

Q2 Earnings Season Conference Call Recaps
Bespoke’s Conference Call Recaps provide helpful summaries of corporate conference calls throughout earnings season. We go through the conference calls of some of the most important companies in the market and summarize key topics covered by management. These recaps include information regarding each company’s financial results, growth by segment, as well as some aspects of the business that management expects to impact future results. We also identify trends emerging for the broader economy in these recaps.
Bespoke’s Conference Call Recaps are available at the Bespoke Institutional level only. You can sign up for Bespoke Institutional now and receive a 14-day trial to read our newest Conference Call recaps. To sign up, choose either the monthly or annual checkout link below:
Bespoke Institutional – Monthly Payment Plan
Bespoke Institutional – Annual Payment Plan
Below is a list of the Conference Call Recaps published during the Q2 2022 and Q1 2022 earnings reporting period.
Q2 2022 Recaps:
Baidu — Q2 2022

Salesforce — Q2 2023

NVIDIA — Q2 2023

Zoom — Q2 2023

Q2 Previously Published Recaps
Deere Q3 Conference Call — 8/19/22
Cisco Q4 Conference Call — 8/18/22
Target Q2 Conference Call — 8/17/22
Home Depot Q2 Conference Call — 8/16/22
Walmart Q2 Conference Call — 8/16/22
Disney Q3 Conference Call — 8/10/22
The Trade Desk Q2 Conference Call — 8/10/22
Coinbase Q2 Conference Call — 8/9/22
Tyson Foods Q3 Conference Call — 8/8/22
Alibaba Q1 Conference Call — 8/4/22
PayPal Q2 Conference Call — 8/4/22
Starbucks Q3 Conference Call — 8/4/22
Advanced Micro Devices Q2 Conference Call — 8/4/22
Caterpillar Q2 Conference Call — 8/2/22
Uber Q2 Conference Call — 8/2/22
Builders FirstSource Q2 Conference Call — 8/1/22
Apple Q3 Conference Call — 7/28/22
Amazon Q2 Conference Call — 7/28/22
Ford Q2 Conference Call — 7/27/22
Meta Platforms Q2 Conference Call — 7/27/22
Automatic Data Processing Q4 Conference Call — 7/27/22
Alphabet Q2 Conference Call — 7/26/22
Microsoft Q4 Conference Call — 7/26/22
3M Q2 Conference Call — 7/26/22
McDonald’s Q2 Conference Call — 7/26/22
Whirlpool Q2 Conference Call — 7/25/22
PPG Industries Q2 Conference Call — 7/22/22
American Express Q2 Conference Call — 7/22/22
Freeport-McMoRan Q2 Conference Call — 7/21/22
Blackstone Q2 Conference Call — 7/21/22
Tesla Q2 Conference Call — 7/20/22
Baker Hughes Q2 Conference Call — 7/20/22
Netflix Q2 Conference Call — 7/19/22
Johnson & Johnson Q2 Conference Call — 7/19/22
International Business Machines Q2 Conference Call — 7/18/22
Goldman Sachs Q2 Conference Call — 7/18/22
Citigroup Q2 Conference Call — 7/15/22
Blackrock Q2 Conference Call — 7/15/22
JP Morgan Q2 Conference Call — 7/14/22
Taiwan Semiconductor Q2 Conference Call — 7/14/22
Delta Q2 Conference Call — 7/13/22
PepsiCo Q2 Conference Call — 7/12/22
Constellation Brands Q1 Conference Call — 6/30/22
Walgreens Q3 Conference Call — 6/30/22
Nike Q4 Conference Call — 6/27/22
CarMax Q1 Conference Call — 6/24/22
FedEx Q4 Conference Call — 6/23/22
KB Home Q2 Conference Call — 6/22/22
Adobe Q2 Conference Call — 6/16/22
Kroger Q1 Conference Call — 6/16/22
Oracle Q4 Conference Call — 6/13/22
Lululemon Q1 Conference Call — 6/2/22
Recaps published during Q1 2022 are available with a Bespoke Institutional subscription:
Salesforce Q1 Conference Call — 5/31/22
NVIDIA Q1 Conference Call — 5/25/22
Best Buy Q1 Conference Call — 5/24/22
Zoom Q1 Conference Call — 5/23/22
Deere Q2 Conference Call — 5/20/22
Palo Alto Networks Q3 Conference Call — 5/19/22
Target Q1 Conference Call — 5/18/22
Q1 Previously Published Recaps
Home Depot Q1 Conference Call — 5/17/22
Walmart Q1 Conference Call — 5/17/22
Disney Q2 Conference Call — 5/11/22
Roblox Q1 Conference Call — 5/11/22
Simon Property Q1 Conference Call — 5/9/22
Tyson Foods Q2 Conference Call — 5/9/22
Block Q1 Conference Call — 5/5/22
Albemarle Q1 Conference Call — 5/5/22
Cheniere Energy Q1 Conference Call — 5/4/22
Uber Q1 Conference Call — 5/4/22
Starbucks Q1 Conference Call — 5/3/22
Advanced Micro Devices Q1 Conference Call — 5/3/22
Hilton Hotels Q1 Conference Call — 5/3/22
Amazon Q1 Conference Call — 4/28/22
Apple Q2 Conference Call — 4/28/22
United Rentals Q1 Conference Call — 4/28/22
McDonald’s Q1 Conference Call — 4/28/22
Meta Platforms Q1 Conference Call — 4/27/22
Automatic Data Processing Q3 Conference Call — 4/27/22
Chipotle Q1 Conference Call — 4/26/22
Microsoft Q3 Conference Call — 4/26/22
Alphabet Q1 Conference Call — 4/26/22
United Parcel Service Q1 Conference Call — 4/26/22
Whirlpool Q1 Conference Call — 4/25/22
Coca-Cola Q1 Conference Call — 4/25/22
American Express Q1 Conference Call — 04/22/22
Snap Q1 Conference Call — 04/21/22
Pool Corp Q1 Conference Call — 04/21/22
Alcoa Q1 Conference Call — 04/20/22
Tesla Q1 Conference Call — 04/20/22
IBM Q1 Conference Call — 04/19/22
Johnson & Johnson Q1 Conference Call — 04/19/22
JB Hunt Conference Call — 04/18/22
Citigroup Q1 Conference Call — 04/14/22
UnitedHealth Group Q1 Conference Call — 04/14/22
Taiwan Semiconductor Q1 Conference Call — 04/14/22
BlackRock Q1 Conference Call — 04/13/22
Delta Q1 Conference Call — 04/13/22
JP Morgan Q1 Conference Call — 04/13/22
CarMax Q4 Conference Call — 04/12/22
Constellation Brands Q4 Conference Call — 4/7/22
Walgreens Q2 Conference Call — 3/31/22
Micron Q2 Conference Call — 3/29/22
Lululemon Q4 Conference Call — 3/29/22
KB Home Q1 Conference Call — 3/23/22
Adobe Q1 Conference Call — 3/22/22
Nike Q3 Conference Call — 3/21/22
Bespoke’s Morning Lineup – 8/30/22 – Lack of Imagination
See what’s driving market performance around the world in today’s Morning Lineup. Bespoke’s Morning Lineup is the best way to start your trading day. Read it now by starting a two-week trial to Bespoke Premium. CLICK HERE to learn more and start your trial.
“Logic will get you from A to Z; imagination will get you everywhere.” – Albert Einstein
Below is a snippet of content from today’s Morning Lineup for Bespoke Premium members. Start a two-week trial to Bespoke Premium now to access the full report.
After two days of losses, futures have made an attempt to rally today, but as the opening bell approaches, the rally has lost some steam. Treasury yields are still lower on the day as the 10-year yield remains below 3.10%, while crude oil is down over 2%. On the economic calendar this morning, we’ll be getting house price levels from the FHFA (for June) at 9 AM Eastern and then Consumer Confidence and JOLTS at 10 AM.
It seems these days that the market is solely focused on the Fed, but at the individual stock level, it’s Bed Bath & Beyond (BBBY) and everyone else. Over the last 12 trading days, shares of BBBY have either been the best or worst-performing stock in the S&P 1500 on nine different trading days. Not only that, but on one of the three trading days where it wasn’t the best or worst performing stock in the S&P 1500, it was the 2nd worst on one of those days and in the bottom ten on the other two. There are literally hundreds of stocks in the S&P 1500 that will go months or years without cracking the top ten best or worst daily performers list, but for some reason, BBBY has been making it an everyday occurrence lately. Maybe instead of the S&P 1500, we should call it the S&P Bed Bath & Beyond! It’s often tempting for investors to go where the ‘action’ is, but no one ever gets rich following the crowd. Use your imagination. It will take you places.

Our Morning Lineup keeps readers on top of earnings data, economic news, global headlines, and market internals. We’re biased (of course!), but we think it’s the best and most helpful pre-market report in existence!
Start a two-week trial to Bespoke Premium to read today’s full Morning Lineup.
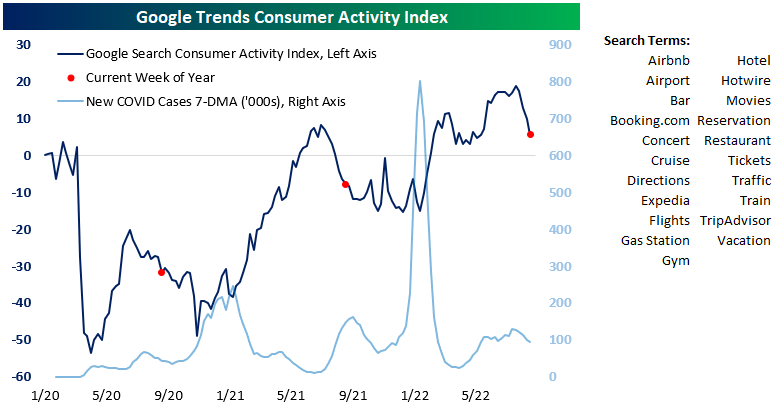
Google Searches Show Consumers Still Getting Out and About
More than two years ago during the summer of 2020, we used Google search trend data to build a US consumer activity index to gauge the strength of the re-opening of society after COVID lockdowns. The index is an aggregation of Google search trend activity for various terms like hotel, cruises, flights, bars, and restaurants, to name a few. When we first started looking at trends in searches for activities that get people out of the house and doing things again, we were trying to see how long it would take to get back to pre-COVID levels. As shown in the chart of the index below, it took until the summer of 2021 to get back to pre-COVID levels, but then activity receded again as we went into the fall last year as Omicron began to spread rapidly.
This summer we saw our Google Trend consumer activity index surge past 2021 highs as people have really started to go out and travel again. Recently, however, we’ve seen a dip in activity. As shown, this appears to be seasonal as we saw the same thing happen last year at this time. Even still, the activity index remains above the level it was at prior to the first COVID cases on US soil, so it’s hard to argue that the consumer has pulled back much — if any — this year, even with inflation raging and some economic indicators flashing recession warnings signs. Click here to learn more about Bespoke’s premium stock market research service.
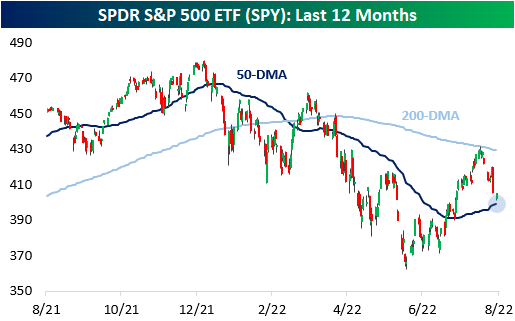
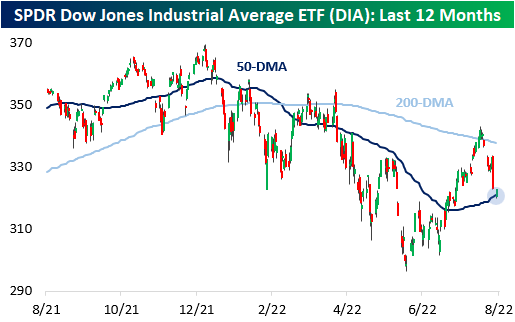
Testing of the 50-DMA
After Friday’s 3%+ sell-off, the major US indices have been bouncing around in Monday’s session as investors weigh Powell’s hawkish comments. With this sell-off comes a test of the 50-DMA, which the major indices broke above in mid-July. For those who follow technicals, this is a critical level where bulls want to see support and bears want to see price break definitively below. On the bright side, most major indices are holding up, at least for now.
Starting with the S&P 500 (SPY), the ETF is currently trading just 1.4% above the 50-DMA just two weeks after testing the 200-DMA on the upside. SPY didn’t quite touch the 50-DMA in Monday’s trading but came close enough to make the occurrence notable, and as of now is more range-bound between these moving averages than anything else. Click here to start a two-week trial to Bespoke Premium and receive our paid content in real-time.
The Nasdaq 100 ETF (QQQ), on the other hand, did test the 50-DMA in Monday’s session. It found support at this level and is now trading 64 basis points above it. QQQ has a very similar technical setup to SPY, as both have been range-bound by the 200 and 50-DMAs. QQQ currently has the widest spread between the 200 and 50-DMAs of the major US index ETFs due to higher volatility.

The Dow Jones Industrial Average ETF (DIA) did cross below the 50-DMA Monday, trading 35 basis points below the level at its intraday lows. Unlike SPY and QQQ, DIA never fully tested the 50-DMA in late July and was able to break the 200-DMA in mid-August. Unfortunately for bulls, the brief stint above the 200-DMA did not last. DIA also has the narrowest spread between the 200 and 50-DMAs at 5.2% due to lesser volatility. Click here to start a two-week trial to Bespoke Premium and receive our paid content in real-time.
Interestingly, the small-cap Russell 2000 ETF (IWM) is relatively distanced from the 50-DMA, trading 3.1% above this level as of this writing. This is more than twice the distance than the next closest major index ETF (SPY: 1.4%). Although this may imply that IWM has further downside before finding support, the index is actually outperforming QQQ on the day. However, IWM is having a worse day than both SPY and DIA. The technical setup on IWM is quite similar to DIA.

Long-story short, investors should watch how the major indices trade around their respective 50-DMAs. Further recovery tomorrow would imply support around the 50-DMA, which would be bullish in the near-term. If we see this support tomorrow, we would not be surprised to see the major indices retest the 200-DMA, but the potential results of that test is a topic for another day. Click here to start a two-week trial to Bespoke Premium and receive our paid content in real-time.