Bespoke’s Morning Lineup – 11/29/22 – Confidence Game
See what’s driving market performance around the world in today’s Morning Lineup. Bespoke’s Morning Lineup is the best way to start your trading day. Read it now by starting a two-week trial to Bespoke Premium. CLICK HERE to learn more and start your trial.
“What I learned is that nothing is given easy to you.” – Christian Pulisic

Below is a snippet of content from today’s Morning Lineup for Bespoke Premium members. Start a two-week trial to Bespoke Premium now to access the full report.
Futures were higher earlier this morning, but those gains have been evaporating like morning dew with the sunrise. Reports that China is on the verge of finally starting to relax some of its COVID restrictions helped to contribute to the positive tone in global markets overnight. The catalyst for that sentiment appears to be a story that the CCP is beginning to urge older people to get vaccinated. Reports from other sources suggest that the government will also announce that because current strains of COVID are less virulent, extreme measures to stop the spread can be relaxed. We’ve heard a number of these rumors in recent months only to see the CCP reiterate its strict zero-Covid policy, but these stories seem to have a little bit more momentum behind them.
News of a reopening in China has commodities rallying, and WTI is back to just under $79 per barrel, although the 10-year yield is a couple of basis points lower. The economic calendar is on the light side again today with housing price data at 9 AM Eastern and Consumer Confidence at 10. Over in Europe, inflation data out of Spain and Germany was lower than expected. Down south in Brazil, inflation data came in lower than expected as the y/y rate fell below 6% for the first time since 2019!
Yesterday wasn’t the type of performance that bulls were hoping for coming back from the Thanksgiving weekend holiday. With a decline of 1.54%, it was the S&P 500’s 9th worst post-Thanksgiving Monday performance in the post-WWII period. As disappointing of a day as it was for bulls, the Monday after Thanksgiving typically hasn’t been a very good day for the stock market. Since 1945, the S&P 500’s median performance on the day has been a decline of 0.29% with positive returns just 39% of the time. For comparison, on all trading days since 1945, the S&P 500’s median change has been a gain of 0.05% with positive returns 53% of the time. As demoralizing of a day that it may have been for bulls, one silver lining to Monday’s weakness is that in the nine prior years where the S&P 500 was down 1%+ on the Monday after Thanksgiving, its median performance for the rest of the year was actually better than the median for all other years.

Our Morning Lineup keeps readers on top of earnings data, economic news, global headlines, and market internals. We’re biased (of course!), but we think it’s the best and most helpful pre-market report in existence!
Start a two-week trial to Bespoke Premium to read today’s full Morning Lineup.
Black Friday and Cyber Monday Discounts Retailers (XRT)
Black Friday and Small Business Saturday are now in the rearview and Cyber Monday is underway as the holiday shopping season is off to the races. There has been a secular shift to online shopping over the past decade meaning Black Friday has a larger online element than the early bird in-store sales of yesteryear. Cyber Monday, meanwhile, may not be the main e-commerce-focused shopping day of the post-Thanksgiving week. Regardless, data from Adobe showed record online sales this year on Black Friday. While those actual sales figures are perhaps a more concrete and noteworthy data point to gauge the success of the day in generating sales, we would note that Google Search activity for the shopping day has been on the decline in the month of November (when it peaks) for the past few years now. The pandemic in particular has resulted in a sharp downward move in searches for the term. In fact, this year is on pace to have seen the lowest search interest for “Black Friday” since 2007, though with the month not quite over, data is still technically incomplete and can be revised higher.
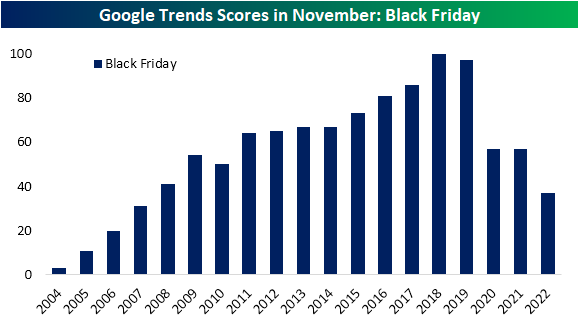
Similarly, news story mentions of Black Friday and Cyber Monday have generally trended lower over the past few years. In the chart below, we show the number of monthly news story mentions as tracked by Bloomberg in November of the terms throughout the past decade. To make it read similar to the chart above, we have indexed these readings to their peaks at 100.
Cyber Monday mentions peaked all the way back in 2018 and are currently around the low end of readings of the past several years. Black Friday, meanwhile, peaked last year, but that appears to have been a bit of an outlier as readings have generally been trending lower since 2019. All of this is not necessarily to say Cyber Monday and Black Friday are less important than in the past, but instead have likely become more ingrained into the holiday season and thus less talked about/researched.

As for how that translates to retail stocks, like consumers, investors appear to get lower prices from retailers during the busiest shopping days of the year! On average, the SPDR S&P Retail ETF (XRT) has declined 0.22% on Black Friday during its history and 1.3% on Cyber Monday. That compares to an average gain of 5 bps on all days. Additionally, there has been little consistency in positive price action. XRT has only risen a little better than a third of the time on Black Friday and just 17.65% of the time on Cyber Monday. In other words, today’s 0.66% drop in the ETF is by no means unusual. Click here to learn more about Bespoke’s premium stock market research service.

Dallas Fed Weaker Beneath the Surface
At face value, today’s release of the Dallas Fed’s manufacturing report put up a decent number with the General Business Activity index coming in at -14.4. That was up 5 points month over month and was handily better than expectations which were pointing to a further decline down to -21. Regardless of the better-than-expected reading, the negative number indicates the region’s manufacturing activity continues to decline at a steady pace (the index is still in the bottom quintile of readings in spite of this month’s rebound), and the other components only tainted the picture.

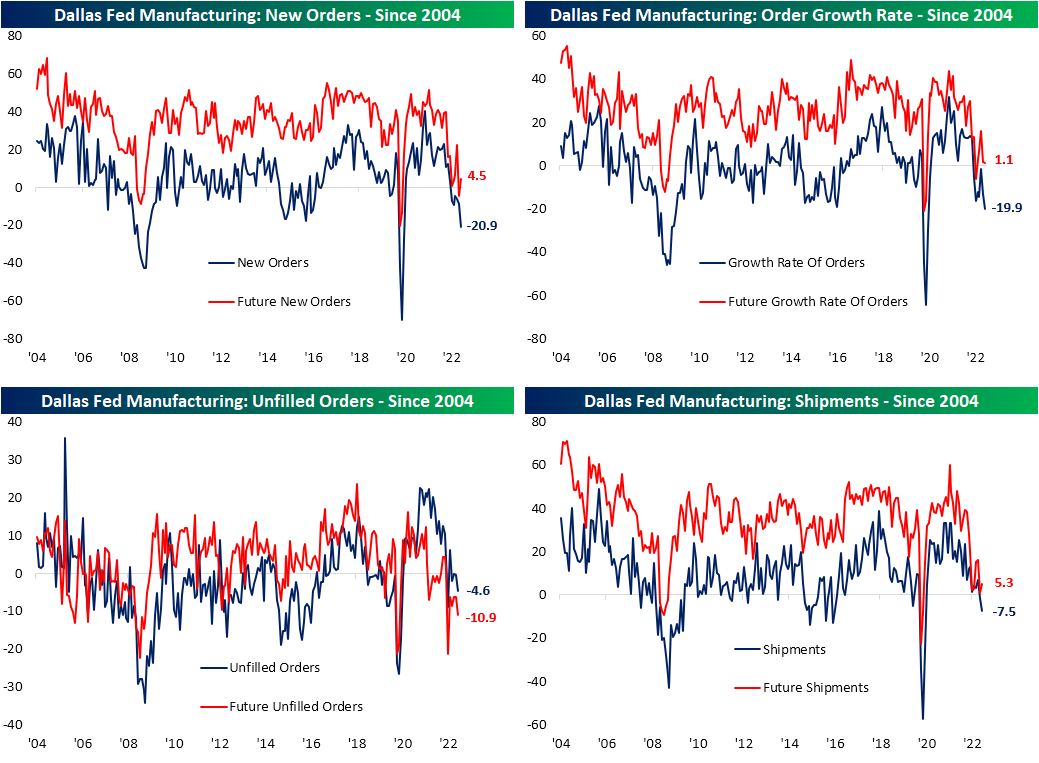
Outside of the headline number, there were only two other components with higher month-over-month readings: Inventories and Capital Expenditures. A slightly higher number of indices are in contraction than expansion with some of the more important readings like New Orders appearing to have cratered the most. Although there were more positive month-over-month moves, expectations indices are broadly sitting at far weaker levels relative to their histories than the current conditions indices. Of the 16 indices, 10 are in the bottom decile of all periods.
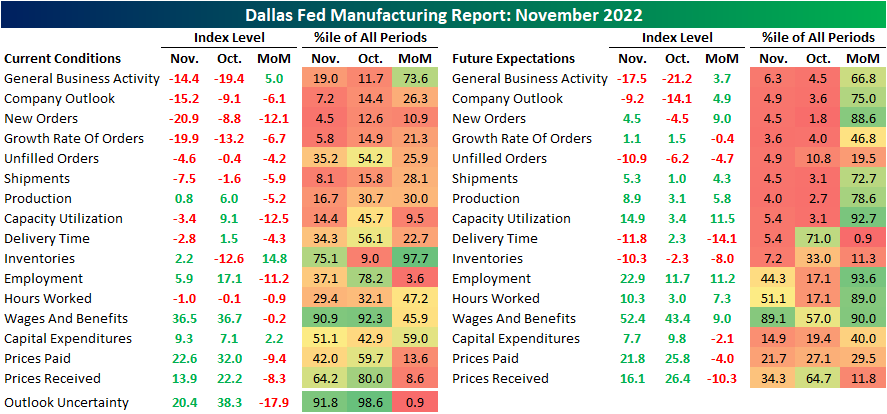
Of the current conditions indices, one of the largest declines has been for capacity utilization. That index fell from expansion into contraction in November plummeting 12.5 points (a bottom decile monthly move). Paired with a barely expansionary reading of 0.8 for production, these readings point to the region’s manufacturers cutting down on their output.

The reason for the decline is that demand has been crushed. New Orders fell another 12.1 points month over month to hit a fresh low of -20.9. That is the weakest reading since May 2020 and the only other sub-20 readings came in the first half of 2009. Unfilled Orders and Shipments are contracting in turn. While those two indices are likewise at post-pandemic lows, they are not quite as historically depressed as New Orders.
While it might not exactly net out the negatives of demand and production weakening dramatically, if there is a silver lining in this month’s report, it is the relief in price pressures. Both indices for Prices Paid and Received have plummeted reversing large portions of the post-pandemic increase. That is not to say prices themselves are turning lower, but they are increasing at a much less dramatic clip. Delivery times, on the other hand, are contracting with expectations predicting far larger declines down the road. Additionally, on the supply chain front, Inventories have begun to rise likely as a result of crimped demand.

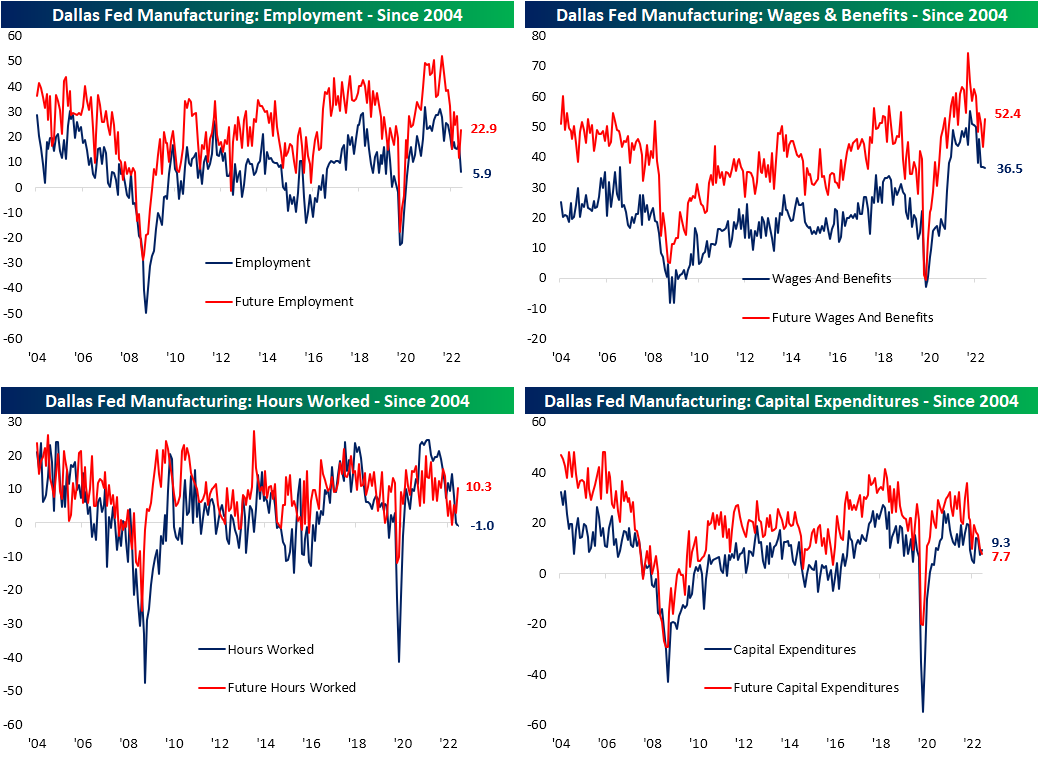
Employment metrics were another notable area of deterioration this month. While Wages and Benefits went little changed and are at the low end of the past year and a half’s range, Hours Worked are falling and hiring has slowed as the Employment index fell back into single digits to the lowest level since July 2020. Click here to learn more about Bespoke’s premium stock market research service.
Bespoke’s Morning Lineup – 11/28/22 – China Simmers
See what’s driving market performance around the world in today’s Morning Lineup. Bespoke’s Morning Lineup is the best way to start your trading day. Read it now by starting a two-week trial to Bespoke Premium. CLICK HERE to learn more and start your trial.
“Formula for Success- Rise Early, Work Hard, Strike Oil” – J. Paul Getty
Below is a snippet of content from today’s Morning Lineup for Bespoke Premium members. Start a two-week trial to Bespoke Premium now to access the full report.
It was a long weekend for most, but it’s now back to the grind for the final five weeks of 2022. After gains for US stocks last week, things are starting off on a down note as widespread protests in China weigh on sentiment and have raised concerns over supply chains for large companies like Apple (AAPL). US futures are down about 0.8% as of this writing, and the 10-year yield is down below 3.7%. The Dallas Fed Manufacturing report is the only report on the calendar today, but it’s a busy week ahead culminating with the November Non-Farm Payrolls report on Friday.
Those protests in China over the government’s strict COVID policies and continued concerns over the prospects for the global economy have crude oil prices down nearly 3% this morning, and that now takes the price of WTI down to its lowest level of the year. Yup, crude oil is down YTD.

Despite the weakness in crude oil, Energy stocks remain well in the black YTD with the Energy sector still up over 70%. That’s nearly 70 percentage points above the next closest sector (Utilities: +1.21%). The ten largest components of the sector are also all well into positive territory for the year with gains in the range of 50% for Pioneer Natural (PXD) to more than 140% for Occidental Petroleum (OXY). When WTI was trading well over $100 per barrel, the bullish case for energy stocks was that these companies would be profitable even if crude oil prices corrected sharply. Now that WTI has corrected by more than 40% from its closing high earlier this year, energy companies may still be profitable at these levels but not by nearly as much as they were just a few months ago.

Our Morning Lineup keeps readers on top of earnings data, economic news, global headlines, and market internals. We’re biased (of course!), but we think it’s the best and most helpful pre-market report in existence!
Start a two-week trial to Bespoke Premium to read today’s full Morning Lineup.
Bespoke Brunch Reads: 11/27/22
Welcome to Bespoke Brunch Reads — a linkfest of the favorite things we read over the past week. The links are mostly market related, but there are some other interesting subjects covered as well. We hope you enjoy the food for thought as a supplement to the research we provide you during the week.
While you’re here, join Bespoke Premium with a 30-day trial!
FTX
Congressmembers Tried to Stop the SEC’s Inquiry Into FTX by David Dayen (The American Prospect)
A bipartisan group of House members back in March urged the SEC to lay off FTX earlier this year, about 8 months before the exchange collapsed and dragged billions in customer deposits with it. [Link]
Despite Boasting Of Big Profits, FTX And Alameda Lost $3.7 Billion Before 2022 by Jeff Kauflin (Forbes)
A bankruptcy court filing claims that the trading business which Sam Bankman-Fried funded with the assets of his exchange FTX lost almost $4bn in 2021. [Link]
Social Media
Facebook’s Most Popular Posts Were Trash. Here Is How It Cleaned Up. by Jeff Horowitz (WSJ)
After years of seeing spam posts of one kind or another reach the furthest across the company, Facebook has finally taken real steps to crack down on ways to turn down amplification of those kinds of posts. [Link; paywall]
Tax filing websites have been sending users’ financial information to Facebook by Simon Fondrie-Teitler, Angie Waller, and Colin Lecher (The Verge)
Meta’s Pixel service has been capturing tracking data including names, addresses, income, filing status, refund amounts and more. [Link]
Elon Musk Embraces Twitter’s Radical Fact-Checking Experiment by Carl Miller (Wired)
One novel approach to moderation that new Twitter CEO Elon Musk has been pushing is a feature that adds context and details from other users instead of simply deleting posts. [Link; soft paywall]
Sports
From 1966 to now: the evolution of World Cup football by John Muller (The Athletic)
A data-fueled and very detailed look at the evolution of World Cup tactics from the mid-1960s through today. The only constant in the sport of soccer, it seems, is action and reaction as different tactics are replicated and adjusted. [Link; paywall]
Sports media organizations are doubling down on betting by Max Tani (Semafor)
Evolving norms around sports gambling is creating a complicated dance between media organization management and their writers. [Link]
Heroism
Army Veteran Went Into ‘Combat Mode’ to Disarm the Club Q Gunman by Dave Phillips (NYT)
A profile of the man who saved lives at the Colorado Springs nightclub attacked last week; the man charged the 300 pound rifle-armed murderer without a weapon and ended up completely incapacitating them. [Link; soft paywall]
Batteries
Engineers solve a mystery on the path to smaller, lighter batteries by David L. Chandler (MIT News)
A new solid state lithium battery developed at MIT offers the chance for much higher capacity than the current generation of batteries. Specifically, the researchers identified the cause of dendrites, which disable current versions of solid state batteries. [Link]
ESG
SEC Charges Goldman Sachs Asset Management for Failing to Follow its Policies and Procedures Involving ESG Investments (SEC)
An SEC order reported this week has meant fines for Goldman, which mislead investors in a few funds about ESG selection criteria and procedures related to those criteria. [Link]
Vaccines
I lost my child to flu. Trust me, you need a shot. by Zachary Yaksich (Voices For Vaccines)
A moving call for parents to vaccinate themselves and their children against the seasonal flu, which kills tens of thousands of people per year including the author’s six year old daughter. [Link]
Read Bespoke’s most actionable market research by joining Bespoke Premium today! Get started here.
Have a great weekend!
Thankful, Not Thankful 2022
Between travel delays, crowded stores, delayed deliveries, and unhealthy eating and drinking habits, there’s a lot not to like about the holidays. But all of these pale in comparison to the quality time spent with family and friends and the new memories we make each year. Within a few months, you won’t even remember the traffic jam on the way to dinner or that you had to wait until January to get the iPhone 14 Plus. What you won’t forget, though, are the family football games, hanging around the fire, one of ‘those’ stories from your aunt or uncle, a post-dinner game of salad bowl, or that late-night McRib run to McDonald’s with the cousins who are old enough to drive (but not old enough to drink). These are the things in life that really matter.
There has been no shortage of things to complain about in the market and economy this year, but it could be worse, and not everything has been horrible. This Thanksgiving, we are introducing our list of market and economic-related things not to be thankful for this year, but more importantly, what we also have to be thankful for. Enjoy the rest of your weekend! Click here to learn more about Bespoke’s premium stock market research service.

Bespoke’s Morning Lineup – 11/25/22 – Half Day
See what’s driving market performance around the world in today’s Morning Lineup. Bespoke’s Morning Lineup is the best way to start your trading day. Read it now by starting a two-week trial to Bespoke Premium. CLICK HERE to learn more and start your trial.
“If you cannot get rid of the family skeleton, you may as well make it dance.” – George Bernard Shaw
Below is a snippet of content from today’s Morning Lineup for Bespoke Premium members. Start a two-week trial to Bespoke Premium now to access the full report.
We hope everyone had an enjoyable Thanksgiving, and if you have the day off today, we hope you enjoy the long weekend. US equity markets are open but for a half session with trading for the week ending at 1 PM Eastern. Futures are mixed on the session so far with the Dow indicated higher and the Nasdaq trading lower. Shares of Apple (AAPL) are down nearly 1% in the pre-market as workers at Foxconn plants in China have been staging protests over pay and working conditions. The company has even had to offer bonuses of up to a month’s pay to employees willing to quit and board buses to go back home.
In terms of data today, there is none to speak of on either the economic or earnings front. European markets are little changed this morning but with a positive bias. Over in Europe, Q3 GDP was slightly stronger than expected, but Consumer Confidence came in weaker than expected and missed expectations for the 9th time in the last ten months.
Through the first three trading days of this week, the S&P 500 was up 1.56%. For a typically positive week, a gain of this magnitude is strong even for Thanksgiving week and ranks as the 13th best week-to-date performance through Wednesday of Thanksgiving week since 1945. As we noted in a post earlier this week, the majority of the gains from Thanksgiving week typically come on Wednesday and Friday. The S&P 500’s median performance on the Friday after Thanksgiving has been a gain of 0.24% with positive returns two-thirds of the time. In years where the S&P 500 was up over 1% on the week heading into Thanksgiving, the median gain was even stronger at 0.36% compared to a gain of just 0.15% on all other Thanksgiving Fridays. Even more notable is the consistency of positive returns. In those weeks where the S&P 500 was up 1%+ in the first three trading days of the week, the S&P 500 traded higher on Friday 87.5% of the time. On all other Thanksgiving Fridays, however, the S&P 500 was higher barely more than half of the time.

Our Morning Lineup keeps readers on top of earnings data, economic news, global headlines, and market internals. We’re biased (of course!), but we think it’s the best and most helpful pre-market report in existence!
Start a two-week trial to Bespoke Premium to read today’s full Morning Lineup.
Continuing Claims Flash Recessionary Warning
Due to tomorrow’s holiday, this week’s jobless claims data was released a day early and were not exactly a release to be thankful for. The latest readings were bad all around with both initial and continuing claims rising more than expected. For initial claims, last week’s level was revised up by 1K to 222K, and this week’s reading rose by 18K to 240K. That is the highest level of claims since the week of August 18th, and the sequential increase was the largest since the end of September. Whereas recent readings on jobless claims have been healthy in the sense that they have remained within the range of low readings from the few years prior to the pandemic, this new high would have been at the high end of the 2008 to 2019 pre-pandemic range.

On a non-seasonally adjusted basis, the current week of the year typically sees claims move higher with a week-over-week increase 82% of the time. However, this week’s increase was around 10K larger than what the comparable week of the year has historically averaged. In other words, from a seasonal perspective, the rise in claims is perfectly normal in terms of direction but less so in terms of size. Now at 248K, claims are in line with levels for the comparable weeks in 2021 and 2019.

Continuing claims continue to be the more interesting story around jobless claims. Delayed one week to the initial claims number, continuing claims as of the week of November 11th rose for a sixth week in a row. As we noted last week, such a streak of consistent increases in continuing claims has been rare, especially in the years following the Global Financial Crisis. In fact, the rise during the onset of the pandemic in 2020—which lasted for 10 consecutive weeks—was the only other notably lengthy streak post-2009. Prior to that, there have only been a handful of other times in which continuing claims have risen for 10 weeks or more.

As for the current rise in claims, the latest increase leaves the reading at 1.551 million which is the highest level since the first week of March. From a historical perspective, though, that remains an impressively low reading and well below the pre-pandemic range even if it is rapidly deteriorating.

As for just how bad of a stretch it has been for continuing claims, the 187K increase, or 13.7% jump, during the past six weeks would be by far the largest in over a decade outside of the start of the pandemic. Additionally, such a large increase in the span of six weeks is consistent with increases from all prior recessions. In fact, as claims have made their way off of historic lows, the current increase is nearly the same size as the early 1990s recession and is even larger than those in the early 1980s and early 2000s. Click here to learn more about Bespoke’s premium stock market research service.

Bespoke’s Morning Lineup – 11/23/22 – Full Plate of Data
See what’s driving market performance around the world in today’s Morning Lineup. Bespoke’s Morning Lineup is the best way to start your trading day. Read it now by starting a two-week trial to Bespoke Premium. CLICK HERE to learn more and start your trial.
“Those who previously claimed they were too old or ill to work embraced the idea of private property once they could enjoy the fruits of their own labor.” – Caroline Baum, “The Story of Thanksgiving – and Proper Incentives”
Below is a snippet of content from today’s Morning Lineup for Bespoke Premium members. Start a two-week trial to Bespoke Premium now to access the full report.
Investors may be thinking ahead to the Thanksgiving holiday and spending time with friends and family, but there is still a full-day left of trading ahead of us. The earnings calendar is light as Deere (DE) has been the only report on the calendar, but there’s plenty of economic data to tide you over as we try to jam three days worth of reports into one day. Things kick off at 8:30 with Durable Goods and Initial Claims. At 9:45, S&P will release flash PMI readings for the manufacturing and services sector, and then at 10 AM, we’ll get Michigan Sentiment and New Home Sales. Not enough for you? OK. Well, how about we cap it off with some FOMC Minutes at 2 PM? Is that enough for you?
Futures are technically in the green this morning, but they’re pretty much unchanged, and we’ve seen a number of ticks this morning where they were actually unchanged. The same is true in Europe where trading has been uneventful. Economic data in the region, however, has been positive as flash PMI readings for both the manufacturing and services sectors came in higher than expected for the entire Eurozone as well as Germany, the UK, and France individually.
Which of these indices is not like the other? As technicians attempt to divine whether the S&P 500 and other major US equity benchmarks will be able to break above its 200-DMA in this current leg higher, it seems out of place to be talking about the DJIA breaking out to six-month highs. Heading into the Thanksgiving holiday, the DJIA has rallied more than 19% off its Q3 low and is already more than 5% above its 200-DMA. The DJIA isn’t often thought of as a leading indicator for the broader market, but more than a few 401k plans have hopes that the rest of the indices play follow the leader.

Our Morning Lineup keeps readers on top of earnings data, economic news, global headlines, and market internals. We’re biased (of course!), but we think it’s the best and most helpful pre-market report in existence!
Start a two-week trial to Bespoke Premium to read today’s full Morning Lineup.
Speculators Smelting Shorts
As we do each Monday, in last night’s Closer we recapped the latest Commitments of Traders data from the CFTC. This data set provides a look at how speculators have positioned themselves (long or short) in various futures. We show those readings as a net percentage of open interest. In other words, higher positive values indicate a much larger share of open interest is positioned long and vice versa for negative readings.
In the commodities space, after longs backed out in a big way earlier this year, readings have risen rapidly in gold, silver, copper, and palladium futures. As for how sharp of turnarounds they have been, the increase over the past two weeks rank in the top decile of all periods in data going back to the mid 1980s for each of the previously mentioned metals.
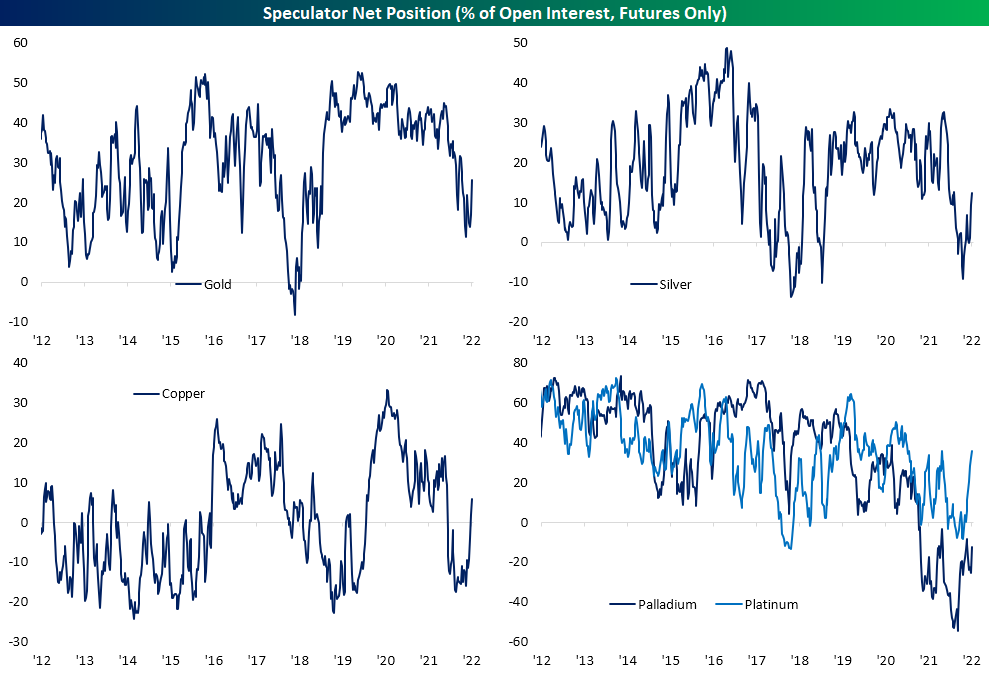
For the most widely followed of these metals (gold, silver, and copper), this is only the 14th time on record each of their two week changes ranked in the 90th percentile or above in the same week without another occurrence in the prior three months. The most recent occurrence of such a large broad increase in major metals positioning was in July of 2014.
Although these readings indicate that speculators are increasingly placing long bets on these futures, such data actually can be a bit of a messy indicator for forward performance. Although these readings indicate bullish sentiment, forward performance is the opposite in the near term with dramatic underperformance relative to the norm one week later (which we have seen play out so far). One month and three month performance tends to see further declines in these commodities as well which is not exactly unheard of for precious metals while it is dramatically weaker for the industrial metals. Six month performance is generally more in line with historical norms while the bullishness in positioning only seems to come through to price action one year out. One year average returns for gold, silver, and copper are much stronger than the norm, although positivity rates are still just barely above 50/50. (Past performance is no guarantee of future results.) Click here to learn more about Bespoke’s premium stock market research service.
