Tesla (TSLA) Loses Its Charge
Whereas Tesla (TSLA) had been a darling of the growth trade posting gaudy returns in the first year and a half of the pandemic, since November of last year it has turned into a major pain trade. While the weakness really extends out for more than a year, only looking more recently, the stock has been in free fall and is on pace for its seventh consecutive decline in a row. As shown below, that is tied for the longest streak of consecutive declines since the IPO in 2010. The other streaks of a similar duration were in September 2018, December 2014, and January 2013, and none of those streaks extended to eight trading days. Although there is precedent for TSLA trading lower as consistently as the past week and a half, the current streak leaves the others in the dust in terms of severity. Over those past seven-day streaks, the stock never declined 14% or more, and during one of the streaks (January 2013) TSLA fell less than 7%. The decline in the stock during the current seven-day streak has been over 25%!

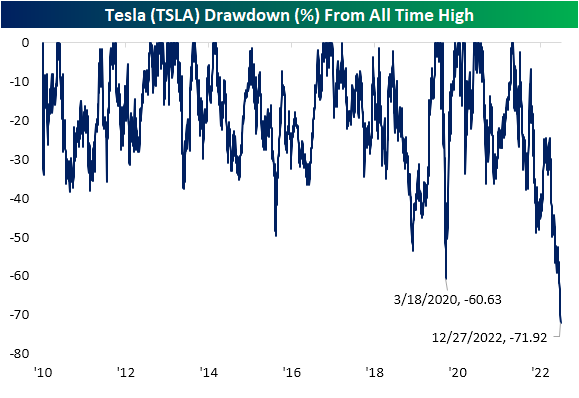
Again, that current stretch of weakness is not exactly new. Tesla has been grinding lower for over a year, and since peaking in November of last year, Tesla has seen its market cap dwindle from a high of over $1.2 trillion all the way down to only $363 billion today. The drawdown from an all-time high in the stock’s price reached nearly 72% today and is the largest in the stock’s history, surpassing the previous record drop of 60.6% during the COVID Crash in early 2020. To get back to its prior record closing high, the stock would need to rally more than 250% from current levels. Click here to learn more about Bespoke’s premium stock market research service.
Bespoke’s Morning Lineup – 12/27/22 – Easing Back into the Grind
See what’s driving market performance around the world in today’s Morning Lineup. Bespoke’s Morning Lineup is the best way to start your trading day. Read it now by starting a two-week trial to Bespoke Premium. CLICK HERE to learn more and start your trial.
“Anything worth doing is worth overdoing.” – Mick Jagger

Below is a snippet of content from today’s Morning Lineup for Bespoke Premium members. Start a two-week trial to Bespoke Premium now to access the full report.
In case you missed it last Friday while you were out holiday shopping or stuck in an airport. We also emailed out our annual Bespoke Report which covers everything you need to know about the setup for financial markets and the economy heading into 2023. You can read it here.
It’s looking like a positive day to start the week…for now. Futures are still higher but off their highs of the overnight session. It’s going to be an exceptionally quiet week for economic data and earnings. Today’s only reports are Wholesale Inventories, the FHFA House Price Index, and the Dallas Fed, and there is nothing in terms of earnings.
Bulls are hoping that today’s rally in futures marks the arrival of the Santa Claus rally where stocks advance to close out one calendar year and into the start of the next. While the last several days of trading leading into the Christmas holiday were disappointing as the S&P 500 gave up both its 200-day and 50-day moving averages, the market is basically trading right in the middle of the range it has been trading in since mid to late April. For the S&P 500 tracking ETF (SPY), the high end of that range is 430 with the low end being around 350. With a mid-point of 390, the S&P 500 is poised to open this morning just below that level at around 385. That’s the good news. The bad news is that when the S&P 500 tried to trade back above its 50-DMA last Wednesday, the rally stalled just shy of that level and that lack of momentum is a clear trait of a weak market.

Unlike SPY which can still be considered ‘rangebound’, the Nasdaq 100’s chart resembles more of a downtrend. While the lows from October are still intact, the index is still just barely 5% above its October intraday low.

Our Morning Lineup keeps readers on top of earnings data, economic news, global headlines, and market internals. We’re biased (of course!), but we think it’s the best and most helpful pre-market report in existence!
Start a two-week trial to Bespoke Premium to read today’s full Morning Lineup.
The Bespoke Report — 2023 Annual Outlook
Our Bespoke Report – 2023 Outlook is now available for Bespoke subscribers. This report covers everything you need to know about the set-up for financial markets and the economy heading into 2023. If there’s ever a “must-read” Bespoke report, this is it!
You can read our 2023 Outlook by signing up for any of our three membership levels. Enter the coupon code “OUTLOOK” at checkout for a 20% discount on your first charge. You can review our membership levels here to help make your decision.
Bespoke Newsletter Monthly Payment Plan
Bespoke Newsletter Annual Payment Plan
Bespoke Premium Monthly Payment Plan
Bespoke Premium Annual Payment Plan
Bespoke All Access (Bespoke Institutional) Monthly Payment Plan
Bespoke All Access (Bespoke Institutional Annual Payment Plan

How Did 2022’s Most Loved Stocks by Analysts Fare?
As we approach year end, today we looked at where analyst ratings stood for Russell 1,000 stocks at the end of 2021 to see how the most loved stocks at the start of the year ended up performing. Looking at just stocks with coverage from at least eight analysts, the average Russell 1,000 stock had about 59% buy ratings at the start of 2022.
Sixty-three Russell 1,000 stocks began the year with at least 90% buy ratings, while 52 stocks had less than 20% buy ratings. Those 52 stocks with less than 20% buy ratings are currently down an average of 10.7% YTD on a total return basis. The 63 stocks with 90%+ buy ratings are down an average of 22.8%.
The 38 stocks below had at least 92% buy ratings at the start of 2022. Of these 38, the 24 with 100% buy ratings are down an average of 32% YTD. The biggest of the “100% buy” stocks is Amazon (AMZN). At the start of 2022, all 59 analysts covering the name had a buy rating. It’s down just under 50% YTD as of this morning. Two of the 24 stocks with all buy ratings on 12/31/21 posted gains this year: Encompass Health (EHC) and Horizon Therapeutics (HZNP). That’s a “batting average” of under .100 with roughly 28% of Russell 1,000 stocks in the green on the year. Click here to learn more about Bespoke’s premium stock market research service.

As always, past performance is no guarantee of future results.
The Best and Worst Performing Stocks of 2022 (through 12/22)
Below are lists of the best and worst performing Russell 1,000 stocks year-to-date on a total return basis. We’ll start with the worst first. Five stocks in the index are down more than 90% this year: Carvana (CVNA), Opendoor (OPEN), Novavax (NVAX), Upstart (UPST), and Affirm (AFRM). Another eleven are down more than 80%, which includes names like Coinbase (COIN), Twilio (TWLO), Wayfair (W), Lucid (LCID), and Roku (ROKU).
Seventy-two percent of stocks in the Russell 1,000 are down YTD, but below are the names that have bucked the trend and gained the most. Just three stocks are up more than 100% YTD: Occidental Petroleum (OXY), Signify Health (SGFY), and Texas Pacific (TPL). Of the 38 names shown, 23 are from the Energy sector, with big names like Exxon Mobil (XOM), Chevron (CVX), and ConocoPhillips (COP) included. Exxon’s 78.8% YTD gain is easily its biggest annual move higher since at least 1980. Merck (MRK) is the biggest of the non-Energy stocks that made the list with a YTD gain of 49.8%. Click here to learn more about Bespoke’s premium stock market research service.

As always, past performance is no guarantee of future results.
Russell 1,000 Stocks Down the Most from All-Time Highs
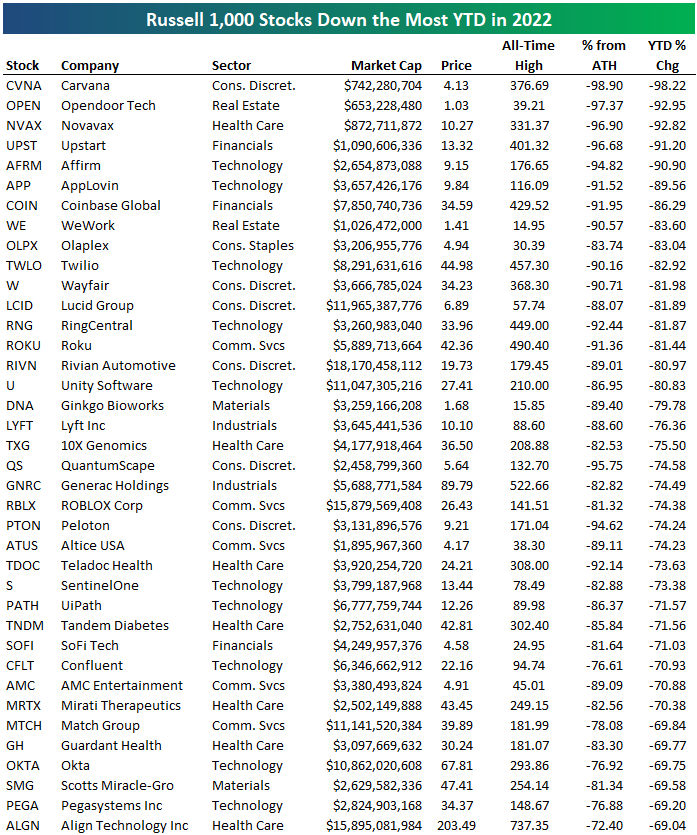
As we wrap up an awful year for the stock market, below we highlight a list of the current Russell 1,000 stocks that are the farthest below their all-time highs. For the index as a whole, the average stock is down 15.85% YTD on a total return basis, while the average stock’s price is about 38% below its all-time high.
About 30% of stocks in the Russell 1,000 are currently at least 50% below their all-time highs, while about 10% of index members are at least 75% below all-time highs. Below we list the 38 stocks that are all down at least 85% from their all-time highs and it includes Palantir’s (PLTR) 85.96% drop to Plug Power’s (PLUG) near evaporation of 99.2%. Most of these names have come down from all-time highs that were made at some point in 2021, although some like PLUG, AIG, and Citi (C) made highs a long time ago.
This list is a who’s who of stocks that got caught up in the post-COVID retail investor buying spree. A name like Carvana (CVNA) hit its all-time high of $376.69 relatively recently in August of last year. It’s at $4.13/share as of this morning. Upstart (UPST) traded above $400/share last October, and it’s at $13 and change now. Roku (ROKU) got up to $490.40 last summer and is at $42 now or more than a full decimal point to the left! Click here to learn more about Bespoke’s premium stock market research service.

As always, past performance is no guarantee of future results.
Bespoke’s Morning Lineup – 12/23/22 – Holiday Trading
See what’s driving market performance around the world in today’s Morning Lineup. Bespoke’s Morning Lineup is the best way to start your trading day. Read it now by starting a two-week trial to Bespoke Premium. CLICK HERE to learn more and start your trial.
“I put my heart and soul into my work, and I have lost my mind in the process.” – Vincent van Gogh
Below is a snippet of content from today’s Morning Lineup for Bespoke Premium members. Start a two-week trial to Bespoke Premium now to access the full report.
It’s the last trading day before Christmas, but a lot of people who make their living in the financial markets are probably feeling a little like van Gogh after this year. Hopefully, they all handle it better than the artist, though, and keep all of their appendages intact. We have another busy day of economic data in-store with Personal Income, Personal Spending, Michigan Confidence, and New Home Sales among the reports on the calendar. Equity futures are firmly in positive territory, crude oil is pushing $80 per barrel, and yields are higher with the 10-year yield trading back above 3.7%.
The last week of the year is considered a positive one for equities, but how positive has it been? Not as strong as you might think. Since 1980, the S&P 500’s average gain during the last week of December has been a gain of 0.41% with positive returns 57% of the time. Surprisingly, there have only been two other years during that span where the S&P 500 was down more than 15% YTD heading into the last week of the year (this year will be the third). In those two years, performance in the final week was mixed. In 2002, the S&P 500 went on to fall another 1.4% in the last week of the year; in 2008, the S&P 500 rallied 4.0%. So, just because the market is down a lot heading into the final week doesn’t necessarily mean it will bounce back or continue falling to close out the year.

Our Morning Lineup keeps readers on top of earnings data, economic news, global headlines, and market internals. We’re biased (of course!), but we think it’s the best and most helpful pre-market report in existence!
Start a two-week trial to Bespoke Premium to read today’s full Morning Lineup.
No Worse Year for Sentiment
The past few weeks had been uneventful when it comes to the AAII’s weekly reading on investor sentiment. As we noted last week, the three-week range that bullish sentiment occupied had reached a record low hovering between 24.3% and 24.7%. In the latest release, sentiment finally moved but not in the most promising direction. Bullish sentiment dropped 4 percentage points down to 20.3% this week to make for the lowest reading since the end of September.

With a decline in neutral sentiment as well, all of the increase went to bears with that reading rising to the highest level and back above 50% for the first time since late October.

As a result of the large inverse moves of the two sentiment readings, the bull-bear spread shows a dramatic tilt towards an even more pessimistic bias with bears outnumbering bulls by 32 percentage points. That is the widest spread since the week of October 20th and lower than most of the past decade’s range.

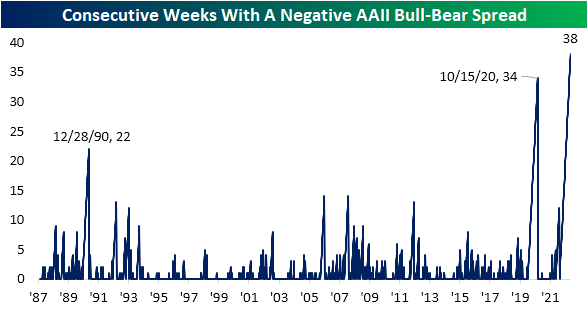
With yet another week of bears outnumbering bulls, the record streak of negative readings in the bull-bear spread has grown to 38 weeks long; a full month longer than the previous record ending in October 2020. Historically, investor sentiment has acted as a contrarian indicator meaning low readings on optimism have typically been followed by stronger returns for the S&P 500. This time around, sentiment and prices have given each other little reason to turn around.
In an earlier post, we noted how there has not even been a single week this year in which bullish sentiment has been above the historical average of 37.6%. Taking another look at just how depressed sentiment has been, the average bullish sentiment reading in 2022 has been less than 25%. The only years that had come close to such a low reading were 1988 (27.29%) and 1990 (27.08%). Playing into that low average has been the fact that there have been a record 30 weeks this year with bullish sentiment coming in below 25%. Meanwhile, bearish sentiment has averaged 46.17% this year, slightly above the previous record of 45.2% in 2008. With bearish sentiment tipping back above 50% once again this week, there have now been 17 weeks with such an elevated reading, tying the record from 2008 with one week to go. Click here to learn more about Bespoke’s premium stock market research service.

Malaise Among Individual Investors
The misery of 2022 has continued when it comes to investor sentiment. In the latest weekly AAII poll, bullish sentiment declined from 24.3% down to 20.3%. That’s the lowest reading since the end of September and less than five points above the YTD low of 15.8% from mid-April.

As shown in the chart above, there hasn’t been a single week this year where bullish sentiment has been above its historical average of 37.6%, and the only week where sentiment was even close to its historical average was at the start of the year. With just one week left in the year, barring a historic one-week surge, 2022 will go down as the first year in the history of the AAII survey where there wasn’t a single week that bullish sentiment was above average. Talk about malaise. Click here to learn more about Bespoke’s premium stock market research service.

Bespoke’s Morning Lineup – 12/22/22 – Back to Normal
See what’s driving market performance around the world in today’s Morning Lineup. Bespoke’s Morning Lineup is the best way to start your trading day. Read it now by starting a two-week trial to Bespoke Premium. CLICK HERE to learn more and start your trial.
“Make a game plan and stick to it. Unless it’s not working.” – Yogi Berra
Below is a snippet of content from today’s Morning Lineup for Bespoke Premium members. Start a two-week trial to Bespoke Premium now to access the full report.
Today is looking like a back-to-normal 2022 day for US stocks as futures are trading lower. The gains were fun while they lasted. Looking on the bright side, there are only five trading days left in the year. Elsewhere in markets, the 10-year yield is down slightly to 3.65% while oil has been quietly rallying and is now just under $80 per barrel.
The economic calendar is busy today as many reporting agencies try to squeeze in this month’s reports before Christmas. Data released so far hasn’t been particularly market-friendly as revised GDP came in higher than expected (3.2% vs 2.9%) and Core PCE was revised higher (4.7% vs 4.6%). Jobless claims were also strong with initial claims coming in lower than expected (216K vs 222K) and continuing claims also coming in slightly better than expected (1,672K vs 1,675K). If they were to have any impact on Fed policy, none of these reports would suggest less of a hawkish stance.
The more things change, the more they stay the same. Even after two days of gains, sector performance over the last five trading days has been pretty poor and almost exactly in line with performance rankings on a YTD basis. As shown in the scatter chart below which compares YTD performance versus the last week, there has been a clear correlation between the two with an r-squared of 0.78. Heading into year-end, investors are following the game plan of selling their losers and buying the few winners.

Looking at a snapshot from our Trend Analyzer, four of the S&P 500’s eleven sectors are down over 4% in the last week, another four are down more than 2%, two are down over 1%, and only Energy is higher. In terms of where sectors are now trading with respect to their trading ranges, there’s still pretty much of an even split between sectors trading above and below their 50-day moving average with six above and five below. Consumer Discretionary is the only sector in oversold territory. While that may seem like an ominous sign heading into the Christmas season, it’s worth remembering that retailers usually underperform at this time of year. Also, Tesla (TSLA) makes up about 13% of the sector, so the stock’s weakness has been a drag on the overall sector.

Our Morning Lineup keeps readers on top of earnings data, economic news, global headlines, and market internals. We’re biased (of course!), but we think it’s the best and most helpful pre-market report in existence!
Start a two-week trial to Bespoke Premium to read today’s full Morning Lineup.