Bespoke’s Morning Lineup — Early Misses — 1/19/23
See what’s driving market performance around the world in today’s Morning Lineup. Bespoke’s Morning Lineup is the best way to start your trading day. Read it now by starting a two-week trial to Bespoke Premium. CLICK HERE to learn more and start your trial.
“Be brutally honest about the short term and optimistic and confident about the long term.” – Reed Hastings

Below is a snippet of content from today’s Morning Lineup for Bespoke Premium members. Start a two-week trial to Bespoke Premium now to access the full report.
We continue to follow closely an emerging trend of “misses” when it comes to companies that have reported earnings so far this season.
In the year leading up to the current earnings season that began last week, our Earnings Explorer shows 8,424 individual quarterly earnings reports. Of those 8,424 reports, 67% reported EPS that were better than consensus analyst expectations, while 70% reported sales that were better than expected. So far this season, which began last Monday, we’ve seen just 40% of companies beat consensus EPS estimates and just 34% beat consensus sales expectations.
It’s still very early in the reporting period, but so far it looks like analysts — who were already cutting estimates at a rapid pace leading up to this earnings season — may not have cut forecasts enough.
By the end of next week when another 200+ companies will have reported, we’ll have a much firmer look at where beat rates stand this season. Below is a look at the rolling 3-month average of beat rates for both EPS and sales throughout the history of our Earnings Explorer.
After COVID hit, beat rates initially skyrocketed as analysts became overly pessimistic, but we’ve seen downside mean reversion in beat rates for the last 18 months or so. Based on early trends, we could see a return down to the long-term average this quarter, or even a move below average. Over the last 22 years going back to 2001, 59.4% of stocks reporting have beaten EPS estimates, while 56.45% have beaten revenue estimates. As mentioned earlier, we’ve seen a 40% beat rate for EPS so far this season and a 34% beat rate for revenues. We’d note that the only time we saw EPS beat rates fall to the low 50s over a three-month period was in Q1 2009 near the depths of the Financial Crisis lows.

Continue reading today’s Morning Lineup with a new Bespoke Premium trial.
Our Morning Lineup keeps readers on top of earnings data, economic news, global headlines, and market internals. We’re biased (of course!), but we think it’s the best and most helpful pre-market report in existence!
Start a two-week trial to Bespoke Premium to read today’s full Morning Lineup.
Is the Surge in Purchases and Refis Believable?
Early this morning, the weekly release of mortgage purchases and refinance applications from the Mortgage Bankers Association posted outright impressive week-over-week increases for both metrics. Beginning with a look at purchases, the reading surged almost 25% week over week for the highest reading in the index since 9/23. Even though that was a massive move higher, the purchases index remains at the low end of the past several year’s range and would be only slightly better than those readings observed in the spring of 2020.
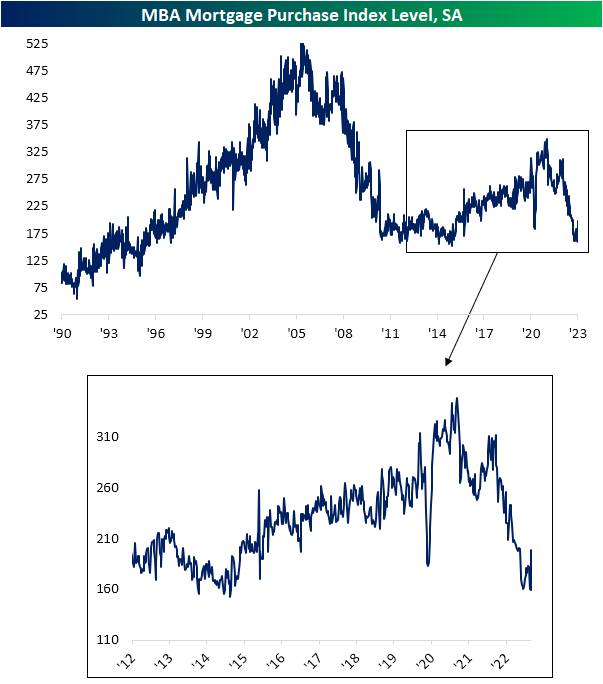
Refinance applications have been at some of the lowest levels in more than 20 years, and that continues to be the case even after rising well over 30% versus last week. Similar to purchases, that massive increase only brings refis back up to levels last seen in September.
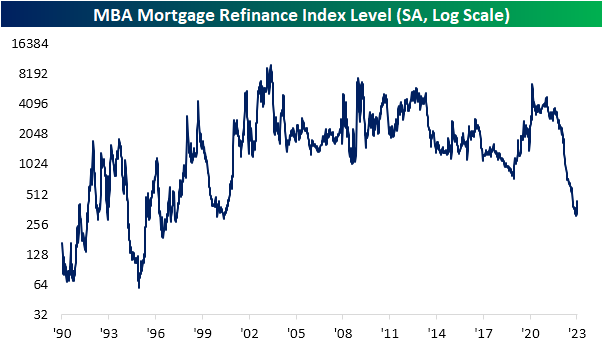
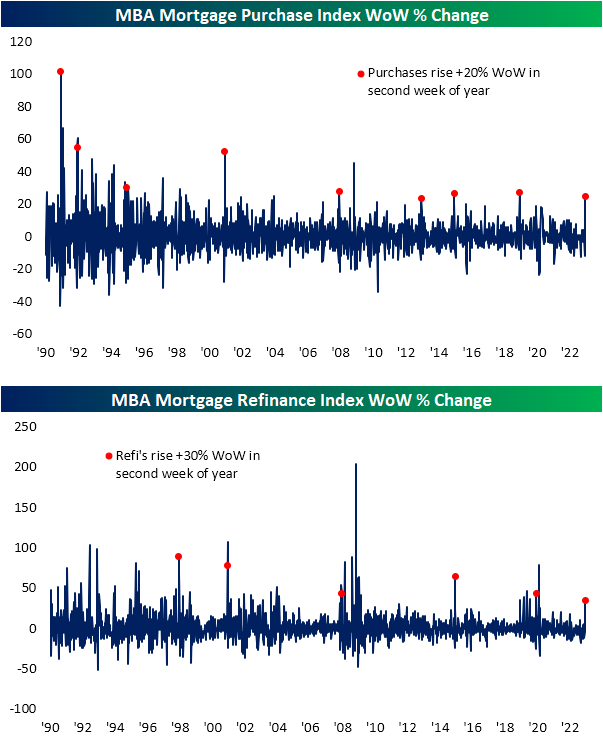
While a portion of those large improvements could potentially be the result of mortgage rates dropping to some of the lowest levels in the past few months, seasonality appears to be another and more plausible factor. Likely as a result of backlogs built up during the holidays, the second week of the year has plenty of precedent for outlier-like jumps in applications. As shown below, multiple times since the early 1990s the second week of the year has seen mortgage and refinance applications rise by at least 20% and 30% week over week, respectively. In other words, even if the surge in mortgage applications is eye-catching, we would caution against jumping to the conclusion that these increases are material without further follow-through in the weeks to come. Click here to learn more about Bespoke’s premium stock market research service.
Bespoke Morning Lineup — 1/18/23
See what’s driving market performance around the world in today’s Morning Lineup. Bespoke’s Morning Lineup is the best way to start your trading day. Read it now by starting a two-week trial to Bespoke Premium. CLICK HERE to learn more and start your trial.
“It seems like people don’t learn from the past.” – Thomas Peterffy
Below is a snippet of content from today’s Morning Lineup for Bespoke Premium members. Start a two-week trial to Bespoke Premium now to access the full report.
Earnings so far this week have been pretty negative, with 10 of the 16 stocks that have reported missing EPS estimates. We won’t get a good read on things until next week when the pace of reports picks up dramatically, but it’s not common to see more EPS misses than beats.

As we highlighted in last night’s Closer, the iShares Europe ETF (IEV) has outperformed the S&P 500 (SPY) over the last three months by the widest margin on record since IEV began trading in 2000. European equities are trading slightly higher once again this morning along with US futures.

As shown below, the charts for European and other international index ETFs now look drastically different than those of the S&P (SPY) and the Nasdaq 100 (QQQ). While SPY and QQQ have yet to break out of long-term downtrends, Europe (IEV, FEZ), emerging markets (EEM), and the all world ex-US ETF (CWI) have formed new uptrends as they break out to six-month highs.

Continue reading today’s Morning Lineup with a new Bespoke Premium trial.
Our Morning Lineup keeps readers on top of earnings data, economic news, global headlines, and market internals. We’re biased (of course!), but we think it’s the best and most helpful pre-market report in existence!
Start a two-week trial to Bespoke Premium to read today’s full Morning Lineup.
Bespoke’s Morning Lineup — 1/17/23
See what’s driving market performance around the world in today’s Morning Lineup. Bespoke’s Morning Lineup is the best way to start your trading day. Read it now by starting a two-week trial to Bespoke Premium. CLICK HERE to learn more and start your trial.
“Every once in awhile, you do have a bad day.” – Adam Vinatieri, retired placekicker who holds the NFL career points record.
Below is a snippet of content from today’s Morning Lineup for Bespoke Premium members. Start a two-week trial to Bespoke Premium now to access the full report.
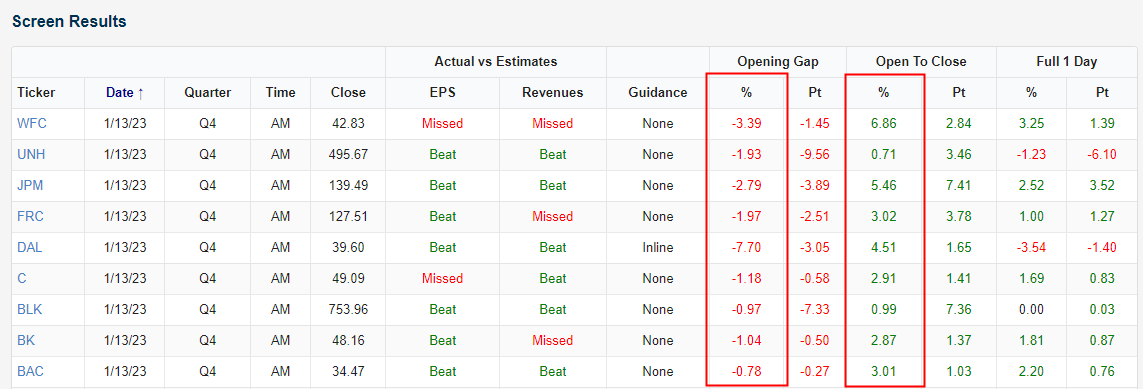
In Friday’s Morning Lineup, we noted the weak pre-market action in stocks that had just reported earnings. A number of key banks and brokers reported Q4 earnings on Friday and initially sold off on the news ahead of the open. But we actually saw nice intraday reversals once the opening bell rang.
Amazingly, of the nine stocks that reported earnings on Friday morning, all nine opened lower when trading began at 9:30 AM ET, and all nine also traded higher intraday from the open to the close. It’s rare to see such a big intraday turnaround across the board.
We’ll be monitoring earnings results closely over the next month or so, but so far since the new year began, numbers have been solid. As shown in the snapshot from our Earnings Explorer, 71% of companies have beaten EPS estimates to start 2023, while 67% have beaten sales estimates. The average stock that has reported has gained 1.31% on its earnings reaction day as well.

This morning both Goldman Sachs (GS) and Morgan Stanley (MS) reported their quarterly numbers, and of the two, MS had the stronger report with a nice revenue beat. Goldman, on the other hand, missed sales expectations due to weakness in investment banking and asset management. The stock is currently trading down 2.4% in pre-market trading. That’s an anomaly for Goldman actually, which has managed to open higher on nine of its last ten earnings reports. The only other time Goldman has opened lower on earnings since mid-2020 was following its January report last year when it gapped down 5.49% at the open. That day the stock continued lower by another 1.57% from the open to the close of trading.

Continue reading today’s Morning Lineup with a new Bespoke Premium trial.
Our Morning Lineup keeps readers on top of earnings data, economic news, global headlines, and market internals. We’re biased (of course!), but we think it’s the best and most helpful pre-market report in existence!
Start a two-week trial to Bespoke Premium to read today’s full Morning Lineup.
Bespoke Brunch Reads: 1/15/23
Welcome to Bespoke Brunch Reads — a linkfest of the favorite things we read over the past week. The links are mostly market related, but there are some other interesting subjects covered as well. We hope you enjoy the food for thought as a supplement to the research we provide you during the week.
While you’re here, join Bespoke Premium with a 30-day trial!
Energy Markets
Winter Storm Elliott (PJM)
A detailed slide deck offering preliminary explanations for the collapse of most of the East Coast’s electrical grid offers some fascinating insight: an unprecedented demand surge came as a wide range of natural gas generators shut off amidst shortages of fuel. [Link; 32 page PDF]
U.S. Department of Energy rejects initial bids to resupply oil stockpile by Richard Valdmanis (Reuters)
A first round of bids to replace crude sold from the SPR has been rejected by the Department of Energy as the government fine-tunes its procedures for the unprecedented management of crude markets that sales and purchases have entailed. [Link]
Vaporware
US farmers win right to repair John Deere equipment by Monica Miller (BBC)
A memorandum of understanding between John Deere and the American Farm Bureau Federation has cleared the way for farmers to repair equipment that breaks down. [Link]
Exclusive: Surveillance Footage of Tesla Crash On SF’s Bay Bridge Hours After Elon Musk Announces “Self-Driving” Feature by Ken Klippenstein (The Intercept)
A Tesla that was using the “Full Self-Driving” feature enabled by Tesla this fall caused a major pile-up on a San Francisco freeway when it abruptly braked and moved in to another lane. [Link]
Food & Drink
Digital nomads now come first for Mexico City’s gig workers by Samuel Burleigh and Stpehania Corpi Arnaud (Rest of World)
Lured by the lower cost of living and high quality amenities that elite enclaves offer within Mexico City, foreign digital nomads are making waves with their bland tastes. [Link]
A Nonalcoholic Amaro ‘Falso’ From St. Agrestis by Florence Fabricant (NYT)
The latest offering for dry January is a zero-ABV “amaro” that mixes bitter botanicals and a hint of carbonation to replace the alcoholic version. [Link; soft paywall]
Banking
JPMorgan claims entrepreneur Charlie Javice duped bank into buying $175M startup: suit by Ariel Zilber (NYPost)
A financial planning site purchased by JPMorgan in 2021 overstated its customer count by almost 4mm, defrauding the bank in the course of its acquisition. [Link]
Goldman Sachs Advises Investors To Go Risk-Free In 2023 by Tracey Longo (Financial Advisor Magazine)
High yields in money market funds are stiff competition for risk assets per a Goldman Sachs analysis that advocates for skepticism towards risk assets this despite a torrid start to the year. [Link]
Chinese Bank Offers Customers Free mRNA Vaccine in Return for $500,000 Deposit (Bloomberg)
“Tier 3” customers get the luxury treatment, including not only top-of-the-line COVID vaccines but also discounts at the Four Seasons a chance to test drive a Bentley. [Link]
Solutions
The ozone layer is on track to recover within decades as harmful chemicals are phased out, scientists report by Laura Paddison (CNN)
An international treaty has led to a 99% decline in the use of chemicals that deplete the ozone layer has been wildly successful, with expectations for full recovery by 2040. The results offer a hopeful model for climate action, including via geoengineering. [Link]
Riddle solved: Why was Roman concrete so durable? by David L. Chandler (MIT News)
Roman concrete included chunks of calcium carbonate thanks to its high-temperature manufacturing process. The result was a much stronger concrete than anything produced today. [Link]
House of Mouse
Disney Revises Pricing Policies at Its Parks by Brooks Barnes (NYT)
Theme parks will cut parking fees and reduce the number of park days offered at their lowest price but management insists they aren’t a reflection of softer demand. [Link; soft paywall]
Options Mania
Higher Rates and Tech Selloff Fuel Options Boom by Eric Wallerstein (WSJ)
The surge in options activity during the huge post-COVID bull market is sticking around, as investors are finding the derivatives just as useful for speculation to the downside as the upside. [Link; paywall]
Read Bespoke’s most actionable market research by joining Bespoke Premium today! Get started here.
Have a great weekend!
The Bespoke Report – 1/13/23
This week’s Bespoke Report newsletter is now available for members. (Log in here if you’re already a subscriber.)
Since the start of Q4 last year we’ve seen a trend shift across a range of asset classes. Interest rates, the dollar, stocks, industrial metals, natural gas, and a range of other markets are moving in the opposite direction compared to most of last year. Some of this is down to luck – specifically related to the weather – but shifts from policymakers and economic data are also playing a major role. Despite trend shifts, US stocks have still not broken out. Earnings season is under way and could be the defining factor between whether bear market downtrends prevail or a new bull trend has been established.
View this week’s Bespoke Report newsletter by starting a one-month trial, or click the image below to view our membership options page.

Bespoke’s Morning Lineup – 1/13/23 – Bank Bummer
See what’s driving market performance around the world in today’s Morning Lineup. Bespoke’s Morning Lineup is the best way to start your trading day. Read it now by starting a two-week trial to Bespoke Premium. CLICK HERE to learn more and start your trial.
“We ended the year on a strong note growing earnings year over year in the 4th quarter in an increasingly slowing economic environment.” – Brian Moynihan
Below is a snippet of content from today’s Morning Lineup for Bespoke Premium members. Start a two-week trial to Bespoke Premium now to access the full report.
Earnings season has arrived, and it has made its presence known with a thud. Of the eight major reports this morning, all but two (Citigroup and Wells Fargo) beat EPS forecasts, and only two (Bank of New York and Wells Fargo) reported weaker-than-expected revenues. The results don’t appear good enough for investors, though. Six of the eight companies that reported are trading down in the pre-market, and the two trading higher (Bank of New York and BlackRock) have seen just muted gains. On the flip side, stocks trading lower in the pre-market have all declined at least 1%, while Wells Fargo and Delta head into the opening bell with declines of over 4%. Given the weak reactions to earnings, overall equity index futures are also weak and indicating a decline of nearly 1% at the open. Interestingly, despite the fact that none of the major reports have been related to technology, it’s the Nasdaq that is doing the worst in the pre-market with a decline of over 1%

The fact that these companies have seen their share prices initially react negatively to their reports is a bit of a letdown but remember that collectively they have performed well to start the year. Except for UNH, all the stocks are positive YTD with gains of at least 3.5%. Heading into this morning’s report, DAL had rallied more than 20% YTD, so a pullback in response to earnings is completely understandable. UNH, though, is another story. Through yesterday’s close, the stock was already down 6.5% YTD and in oversold territory, so the bar didn’t look especially high to begin with.

Our Morning Lineup keeps readers on top of earnings data, economic news, global headlines, and market internals. We’re biased (of course!), but we think it’s the best and most helpful pre-market report in existence!
Start a two-week trial to Bespoke Premium to read today’s full Morning Lineup.
The Bespoke 50 Growth Stocks — 1/12/23
The “Bespoke 50” is a basket of noteworthy growth stocks in the Russell 3,000. To make the list, a stock must have strong earnings growth prospects along with an attractive price chart based on Bespoke’s analysis. The Bespoke 50 is updated weekly on Thursday unless otherwise noted. There were twelve changes to the list this week.
The Bespoke 50 is available with a Bespoke Premium subscription or a Bespoke Institutional subscription. You can learn more about our subscription offerings at our Membership Options page, or simply start a two-week trial at our sign-up page.
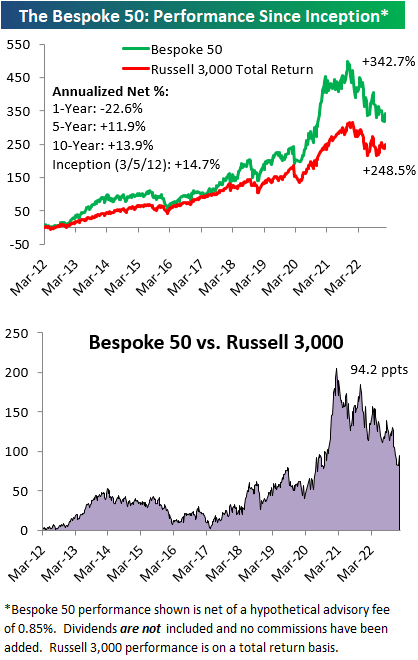
The Bespoke 50 performance chart shown does not represent actual investment results. The Bespoke 50 is updated weekly on Thursday. Performance is based on equally weighting each of the 50 stocks (2% each) and is calculated using each stock’s opening price as of Friday morning each week. Entry prices and exit prices used for stocks that are added or removed from the Bespoke 50 are based on Friday’s opening price. Any potential commissions, brokerage fees, or dividends are not included in the Bespoke 50 performance calculation, but the performance shown is net of a hypothetical annual advisory fee of 0.85%. Performance tracking for the Bespoke 50 and the Russell 3,000 total return index begins on March 5th, 2012 when the Bespoke 50 was first published. Past performance is not a guarantee of future results. The Bespoke 50 is meant to be an idea generator for investors and not a recommendation to buy or sell any specific securities. It is not personalized advice because it in no way takes into account an investor’s individual needs. As always, investors should conduct their own research when buying or selling individual securities. Click here to read our full disclosure on hypothetical performance tracking. Bespoke representatives or wealth management clients may have positions in securities discussed or mentioned in its published content.
Bears Back Down
The S&P 500 has rallied impressively in the past week leading up to Thursday’s CPI print, and bullish sentiment has lifted along with it. While the reading remains low, the percentage of respondents to the weekly AAII sentiment survey reporting as bullish rose from 20.5% up to 24%. Bulls were higher only two weeks ago when the reading was at 26.5%

That rise in bulls has meant bearish sentiment has fallen to a notable level. For the first time since the first week of November and for only the eleventh time in the past year, bearish sentiment came in below 40%. Bearish sentiment has now fallen for three weeks in a row, which is the longest streak of consecutive declines since last August as well.

Although bullish and bearish sentiment are sending a more optimistic tone, the bull-bear spread remains heavily in favor of bears at -15.9. That grows the record streak of negative readings to 41 weeks in a row.


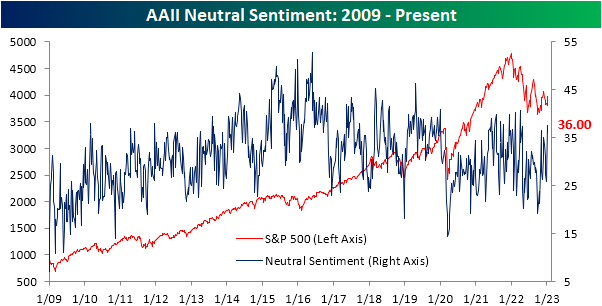
Last week, neutral sentiment leaped higher given the mid-single-digit declines in bulls and bears. Some of that move was given back this week with only 36% reporting as neutral. However, that remains an elevated reading at 4.6 percentage points above the historical average. Click here to learn more about Bespoke’s premium stock market research service.
Claims Drop But Were the Holidays Helping?
Initial jobless claims posted another low reading in the latest print, with national seasonally adjusted claims totaling only 205K. That was down slightly from 206K the previous week; a number revised up by 2K. After that revision, this week’s reading was the strongest showing for claims since the end of September.

Before seasonal adjustment, claims were considerably higher at 339.29K. At the end of the year and in the first weeks of a new year, claims tend to experience a significant seasonal increase which appears to be playing out in the current environment. This year’s reading is in line with the comparable weeks of the few years prior to the pandemic. As we also noted last week, this time of year tends to see the largest revisions in claims as well. In other words, from a seasonal perspective, claims can be a bit volatile in terms of actual levels and revised levels. So while the seasonally adjusted reading was solid and the non-seasonally adjusted number is nothing too concerning, the next several weeks will likely provide a clearer reading on how claims are trending.

Turning to continuing claims, this week’s print covered the final week of 2022. Like initial claims, the end of the year saw declines in continuing claims with the latest reading falling to a low of 1.634 million; the strongest level since the week of November 19th. Although that is a solid improvement following multiple months of claims rising rapidly, similary to initial claims, more weeks of data will help to provide a clearer picture given the effects of seasonality during the holidays.

We would also note, that although the drop in claims over the past two weeks has only put a small dent in the recent rise in claims, the 4.89% decline is historically large. That drop impressively ranks in the bottom 3% of all 2-week moves on record. Click here to learn more about Bespoke’s premium stock market research service.
