B.I.G. Tips – Consistently Overbought Readings
Dow 29,000?
By posting this, we’re probably jinxing it, but the DJIA is on the verge of topping another 1,000 point threshold less than two months after first topping 28,000. While the media makes a big deal of each of these thresholds, we would note that the road to 29,000 from 28,000 is only 3.4%. That’s hardly a momentous move. Since Trump became President in January 2017, though, 29,000 would be the 10th 1,000-point threshold that the DJIA would cross under his watch.
The table below lists the date that the DJIA first crossed each 1,000-point threshold throughout history. For each level, we also include the number of calendar days that elapsed between the first cross of that threshold and the prior one, how large a percentage gain that the 1000-point threshold represents versus the prior one, and then how many times the DJIA has crossed each threshold (on a closing basis) both to the upside and downside. One of the most notable aspects of the table in our view is that even though each threshold is a smaller percentage than the prior one, there have been so few crosses (above and below) of most of the thresholds since the Dow first crossed 19,000 after the 2016 election. 19,000 was only crossed once, and six of the other nine thresholds since then haven’t been crossed more than ten times. That’s indicative of a market that has been rallying and not looking back. Start a two-week free trial to Bespoke Institutional for full access to our research platform.

Bespoke’s Morning Lineup – 1/10/20 – Jobs Friday
See what’s driving market performance around the world in today’s Morning Lineup. Bespoke’s Morning Lineup is the best way to start your trading day. Read it now by starting a two-week free trial to Bespoke Premium. CLICK HERE to learn more and start your free trial.

At its October meeting on 10/30, Fed chair Powell noted that “a significant inflation rise would be needed before any rate hike,” and ever since then markets have been in rally mode as even strong economic data hasn’t been taken as a signal that the FOMC would start to tighten policy. A perfect example is the monthly jobs report. As shown in the table below, on the day of the three Non-Farm Payrolls reports since the FOMC essentially took itself out of the picture, the S&P 500 has been up at least 0.90%. That’s quite a streak. The last time we saw three straight gains of 0.90%+ on the day of employment reports was back in July 2013 and going back to 1998, there have only been four other three-month streaks of 0.9%+.

The Closer – Credit Trades Tight, Repo Uptake, Inventory Outlook, Auction Update – 1/9/20
Log-in here if you’re a member with access to the Closer.
Looking for deeper insight on markets? In tonight’s Closer sent to Bespoke Institutional clients, we provide an update on what credit spreads are showing on the health of the economy as well as the Fed’s activity in the repo market. Next we take a look at the Department of Transportation’s freight volumes data then we show the results of today’s 30 year UST bond auction. We finish with an update on consumer comfort.

See today’s post-market Closer and everything else Bespoke publishes by starting a 14-day free trial to Bespoke Institutional today!
Bespoke’s Sector Snapshot — 1/9/19
Bespoke’s Consumer Pulse Report – January 2020
Bespoke’s Consumer Pulse Report is an analysis of a huge consumer survey that we run each month. Our goal with this survey is to track trends across the economic and financial landscape in the US. Using the results from our proprietary monthly survey, we dissect and analyze all of the data and publish the Consumer Pulse Report, which we sell access to on a subscription basis. Sign up for a 30-day free trial to our Bespoke Consumer Pulse subscription service. With a trial, you’ll get coverage of consumer electronics, social media, streaming media, retail, autos, and much more. The report also has numerous proprietary US economic data points that are extremely timely and useful for investors.
We’ve just released our most recent monthly report to Pulse subscribers, and it’s definitely worth the read if you’re curious about the health of the consumer in the current market environment. Start a 30-day free trial for a full breakdown of all of our proprietary Pulse economic indicators.

December Employment Report Preview
After several weeks where employment-related data was mixed relative to expectations, we’ve begun to see some signs of improvement as jobless claims have edged back down. Even with that improvement, though, there have still been some mixed signals. Those mixed signals haven’t resulted in a lot of angst on the part of the market heading into the report, though. That’s because recession fears mostly seem to be in the rearview mirror, and the Fed has basically taken itself out of the picture regarding any potential hikes.
Heading into tomorrow’s Non-Farm Payrolls report, economists are expecting an increase in payrolls of 160K, which would be a 106K decline from November’s blockbuster reading of 266K. In the private sector, economists are expecting a similar decline from 254K down to 153K. Job growth in the manufacturing sector is expected to decline from 54K down to 5K. Even with the expected big decline in Non-Farm Payrolls, the Unemployment Rate is expected to stay unchanged at 3.5% while average hourly earnings are forecast to increase 0.3% compared to November’s reading of 34.4.

Ahead of the report, we just published our eleven-page preview of the December jobs report. This report contains a ton of analysis related to how the equity market has historically reacted to the monthly jobs report, as well as how secondary employment-related indicators we track looked in December. We also include a breakdown of how the initial reading for December typically comes in relative to expectations and how that ranks versus other months.
For anyone with more than a passing interest in how equities are impacted by economic data, this December employment report preview is a must-read. To see the report, sign up for a monthly Bespoke Premium membership now!
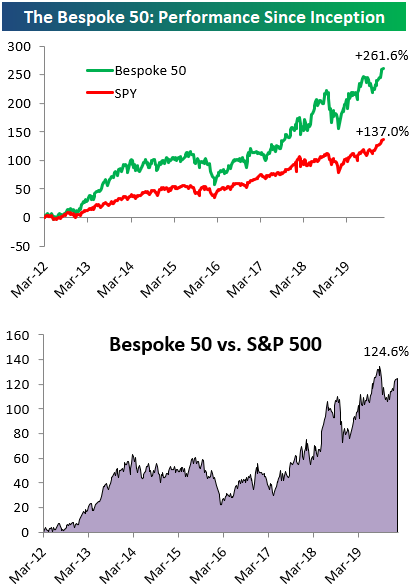
The Bespoke 50 Top Growth Stocks — 1/9/20
Every Thursday, Bespoke publishes its “Bespoke 50” list of top growth stocks in the Russell 3,000. Our “Bespoke 50” portfolio is made up of the 50 stocks that fit a proprietary growth screen that we created a number of years ago. Since inception in early 2012, the “Bespoke 50” has beaten the S&P 500 by 124.6 percentage points. Through today, the “Bespoke 50” is up 261.6% since inception versus the S&P 500’s gain of 137.0%. Always remember, though, that past performance is no guarantee of future returns. To view our “Bespoke 50” list of top growth stocks, please start a two-week free trial to either Bespoke Premium or Bespoke Institutional.
Tesla (TSLA) Larger Than Ford (F) and General Motors (GM) Combined
Although the stock is down today following a number of analyst downgrades, Tesla (TSLA) has seen a significant run-up over the past several months and between record deliveries that topped expectations and announcing the introduction of its cars and Gigafactory in China the company has already had an eventful 2020. Since the start of the fourth quarter of 2019, TSLA has far outperformed other US automakers. In fact, while Ford (F) is only up 0.49% and General Motors (GM) is down 7.66%, Tesla has doubled. Yesterday, the stock nearly joined a baker’s dozen of other S&P 500 stocks priced at $500 or more.

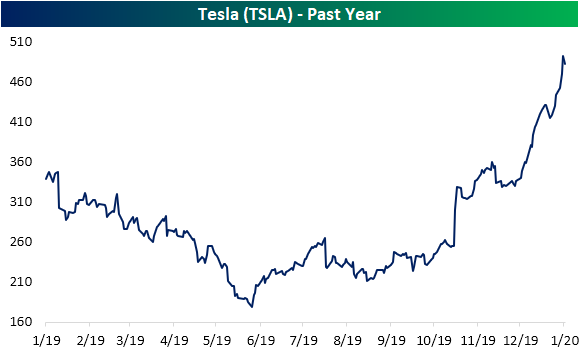
Those are not the only milestones though. About one month ago, we had highlighted that the market cap of TSLA had distanced itself from those of Ford (F) and GM (GM) by some of the widest margins on record. With the stock surging further since then, TSLA is now valued at $86.9 billion. That makes the company not only the largest US automaker by market cap, but it is also about $1 billion larger than the combined market caps of Ford ($36.5 bn) and GM ($49.5 bn). Of other global automakers, only Volkswagen has a larger dollar-adjusted market cap of $98.26 billion while TSLA is still dwarfed by Toyota which has a market cap of $226.96 bn. Start a two-week free trial to Bespoke Institutional to access our interactive economic indicators monitor and much more.

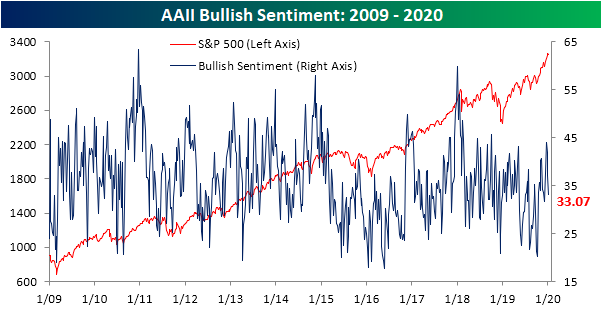
Sentiment Moderates
Over the past week, mounting geopolitical tensions have kept markets on their toes. As of today, equity markets have recovered whatever losses there were, but sentiment has still taken a hit. The percentage of bullish investors in the weekly AAII survey has fallen for a third straight week down to 33.07%. This is the lowest level of bullish sentiment since the first week of December when 31.72% of respondents were bullish. Granted, these declines have not brought bullish sentiment to any sort of extremely low level. In fact, it is now just about in line with the average reading of the past year, 33.41%. If anything, this move appears to be mean reversion as bullish sentiment headed into 2020 had actually gotten pretty extended as we had highlighted in our Pros and Cons report last week.
While most of the decline in bullish sentiment in last week’s survey went toward neutral sentiment, this week’s results showed that investors were more firmly bearish borrowing from both the bullish and neutral camps. Nearly 30% of investors reported as bearish this week which was an 8.01 percentage point increase from last week. That marked the third-largest one week jump in bearish sentiment of the past year. Granted, this increase was also about a third and half the size, respectively, of the past two larger increases of 24.14 percentage points in August and 16.11 percentage points in May. Despite the relatively large move higher, bearish sentiment is now right in line with its average of 30.3% over the past year.

As previously mentioned, the gain in bearish sentiment took from those previously reporting as neutral. After reaching 40.91% last week, the highest level since Apri, neutral sentiment has moderated falling down to 37.04%.Start a two-week free trial to Bespoke Institutional to access our interactive economic indicators monitor and much more.
