Ugliest Economic Data Day of All Time?
It has been a pretty quiet week of economic data so far, but the week closes out on a busy and what will ultimately be an ugly note. Reports on the calendar for tomorrow include Retail Sales, Industrial Production, and Capacity Utilization, which all cover the month of April. In addition to those reports, data for May includes Empire Manufacturing and preliminary Michigan Confidence. April was the peak period of the economic shutdowns, and the data will highlight that. Retail sales is expected to show its largest m/m declines on record (dating back to 1990), building on already weak readings from March. The history for Industrial Production goes all the way back to 1920, and even with 100 years of data (including the Great Depression), there has never been another month where it saw a larger m/m decline at least based on current estimates. Likewise, data for Capacity Utilization goes back to WWII, and that too will likely be the weakest on record. With all the weak hard data, it’s somewhat surprising to see that Michigan Confidence is only expected to fall to its lowest level since 2011. In any other time, a nine-year low reading in an economic indicator would be notable enough, but in the midst of a global pandemic, it’s peanuts. Start a free trial to Bespoke’s premium platform for full access to our stock market analysis and interactive tools.
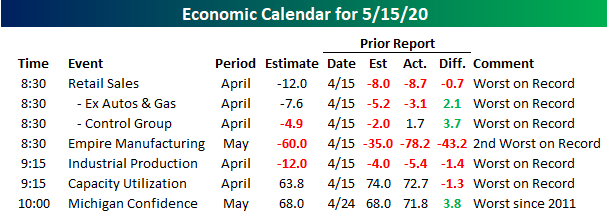
Chart of the Day: Capex Cutbacks
The Bespoke 50 Top Growth Stocks — 5/14/20
Every Thursday, Bespoke publishes its “Bespoke 50” list of top growth stocks in the Russell 3,000. Our “Bespoke 50” portfolio is made up of the 50 stocks that fit a proprietary growth screen that we created a number of years ago. Since inception in early 2012, the “Bespoke 50” has beaten the S&P 500 by 123.2 percentage points. Through today, the “Bespoke 50” is up 224.9% since inception versus the S&P 500’s gain of 101.7%. Always remember, though, that past performance is no guarantee of future returns. To view our “Bespoke 50” list of top growth stocks, please start a two-week free trial to either Bespoke Premium or Bespoke Institutional.

Investors Remain On Guard
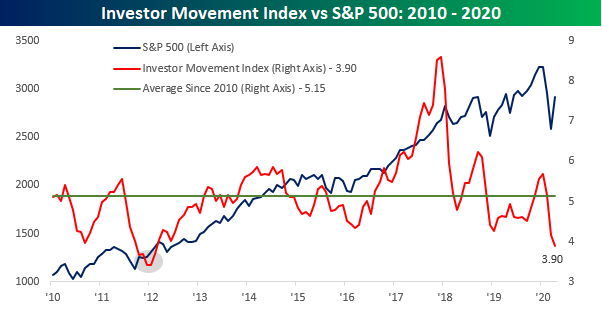
In a post earlier today, we noted that individual investors still remain overwhelmingly bearish despite the equity market’s rally off the March lows. Another sentiment indicator released by TD Ameritrade supports this view that investors aren’t particularly bullish right now. The TD Ameritrade Investor Movement Index is a proprietary, behavior-based index created by TD Ameritrade designed to indicate the sentiment of individual investors’ portfolios. It measures what investors are actually doing, and how they are actually positioned in the markets.
The TD Ameritrade Investor Movement Index has been in existence since 2010, and in that entire history there have only been five months where the index was weaker than it is now, and that was from October 2011 through February 2012. That was also a period that marked a major low in the equity market and was followed by a nearly uninterrupted three-year rally in the S&P 500.
While the Investor Movement Index is near record lows right now, it has been weak for some time, and that weakness came even as the S&P 500 was climbing to record highs over the last 12-18 months. In other words, while investors are just about as cautious as they have been at any time in the last ten years, this conservatism is nothing new. Start a two-week free trial to Bespoke Institutional for full access to our analysis and interactive tools.
Sentiment Still Sits Bearish
In last Thursday’s Chart of the Day, we noted that for the first time in a decade less than a quarter of respondents were bullish or neutral while over half were bearish. Although that isn’t exactly the case again this week, sentiment still leans heavily bearish. Bullish sentiment dropped down further to 23.31% from 23.67% last week. That is the lowest level of bullish sentiment since the COVID-19 pandemic began and the lowest number since last October when the percentage of investors reporting as bullish bottomed out at 20.31%.

The move out of the bullish camp didn’t exactly flow into the bearish camp, though. Bearish sentiment likewise fell slightly this week from 52.66% to 50.61%. Although that is slightly lower, the majority of those surveyed are still bearish.

Simply put, bearish sentiment has been high for a long time. Of the previously mentioned past ten weeks, even if bearish sentiment was not above 50% it was at least one standard deviation above its historical average. That now ranks as the longest streak since 2008 (14 weeks) and the fourth-longest in the history of the survey daying back to 1987.

With such a large divergence between bulls and bears, the bull-bear spread now stands at -27.3 which is slightly better than the -28.99 reading last week but still clearly at the low end of the past decade’s readings. Start a two-week free trial to Bespoke Institutional to access our interactive economic indicators monitor and much more.

Sixth Straight Decline In Claims
This week was another ugly one for jobless claims, although the weekly trend is moving in the right direction. While the 2.981 million print was significantly higher than estimates of 2.5 million, this week marked the sixth in a row that claims were down week-over-week. This week also marked the first sub-3 million print and the lowest number since claims first spiked in the week ending March 20th. While the slowed pace of claims is an improvement, this was a smaller WoW decline compared to the past several weeks. Additionally, with another 2.981 million added this week, the grand total of jobless claims since that March 20th print now sits at nearly 36.5 million, or roughly 11% of the entire US population.

As shown in the chart below, the streak of WoW declines over the past six weeks is now tied for the second longest such streak on record. Back in 2016, 2009, 1994, and 1993 were the last times that claims had fallen for six straight weeks, and there have only been two other periods where claims fell for longer: 2013 and another in 1980. Both of those streaks ended at seven weeks.

As for non-seasonally adjusted claims the same story holds true. The drop to 2.614 million this week was the fifth consecutive weekly decline and the lowest print since the initial spike in claims in late March.

With another lower print, the four-week moving average has also continued to decline. That measure has now declined for three straight weeks to its current level of 3.617 million. Start a two-week free trial to Bespoke Institutional to access our interactive economic indicators monitor and much more.

Bespoke’s Morning Lineup – 5/14/20 – Narratives
See what’s driving market performance around the world in today’s Morning Lineup. Bespoke’s Morning Lineup is the best way to start your trading day. Read it now by starting a two-week free trial to Bespoke Premium. CLICK HERE to learn more and start your free trial.
It looks like it’s going to be another bad day for the bulls today. Futures have been deteriorating quickly this morning as jobless claims came in significantly higher than expected (2.98 million vs 2.5 million estimates). After a period of weeks where optimism over re-opening took the spotlight, sentiment has shifted to the idea that even as the economy re-opens, the road to recovery won’t be a smooth one.
Be sure to check out today’s Morning Lineup for a rundown of the latest stock-specific news of note, Japanese economic data, the latest global and national trends related to the COVID-19 outbreak, and much more.

After the second bad day in a row for US equities on Wednesday, all we’ve been hearing today is how Fed Chair Powell’s comments and David Tepper’s interview with CNBC regarding the market’s valuation were responsible for the decline. It sounds like a good explanation, but in the words of Warner Wolf, “Let’s go to the videotape.”
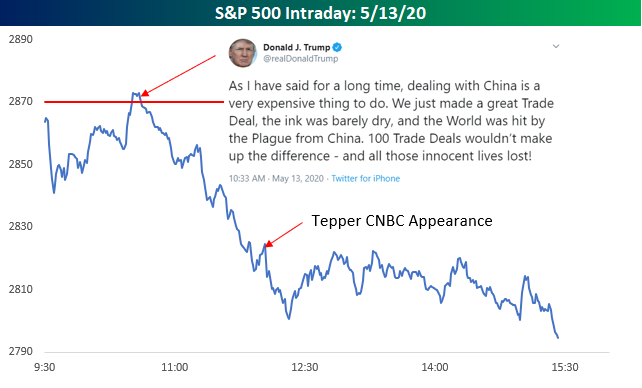
The chart below shows the S&P 500’s intraday performance on Wednesday. In looking at this chart, keep in mind that Powell’s speech started at 9:00 AM, or 30 minutes before the market open. With that in mind, we can see that the S&P 500 opened lower but rebounded in the first hour of trading. Within an hour of the open, however, the S&P 500 was actually up on the day.
The S&P 500’s time in the black didn’t last long, though, because, at 10:33 AM, the President tweeted some bellicose comments regarding China and the trade deal. At that point, the rally was stopped in its tracks, and the S&P 500 immediately moved lower. Tepper’s comments at noon didn’t help matters, but by the end of the day, the S&P 500 finished right where it was trading before Tepper appeared on CNBC.
In other words, even though yesterday’s declines were attributed to Powell and Tepper, the S&P 500 actually traded higher after Powell spoke and finished the day right where it was trading before Tepper made his comments regarding the market’s valuations. The most significant turning point of the morning, though, came right after President Trump tweeted about the China trade deal, but that has barely been mentioned as a catalyst for the decline.

Daily Sector Snapshot — 5/13/20
Chart of the Day: Decile Analysis After Back-to-Back 1%+ Declines
The Trump-Tepper One-Two Punch
What started out as a weak open for equities today started to show improvement early on. Just an hour after the open the S&P 500 was even up for a few minutes, but then the President sent out a tweet where he argued that “dealing with China is a very expensive thing to do.” He then went on to say that “100 Trade Deals wouldn’t make up the difference” for the “Plague from China.” The timing of this tweet was especially concerning as it comes just two days before the expiration of a 90-day enforcement provision of the trade deal on Friday. With that tweet, the equity market’s rally was stopped dead in its tracks as the S&P 500 sold-off for the rest of the morning.
By noon, the market was attempting to bounce, but then David Tepper came on CNBC to say that the current market was one of the most overvalued he has ever seen. That stopped any chance of a rebound and within minutes, the S&P 500 was at its lows of the day. Ever since then, the market has been trading sideways all afternoon, but with 45 minutes left in the trading day, we’ll see if those lunchtime lows can hold. Between Druckenmiller after the close yesterday, Trump this morning, and then Tepper at lunch, you can’t fault the market for acting a little punch drunk. Start a two-week free trial to Bespoke Institutional for full access to our research and interactive tools.