Daily Sector Snapshot — 5/5/20
Chart of the Day: Off the Shelf Indicators – Google Search Trends
Bespoke Stock Scores — 5/5/20
ISM Collapse All Around
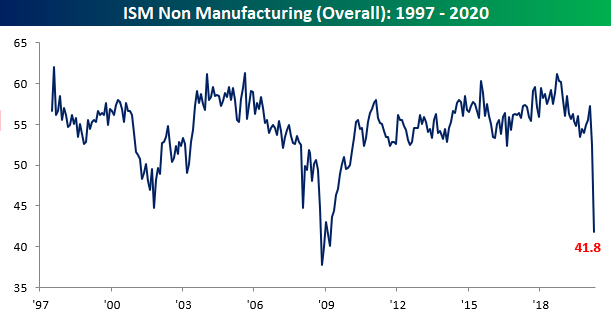
While the results for ISM’s Non-Manufacturing index for the month of April were better than expected (the index was forecasted to come in at 38), the index fell 10.7 points from March down to 41.8. That is the fifth lowest level of the index since its inception in 1997 and the weakest reading since March of 2009. April also marked the first time that the headline number showed a contractionary reading (those below 50) since December of 2009.
As shown in the table below, not only was the headline number at one of its lowest levels ever, but the 10.7 point decline was the largest month over month decline ever recorded. The same can also be said for the month over month declines for multiple sub-indices including those for Business Activity, New Orders, Employment, and the Manufacturing and Non-Manufacturing composite. On the other hand, the indices for Supplier Deliveries and Inventory Sentiment experienced their largest one month gains ever, but those are not necessarily positives as detailed later on. Breadth across each of the sub-indices was overall very weak in April as several readings are now at or near some of their weakest levels on record with most now sitting in contractionary territory.

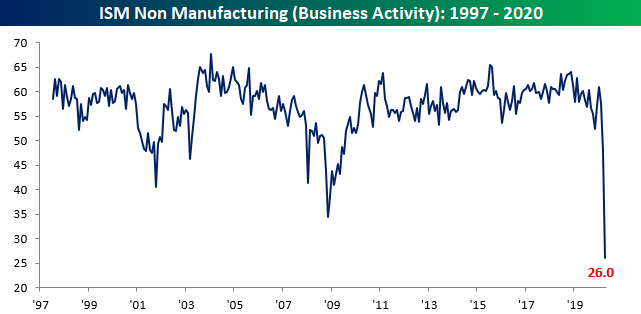
One of the weakest areas of last month’s report was Business Activity. The index only registered a reading of 26 in April compared to 48 in March. That 22 point decline is nearly double the previous largest MoM decline of 11.8 points from December of 2007 to January of 2008. This index is now sitting at its lowest level ever, surpassing the previous low of 34.4 from November of 2008.
The same can also be said for New Orders. Demand in the services sector has been crushed by the COVID pandemic and the New Orders index fell to 32.9. That is also a record low, and the 20 point drop was the largest on record which follows last month’s 10.2 point decline which is now the third biggest MoM drop. Only 2 industries surveyed, Public Administration and Finance & Insurance, reported growth in New Orders with another 16 reporting contraction indicating the weakened demand is occurring throughout the service sector.

In addition to weak demand, the supply side has also taken a hit. Supply chains appear to have become severely disrupted from the pandemic. The index for Supplier Deliveries is the only one that is inverse (readings above 50 indicate slower deliveries rather than faster) in the ISM report. In other words, the index rises when it takes longer for suppliers to make deliveries which as ISM details “is typical as the economy improves and customer demand increases”. But in the current scenario, the index has surged by the most of any month in its history to a record high of 78.3 on a function of supply weakness rather than demand strength (as indicative in New Orders’ collapse). Supply chains have faced serious headwinds as all 18 industries reported slowed deliveries in April. This record high in Supplier Deliveries, which again in more normal circumstances could be taken as a positive sign for the economy, helped to bolster the weak headline number.

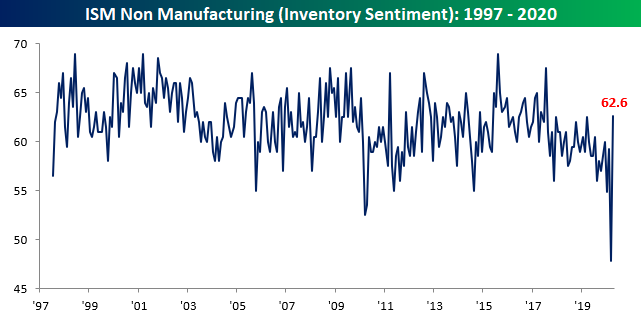
With weak demand and long lead times, industries are reporting inventories as too high. The index for Inventory Sentiment saw a massive surge rising 14.8 points to 62.6. While that is only the highest level since July 2017, this furthers the point that supply chains are facing trouble and demand remains weak. That large increase in the number of industries reporting inventories as too high comes as inventories are appearing to be drawn down as that index is still at a contractionary reading of 46.9.
Employment has also collapsed with a second consecutive reading below 50. All 18 industries reported that there was a decline in employment which sent the index to a record low of 30. As with the other categories mentioned, this was also the largest monthly decline ever. In the commentary section, one responder made an interesting note stating business has been impaired “due to employees afraid to work side-by-side with other employees.”

After today’s release and last Friday’s release of the manufacturing counterpart, the composite index is now at its weakest level (41.8) since March of 2009 (39.8) with the 10.3 point decline from last month the largest one month decline ever recorded for the composite. All in all, the two reports for the month of April gave a very bleak outlook for the US economy. Start a two-week free trial to Bespoke Institutional to access our interactive economic indicators monitor and much more.

Was Warren Right?
Warren Buffett made headlines over the weekend when he disclosed that he had completely sold out of his airline holdings. While some questioned whether he was selling out at the lows, for now at least, he appears to be right. As shown in the chart below, the S&P 500 Airlines Group is currently right near its COVID lows, and a close at current levels would actually be a new closing low.
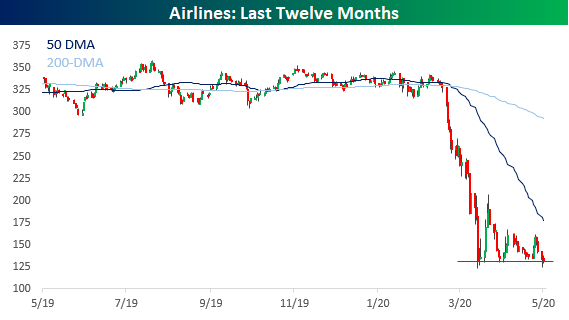
Given the national stay at home orders still in place, it’s not much of a surprise that airlines haven’t bounced, but the same could be said for a number of the other 60+ S&P 500 industries. The table below lists the S&P 500 industries that are currently at their lowest levels relative to their 52-week range. At a level of just 3%, the Airlines group is trading by far the lowest level relative to its 52-week range. The next closest sector, Energy Equipment & Services, is currently trading at much higher levels versus its 52-week range at 20%. In total, there are just 13 industries that are trading in the lower third of their 52-week range, and most of them are clustered in the Financials and Industrials sectors.
On the upside, the fact that there are more groups in the upper third of their 52-week range than the lower third suggests positive breadth. Sectors represented on this part of the list include Consumer Discretionary, Technology, and Health Care.

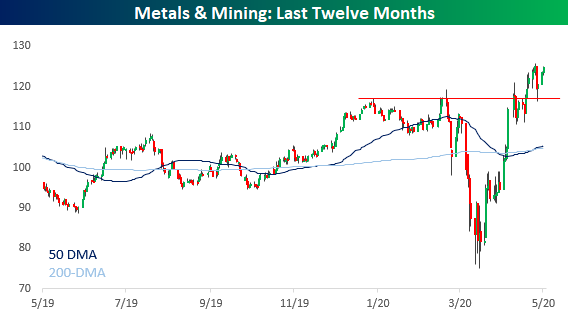
While Airlines is the only industry on the verge of making new lows, there is also just one industry on the verge of making new highs too. The Metals and Mining industry definitely wasn’t spared during the February and March declines, but the magnitude of the bounce has been even stronger with a gain of over 66% off the lows. Start a two-week free trial to Bespoke Institutional for full access to our research and interactive tools.
Bespoke’s Morning Lineup – 5/5/20 – Opening Day?
See what’s driving market performance around the world in today’s Morning Lineup. Bespoke’s Morning Lineup is the best way to start your trading day. Read it now by starting a two-week free trial to Bespoke Premium. CLICK HERE to learn more and start your free trial.
Just about a month after Major League Baseball would have had its opening day, US markets are poised to open higher today on optimism that the opening day for the economy will be coming a bit sooner than previously thought. California is starting to make plans to open its economy in a limited fashion, and New York has also released its plans for how to reopen as well. We’re not out of the woods yet, but any move in the direction of opening is a good thing, and as long as these measures can be taken while keeping the outbreak in check, additional steps to reopen can continue.
Be sure to check out today’s Morning Lineup for a rundown of the latest stock-specific news of note, the German Constitutional Court’s decision ruling on QE, and the latest stats and trends on the COVID outbreak

While the S&P 500 is down modestly over the last five trading days, we’ve seen quite a bit of dispersion in sector performance. At one end of the spectrum, Energy stocks have been on fire rallying nearly 5%. Behind Energy, the only two other sectors that are positive over the last week are Communication Services (XLC) and Technology (XLK). On the downside, Utilities (XLU) are down by nearly as much as Energy stocks are up (-4.46%). Not far behind XLU, Health Care (XLV) and Real Estate (XLRE) are also down over 3%.
Relative to each sector’s 50-day moving average, we’re also seeing a wide range of levels. Of the 11 sectors, six are currently more than 5% above their 50-day moving averages, but after that, the only other sector that is above its 50-day moving average is Consumer Staples and just barely above its 50-DMA at that. While no sectors are currently oversold (more than one standard deviation below its 50-day moving average), Utilities, Financials, and Industrials are all more than 2% below their 50-DMAs.

“What’s Wrong, Warren?”
That seems to be a question a lot of people are asking lately. Warren Buffett surprised a lot of investors this past weekend by disclosing that he was a net seller of equities in April after liquidating all of Berkshire Hathaway’s (BRK/a) stakes in the major airlines. Declines like the one we saw in February and March have typically been used by Buffett as an opportunity to add to Berkshire’s equity exposure, and over the last couple of weeks, everyone has been wondering what positions Buffett may have added to or even initiated during the sell-off. Therefore, the news that Buffett actually added cash to his $100 billion war chest was surprising. The fact that Buffett became even more conservative after Berkshire reported a quarterly loss of nearly $50 billion has the stock underperforming with a decline of over 3% today.
Even before the weekend’s events, shares of BRK/a have been underperforming the S&P 500 by a wide margin, and while it’s not particularly uncommon for BRK/a to underperform when the equity market is doing well, investors will usually tolerate that underperformance knowing that the stock will outperform in a bear market. The only problem this time around is that even with the S&P 500 moving into (and out of) bear market territory in the last several weeks, the stock is still lagging the broader market in a big way.
Berkshire has been doing so bad lately that after today’s weakness, the stock’s relative strength versus the S&P 500 is at a five-year low. Going all the way back to 1980, there has only been one other period where the Oracle of Omaha’s stock has seen its relative strength versus the S&P 500 drop to a five year low, and that was in late 1999/early 2000. In fact, the title of this post has nothing to do with the present period as it’s actually a headline from an article in the Wall Street Journal from 12/27/1999.

As shown in the above chart, the one and only other time that Berkshire’s relative strength hit a five-year low, it didn’t stay low for long. Below, instead of showing the relative strength, we show Berkshire’s price in the five years before and after that period. From 1995 right up until early 1998, Berkshire’s stock did very well, but as the tech bubble began to inflate, the stock ran out of steam. While Berkshire made a run at new highs in early 1999, it couldn’t quite get there, and from there the stock was nearly cut in half in the span of a year. From there, though, Berkshire rebounded quickly even as the rest of the market started to fall apart and shareholders who held on made out well.

Fast-forwarding twenty years to today, the pattern for Berkshire has some similarities to the period leading up to 2000. Like the late 1990s, Berkshire was essentially range-bound in the last couple of years leading up to the recent decline, but unlike 1999 when the stock failed to make a higher high, Berkshire hit a new high right along with the S&P 500 earlier this year. Now that the stock has fallen and underperformed so sharply, questions surrounding Buffett and whether he has lost his touch are making the rounds. History has shown that it has never been profitable to bet against Warren Buffett in the past, so that would make now look like an opportune time to be in the stock. The only caveat here is time. The last time people were questioning whether Berkshire was worth holding for the long-term, Buffett was just 69 years old. This time around he’s less than four months away from his 90th birthday. Definitely a young 90, but 90 nonetheless. Start a two-week free trial to Bespoke Institutional for full access to our research and interactive tools.

Earnings During a Pandemic
More than 700 companies have reported Q1 earnings since April 13th when the current reporting period kicked into gear. Since the season began, 62% of companies have managed to report better than expected EPS numbers, while 64% of companies have reported better than expected sales numbers.
Below are charts showing the percentage of companies that have beaten consensus analyst EPS and sales estimates over the last three months on a rolling basis over the last year. Our 3-month EPS beat rate tracker is currently at 61.76%. That’s still above the long-term average beat rate of 59.37%, but it’s trending lower towards that average.
While the EPS beat rate is trending lower, the sales beat rate has been trending sideways well above its long-term average of 56.45%. Of course, sales have been crushed since March when the economic shutdowns began, but these numbers show how companies have managed to report versus analyst expectations. For Q1 at least, sales beat rates haven’t been impacted.

Another indicator we track is the “guidance spread,” which is calculated as the difference between the percentage of companies raising guidance and lowering guidance on a rolling 3-month basis. As shown below, the current guidance spread is at -12.24, which means companies lowering guidance outnumber companies raising guidance by 12.24 percentage points. That’s easily the lowest reading seen in the last year and it’s trending lower.

When we expand the guidance spread chart back to 2003 when our data begins, however, the current level is nowhere near as low as the readings seen in 2015 or during the Financial Crisis in late 2008. Right now companies have actually been loathe to provide any guidance at all given the uncertainty regarding the re-opening of the US economy. More clarity on things could result in more positive guidance, but it could also result in much more negative guidance as well.

You can track how individual stocks are reacting to earnings reports at our Earnings Explorer page, and below is a list of the stocks that have seen the biggest gains on their earnings reaction days so far this season. Start a two-week free trial to Bespoke Institutional to try out our Earnings Explorer today.
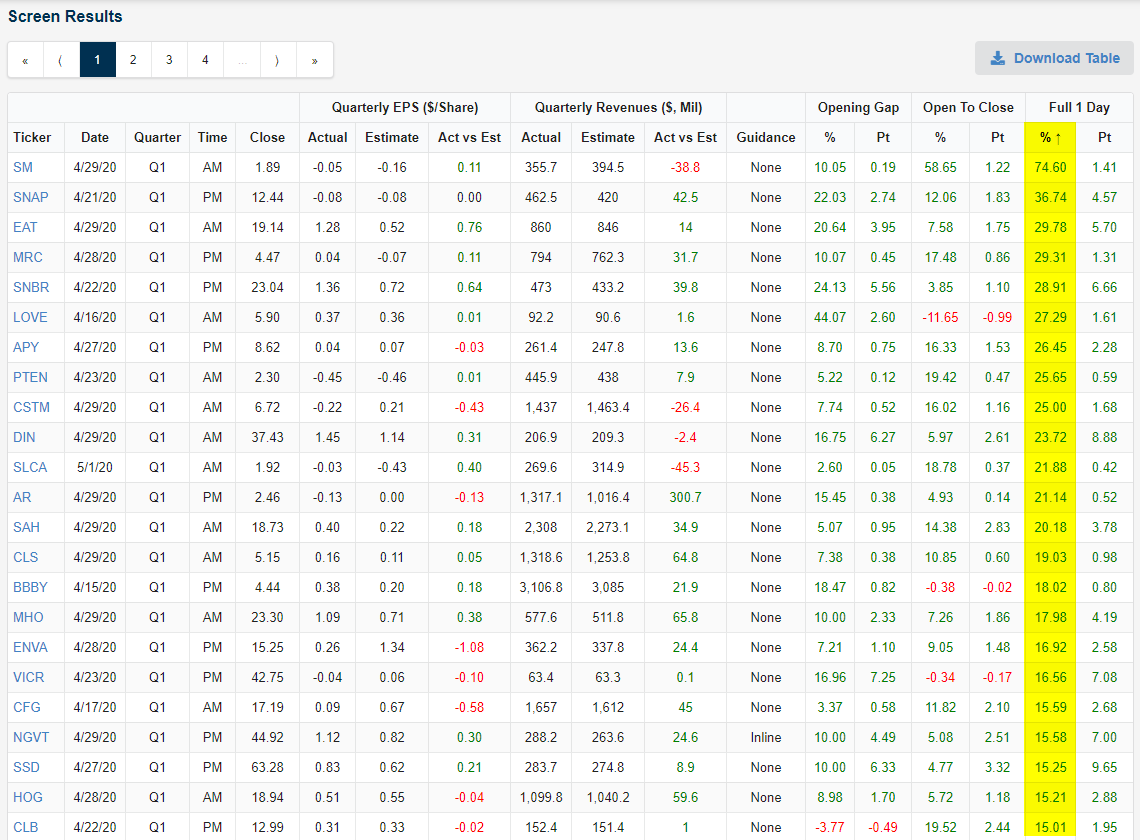
Chart of the Day – Is the Earnings Boost Behind Us?
Bespoke’s Morning Lineup – 5/4/20 – Three in a Row?
See what’s driving market performance around the world in today’s Morning Lineup. Bespoke’s Morning Lineup is the best way to start your trading day. Read it now by starting a two-week free trial to Bespoke Premium. CLICK HERE to learn more and start your free trial.
After a strong rally in April, US equities have started a bit of a losing streak in the last three days. If this morning’s weakness in futures persists, it would be the longest losing streak in about two months. The negative tone this morning can be blamed on Warren Buffett whose tone at this weekend’s annual meeting wasn’t particularly positive as he disclosed that he has sold his entire stake in the major four airlines making Berkshire a net seller of equities. That didn’t set a particularly positive tone for the opening of futures Sunday night, but we’re currently off the lows, and as we have reminded a number of times over the last few weeks, though, there’s still a lot of time between now and the closing bell at 4PM.
Be sure to check out today’s Morning Lineup for a rundown of the latest stock-specific news of note, Markit PMI data, and the latest stats and trends on the COVID outbreak.
A lot of people may have missed it Friday afternoon, but Auto Sales data for the month of April was the worst on record. According to WARD’s data, total sales for the month were just 8.58 million on a seasonally adjusted annualized rate. Going all the way back to 1976, there has never been a weaker month. While the print was weak, it was actually considerably better than consensus expectations of just 7.0 million. So it was an absolutely awful print, but not quite as awful as expected.
