New Highs and They’re Not Mega Caps
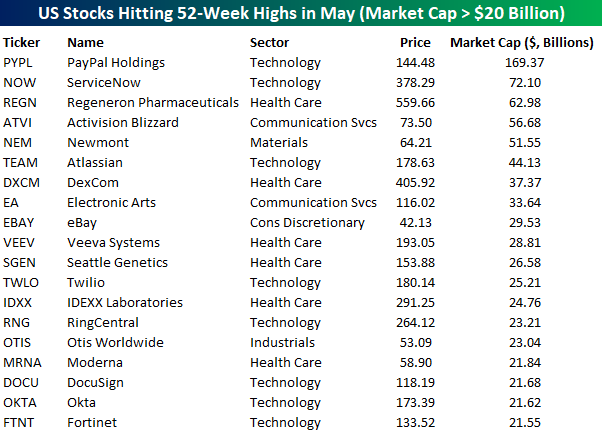
If you’ve been paying attention over the last few weeks, all you’ve heard is how the large mega-cap tech stocks have been keeping the market afloat. The five largest stocks in the US (Microsoft, Apple, Amazon, Alphabet, and Facebook) have done extraordinarily well this year and since the March lows, but to say they’ve been doing all the lifting would be inaccurate. Take for example the fact that of the 2,052 US stocks with market caps above $500 million, 101 (4.9%) have hit 52-week highs so far in May and none of them are named Microsoft, Apple, Amazon, Alphabet, or Facebook. The table below lists the 19 US stocks with market caps above $20 billion that have hit 52-week highs so far this month. Looking at the list, only one of the names listed (PayPal) has a market cap above $100 billion and just four others have market caps above $50 billion. Not only are these names not mega-caps, but many of them are also stocks that most people have probably never heard of.
While mega-cap stocks may not be the ones hitting 52-week highs this month, one part of the argument behind which factors are driving the market that is partially accurate is that tech stocks are leading. Breaking out the table below by sectors 8 of the 19 names listed are from the Technology sector. Behind Technology, the next most heavily represented sector is Health Care with 6. However, when we expand the universe to all stocks hitting 52-week highs with market caps above $500 million, Technology doesn’t even top the list. With 49 stocks from the Health Care sector hitting 52-week highs this month, it tops the list followed by Technology with 26. Behind these two, no other sector accounts for even 10 names. These days, if you’re a company that’s not involved in Health Care or Technology, you’re dead to investors. Start a two-week free trial to Bespoke Institutional for full access to our research and interactive tools.
The Bespoke Report — 5/8/20
This week’s Bespoke Report newsletter is now available for members.
In this week’s Bespoke Report we take a look at the continued surge for the tech-heavy Nasdaq, which appears to love the look of the post-Covid economy. There are a lot of helpful charts in this week’s report, so be sure to give it a read over the weekend. Bespoke’s macro strategist George Pearkes also completed our quarterly Global Macro Outlook this week, and it’s ready for reading. To read these two reports and access everything else Bespoke’s research platform has to offer, start a two-week free trial to one of our three membership levels. You won’t be disappointed!

Daily Sector Snapshot — 5/8/20
Performance on Earnings Days
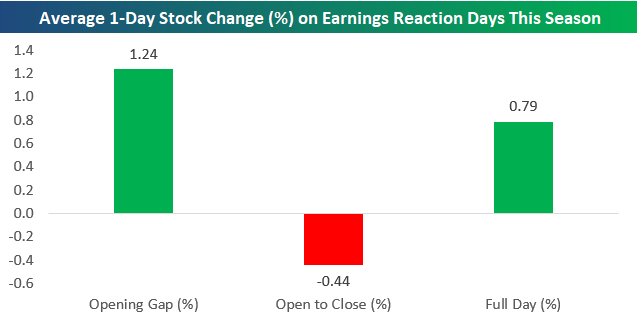
Roughly 1,300 companies have reported since the start of earnings season on 4/13 when the first of the big banks kicked things off. For those stocks that have beaten EPS estimates, the reaction has not been as strong as past years with just a 9 bps difference between this earnings season and all seasons since 2001. On the other hand, those that have missed EPS have not been as badly punished dropping 0.86% compared to an average drop of 3.56% since 2001. For all stocks, the average gain of 0.79% this earnings season is much stronger than the 0.06% gain of all other seasons.

With stock price reactions being generally positive this season, most of the gain has come at the open. Stocks reporting earnings have gapped up an average of 1.24%. But intraday they have tended to sell-off, averaging a 0.44% decline from open to close. Start a two-week free trial to Bespoke Institutional to access our interactive Earnings Explorer and much more.
Group Breadth Improving From a Record Low Base
After a disastrous late February and early March period, breadth among S&P 500 groups cratered to the point where not a single one of the S&P 500’s 24 industry groups were above their 50-day moving average. Before the most recent occurrence, that’s something we hadn’t seen since early 2019.

While there have been numerous instances in the last few years where every industry group was below its 50-DMA, the most recent period was unique in that it lasted more than four full weeks (21 trading days). Going all the way back to 1990, there has only been one other period where every industry group was below its 50-day moving average for as long as it just was. That was during the depths of the financial crisis in the 21-day stretch ending 11/3/08. It took a bear market of more than a year to finally reach that level back then, but this time around, it took less than two months. Besides that period, there has never been another four-week stretch where every industry group was below its 50-day moving average.

Overall breadth readings have already improved in terms of industry groups above their 50-day moving averages, but at this point, the number of industry groups with rising 50-day moving averages remains extremely depressed at just 8.3% as of midday Friday. Similar to the streak above, during the most recent period every group had a declining 50-day moving average for 26 straight days, and that was also the longest such streak since 2008. Granted, this is a lagging indicator and should improve the longer equities remain around current levels, but it once again serves as a reminder of how steep the declines actually were. Start a two-week free trial to Bespoke Institutional for full access to our research and interactive tools.

Delinquencies Beginning to Tick Up
In Tuesday’s Closer, we covered the New York Fed’s quarterly consumer credit data. While less expansive, also out earlier this week was the higher frequency monthly mortgage data from data and analytics company Black Knight. Similar to the NY Fed’s data, Black Knight’s monthly mortgage monitor for March showed that despite record jobless claims and all-around slower economic activity on behalf of the coronavirus, there had not been any sharp rise in foreclosures. In fact, total foreclosures as a percentage of all mortgage loans were at their lowest levels since at least 2012 at only 0.41%. Additionally, most of those foreclosures were older. Only 11.7% of foreclosures were new as of March which is the lowest share since May of 2016. Although foreclosures remain historically low at the moment, some weakness does appear to be bubbling up as delinquencies are on the rise. As of March, 3.62% of all loans were delinquent up from 3.13% in February. That is the highest level for delinquencies since last June and the first increase since March of last year. That 49 bps rise was also the largest one month increase since at least 2012.

That rise in delinquencies could filter through to a higher number of foreclosures in the future, but at the moment most non-current loans (those that are delinquent and in foreclosure) have only been delinquent for 30+ days. Of all non-current loans, the majority (53.5%) are at least 30 days late from the payment due date which is the most since at least 2012. Another 15.4% were more than 60 days late and 20.2% are over 90 days late. The remaining 10.9% of non-current loans are in foreclosure which is again a historically small share. Start a two-week free trial to Bespoke Institutional to access our Closer and much more.

Consumer Credit Before The COVID Crash
On Tuesday, the New York Fed released its quarterly snapshot of consumer credit which was the last one before the effects of COVID-19 start to work their way across lenders. As noted in Tuesday’s Closer, the data showed some initial signs of cracks in lending markets. Credit card balances declined slightly which was the first drop since Q1 2014. On the other hand, mortgage lending—the largest section of consumer credit—had a strong quarter with balances outstanding rising 6.5% annualized after seasonal adjustment while auto lending—the third-largest share of consumer credit—had its best quarter since Q1 2017.

Longer-term growth trends were also fairly uninterrupted in Q1 as has been the case for the past few years. Loan growth was primarily driven by mortgages which made a new post-crisis high in Q1 while other categories of lending were pretty unremarkable.

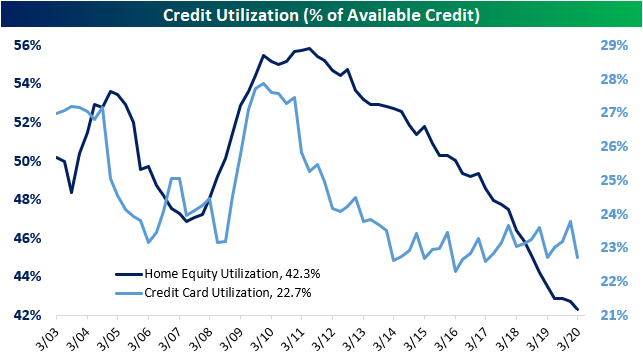
Finally, we note that on the eve of COVID-19, consumers had ample reserves of credit available on both HELOCs and credit cards. Even better news, the percentage of consumers under collection was at a record low, the number of bankruptcies was at a record low, and foreclosures were very low as well. While the outbreak of COVID-19 and the related economic ramifications likely changed that, consumers were in a relatively strong position coming into the pandemic.

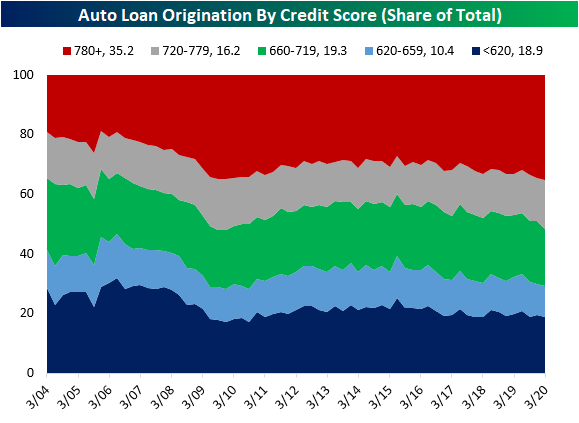
Not only were foreclosures and bankruptcies historically low, but the lending conditions appeared fairly tight as well. The lending market was mostly directed towards high-quality borrowers. That was the case for not only mortgages but auto loans as well. Start a two-week free trial to Bespoke Institutional to access our interactive economic indicators monitor and much more.

Sector Relative Strength
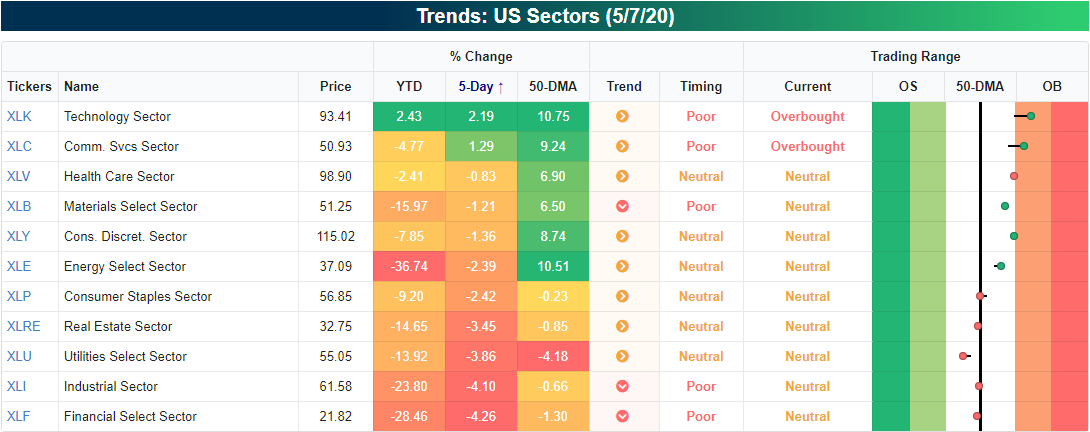
Although the S&P 500 (SPY) is down around 1% over the past week, there are two sectors that have made a push higher: Communication Services (XLC) and Technology (XLK). While these moves have left both sectors in overbought territory, a snapshot from our Trend Analyzer tool shows that Tech’s rally has brought it into the green YTD.
Technology’s outperformance is nothing new. As shown in the relative strength charts from our Sector Snapshot below, Technology has been a serial outperformer versus the S&P 500 for pretty much all of the past year (a rising line indicates outperformance versus the S&P 500 and vice versa). As for the other sectors, Health Care has also seen some drastic outperformance over the past few months. Communication Services and Consumer Discretionary have also seen some outperformance in recent weeks. Contrary to Technology, Energy, Financials, Industrials, and Materials have all been consistent underperformers over the past year. Start a two-week free trial to Bespoke Institutional to access our Trend Analyzer, Sector Snapshot, and much more.

Bespoke’s Morning Lineup – 5/8/20 – Got That Over With
See what’s driving market performance around the world in today’s Morning Lineup. Bespoke’s Morning Lineup is the best way to start your trading day. Read it now by starting a two-week free trial to Bespoke Premium. CLICK HERE to learn more and start your free trial.
We’ve just seen what is probably the worst jobs report in the life of anyone reading this. That’s the bad news. The good news? Hopefully, we’ll never see a report like this again! Today’s April Non-Farn Payrolls report is definitely great fodder for headlines heading into the weekend, but it is what it is. Everyone is expecting it, so it shouldn’t surprise anyone. Economists and market watchers will take great pains to dissect the numbers, but keep in mind that there are lots of distortions, and once all the revisions are made in the months ahead, the numbers will likely change a lot.
Be sure to check out today’s Morning Lineup for a rundown of the latest stock-specific news of note, a discussion of the move into negative territory for Fed Funds futures, and the latest stats and figures surrounding the COVID-19 outbreak.

It came right down to the wire yesterday, but the Philadelphia Semiconductor Index (SOX) finished up 1%+ for the fourth straight day. Sure, the gain was only 1.01%, but 1% is 1%. Thursday’s gain wasn’t the only ‘modest’ 1% gain of the current streak either. Starting with Monday, this week’s daily gains for the SOX were 1.03%, 1.68%, 1.08%, and 1.01%. That works out to a total four-day gain 4.9%, and while 4.9% is nothing to sneeze at, there has never been a four-day streak of 1% gains for the SOX that resulted in a smaller cumulative gain. Not only that, but the SOX is still below where it closed last Thursday (before Friday’s 5% decline). It’s not too often that a stock or index rallies over 1% for four straight days and still is in the red over the prior five days!
However weak the current streak of 1% gains is for the SOX, it still goes down as the longest such streak since December 2016. Also, if the SOX does manage to rise 1% again today (as it is currently trading in the pre-market, it would be the longest streak of 1% gains in over a decade!

We’ve covered breadth in these emails a lot this week, so we might as well check up on the SOX to see how breadth looks in the semis. Unlike the Nasdaq, which was showing a modest divergence with price since the end of April, breadth for the SOX has actually been slightly stronger than price, and that’s a good thing.

Jonesing For A Hedge
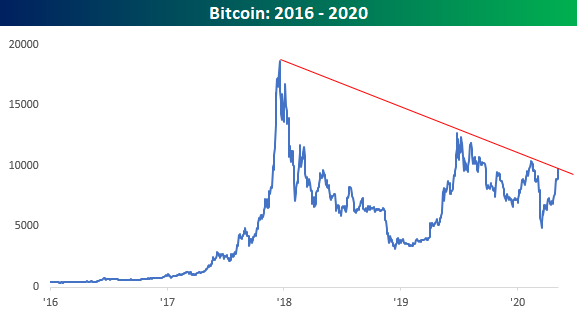
The world is a scary place right now. 10% of the US population and 20% of the labor force have filed for unemployment insurance in the last few weeks, and stock markets have seen record volatility. For the Americans that do have more than $400 saved up, the question is where do you put it? With interest rates at zero and with central banks flooding the market with liquidity, many are concerned that the dollar they put under the mattress today won’t be worth that much when the rainy day comes. Sure, the stock market has historically delivered superior returns, but those above average returns aren’t guaranteed to be there when you need it either. Gold, on the other hand, has fared relatively well. After a sharp decline in the early days of the Covid Crash, it has since broken out to five-year highs and is only about 10% from all-time highs.
In addition to gold, bitcoin has done extremely well recently, and unlike gold which is normally associated with grumpy old guys, bitcoin is cutting edge. Just today, bitcoin received another endorsement as it was reported that hedge fund legend Paul Tudor Jones has been buying the crypto-currency saying it reminds him of gold in the 1970s. Like gold, bitcoin is considered an inflation hedge but an extremely volatile one at that. Not only is it something they can’t make more of, but the supply is actually shrinking. That’s because bitcoin has to be stored in a digital wallet and if you lose your wallet, you lose your bitcoin. Way back in 2018, the Wall Street Journal reported that up to a fifth of all bitcoin had been lost and in most cases, those losses were permanent.
Looking at the recent performance of bitcoin, the last month or so has been extremely strong with the price more than doubling off its March lows. After today’s PTJ bounce, it’s not far from its highest levels of the year right around $10,400.

Just as bitcoin is nearing short-term resistance, it is also bumping up right against a long-term downtrend as well. Since its record high during the late 2017/early 2018 mania when bitcoin peaked just under 20,000, bitcoin has seen a series of lower highs at 14,000, then around 12,500, and earlier this year at 10,400. It’s still below 10,000 now, but a break above 10,400 to new 2020 highs would put that downtrend line in the rearview mirror. And while panic over pandemic has drowned out talk of just about anything else, not even COVID-19 would be able to silence the crypto crowd if that downtrend breaks. Start a two-week free trial to Bespoke Institutional for full access to our research and interactive tools.