Surge in Mortgage Applications Continues
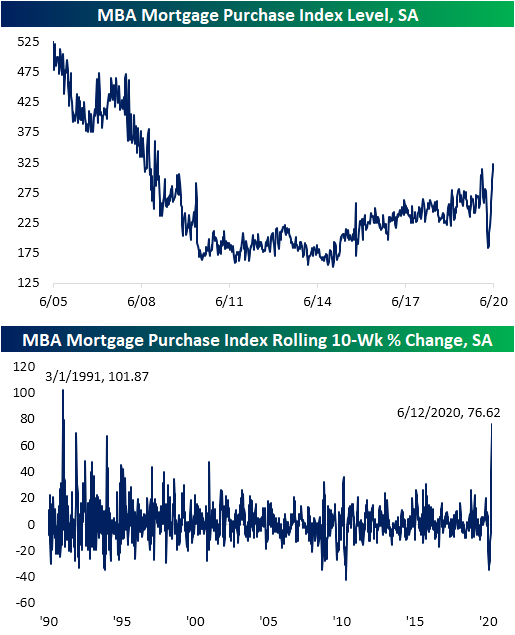
Housing market data is the main focus in today’s macroeconomic slate, and although Housing Starts and Building Permits both came in below estimates, weekly mortgage applications from the Mortgage Bankers Association (MBA) were much stronger. MBA’s seasonally adjusted purchase index rose another 3.46% week over week. That marked the ninth consecutive sequential increase (the longest such streak on record) and the highest level for the index of the post housing crisis period. In fact, this morning’s reading was the highest since the first week of 2009.
That is a massive rebound after purchase apps had fallen to their lowest levels since early October of 2015 back on April 10th. In the ten weeks since that low, purchases have rise 76.62%. As shown in the second chart below, that is the largest 10-week increase since the early days of the index: March of 1991.
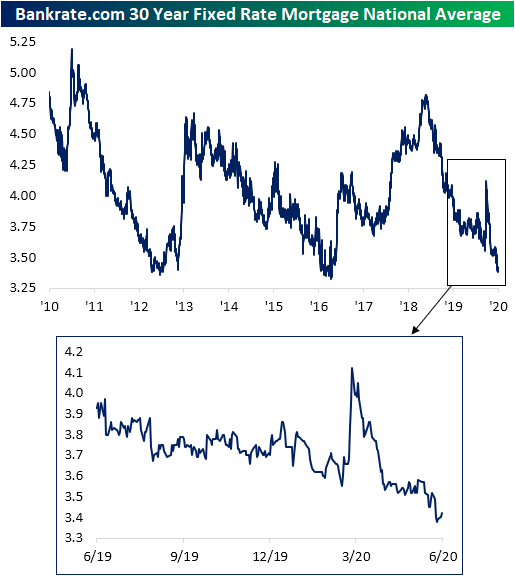
As for what has driven that surge in purchase applications, interest rates have played a major role. Although they are off the lows after rising a few basis points over the past few days, last Thursday the national average for a 30 year fixed rate mortgage fell to 3.38% which was the lowest level since October 3rd of 2016.
Low mortgage rates have also led to strong levels of refinancing applications. Earlier this year refinances spiked to their highest level since 2009. In the wake of that March peak, refinance application strength subsided a bit, but has remained at very strong levels. This week’s 10% WoW increase marked the first back to back weeks with higher refinance applications since the last week of February and the first week of March. That also comes after seven consecutive weeks of declines from mid-April through the end of May. Even though refinances are nearly 65% off that early March peak, they remain at some of the highest levels since 2013.

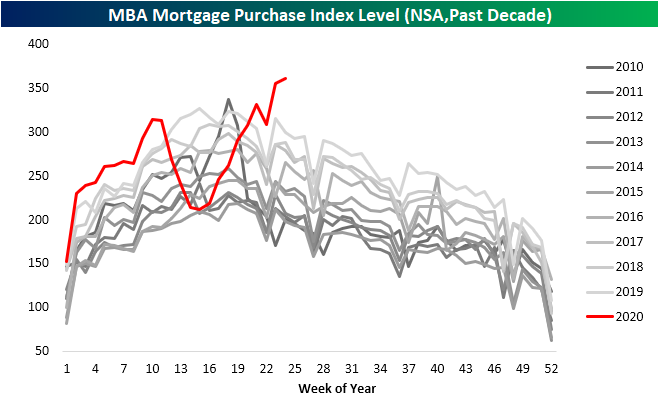
In addition to low rates, due to the COVID-19 shutdowns occurring during what is a seasonally strong time of year, seasonal catch up is also providing a boost this year. As shown below, the past few weeks have seen some of the strongest readings for the specific week of the year of the past decade. That comes shortly after shutdowns resulted in the weakest readings of the past decade for the weeks around March and early April. Additionally, purchases have continued to rise despite the annual peak typically having already occurred by this point in the year. In the past decade, the annual peak for purchases is usually put in place by mid-April or mid-May. The only year with an annual peak later than that was 2015 on account of a change in mortgage disclosure rules leading to a one time surge in purchase applications. While 2020 is far from over, the continued strong readings are sure to make a later seasonal peak than normal.
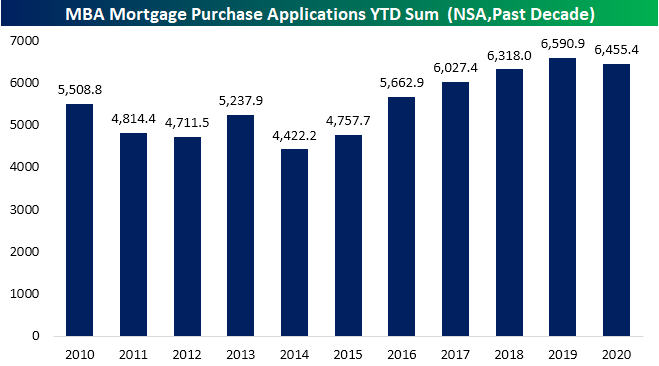
Despite the recent strength, the damage from weakness earlier in the year still hasn’ been undone. Looking at the YTD sum of purchase applications through the current week of the year (24th week) applications are down roughly 2% in 2020 vs 2019. Given that the US is in the midst of a global pandemic, however, it could be a whole lot worse. Click here to view Bespoke’s premium membership options for our best research available.
Bespoke’s Morning Lineup – 6/17/20 – Chips and Dips
See what’s driving market performance around the world in today’s Morning Lineup. Bespoke’s Morning Lineup is the best way to start your trading day. Read it now by starting a two-week free trial to Bespoke Premium. CLICK HERE to learn more and start your free trial.
Markets are poised for another positive start to the day today, although not nearly to the degree of yesterday’s surge. On the economic calendar, today’s big reports are Housing Starts and Building Permits. While the continued surge in mortgage applications suggested a positive backdrop for housing, the actual numbers came in weaker than expected. Housing Starts were expected to come in at a level of 1.1 million but were well short at 974K. For Building Permits, the 1.220 million print was also weaker than the 1.245 million consensus estimate.
Be sure to check out today’s Morning Lineup for a rundown of the latest stock-specific news of note, European auto sales, mortgage applications, global and national trends related to the COVID-19 outbreak, and much more.

In yesterday’s report, we discussed the rally in chips and how semiconductors trading at new highs relative to the S&P 500 was a positive trend for the broader market. From yesterday’s discussion of chips, today we wanted to highlight ‘dips’ and how investors have been buying them recently. In the last three trading days, the S&P 500 ETF (SPY) has finished the day more than 1.5% above its intraday low. That may not sound all that noteworthy, but before two occurrences in March, the last time we saw a similar pattern was back in 2011.
The idea of consistent buying on the dips sounds like a positive trend, but the reality is that it isn’t much of a consistent signal in either direction. The most recent occurrences in March, late 2011, and late 2008 all occurred in the later stages of market declines, but there was also an occurrence right near the 2007 peak as well as multiple occurrences from 2000 right through 2002. It sounds great in theory, but this is one trend we wouldn’t put much stock into.

Daily Sector Snapshot — 6/16/20
Citi’s US Economic Surprise Index at an All-Time High
Over the past few months, we’ve seen record drops and now record bounces for many of the most widely followed economic indicators. The Citi Economic Surprise indices, which track how economic data is coming in relative to forecasts, have been a prime example of the moves in economic data. Back at the end of April, the index for the US had fallen to a record low of -144.6, but that has since turned around. Even before the addition of today’s blockbuster US retail sales report, the Citi Economic Surprise index had reached a new all-time high yesterday. With a further boost from today’s releases, the all-time high is now even higher. That means that economic data in the United States has been coming in far stronger than economists have had penciled in.

While the US has seen big beats for the country’s economic data, the same cannot be said for the broader world. The global index (which would include the US) is at a much more modest level in just the 42nd percentile of all readings. Although it was briefly positive one week ago, the global index is not even positive. Negative readings indicate that more indicators from around the globe are still releasing at levels worse than forecast. Granted, that is still improved from April and May when the index was at some of its lowest levels since the Financial Crisis.

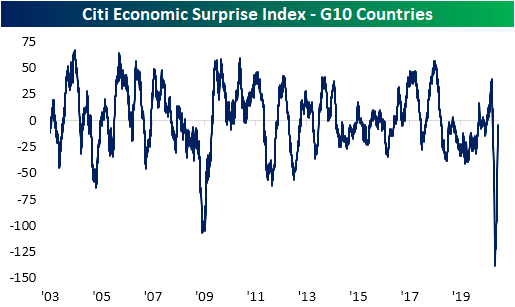
The same can also be said for the G10 countries. Even though the US has likely provided a boost, the index for G10 countries remains negative and more or less in the middle of its historic range. Unlike the global index, though, the index for the G10 has not been in positive territory since April 1st.
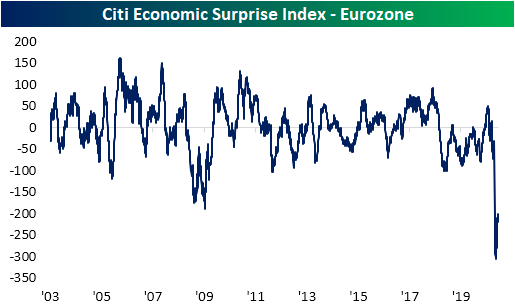
Taking another look at the developed world, more specifically the Eurozone, there has not been much of a rebound at all. The Citi Eurozone surprise index is currently around -200 compared to a low of -304.6 on May 11th. Despite the nearly 100-point increase over the past month, it is still in the bottom 1% of all readings since 2003.
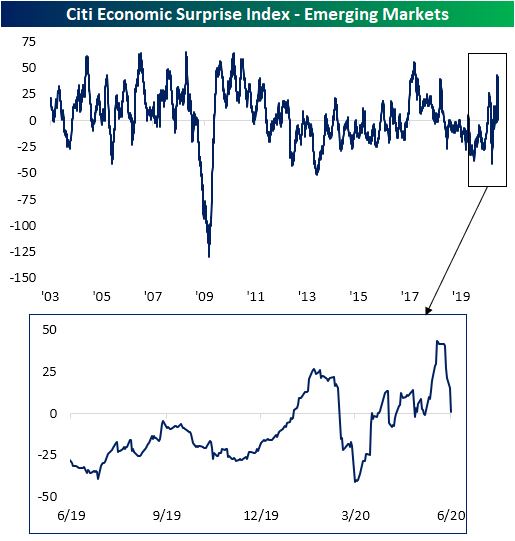
Switching over to Emerging Markets, there was never an outright collapse in the surprise index as was seen in other areas of the world. In fact, the index had been sitting in negative territory for much of the past couple of years, but the past several weeks have actually seen fairly consistent positive readings. But the emerging markets index has been falling back towards negative territory so far in June. Click here to view Bespoke’s premium membership options for our best research available.
Homebuilder Sentiment Surge
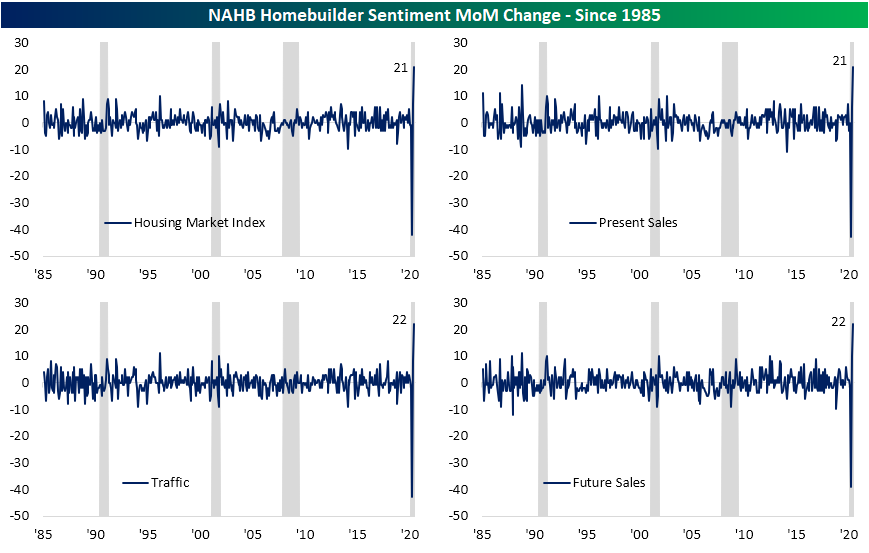
Back in April, like many economic indicators, the NAHB’s reading on the single-family housing market came crashing down. The index bottomed out at 30 which was its lowest level since June of 2012 when the headline number had been 29. May’s reading saw a bit of a bounce as the index rose to 37, but even at those levels, it was still showing similar readings to the late summer of 2012. June, on the other hand, showed a massive improvement for both the overall market index and each of the components and other sub-indices. Now, while still well off the highs from only a few months ago, each index is greatly improved and sitting at the bottom of the past several years’ range.
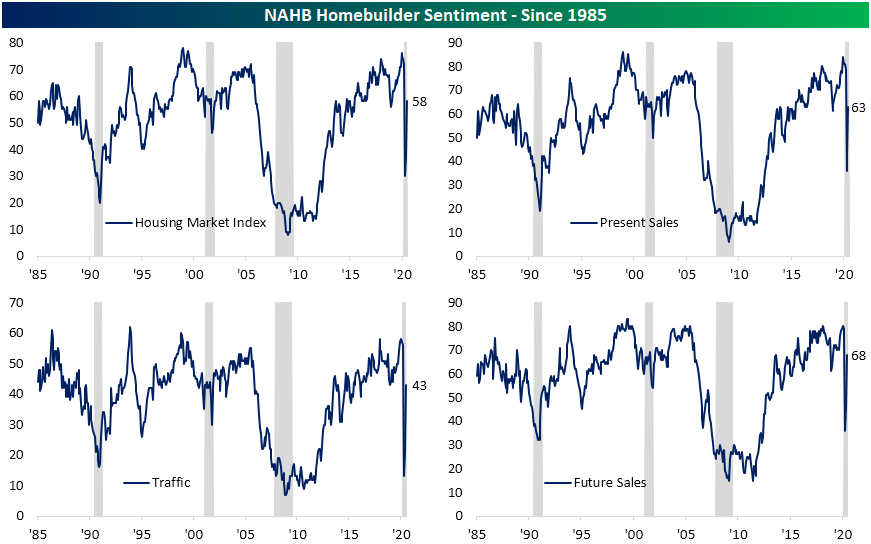
This month’s release also blew estimates out of the water. The headline number had been forecasted to come in at 45 which would have still been a contractionary reading. Instead, the actual number came in 13 points higher at 58. Only two months after the worst miss relative to expectations, today’s 13 point beat was the biggest beat versus expectations since at least 2003.

The headline number, as well as just about every sub-index, also observed their largest one-month increases on record. While those increases did not leave any sub-index at a new high, they are now back into the middle of their historical ranges. Additionally, all but two sub-indices (Traffic and the Northeast) are also now showing readings above 50 meaning homebuilders have a more favorable outlook on the market. Just last month every sub-index showed unfavorable conditions.

In the charts below, we show the blowout of the month over month changes over the past few releases for the headline index as well as its three components. As previously mentioned, each one experienced its sharpest one month increase on record.
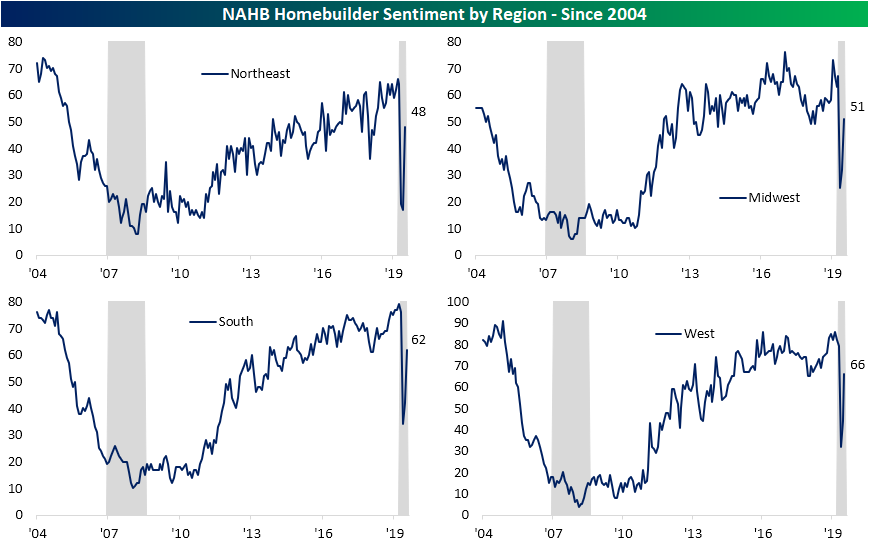
Meanwhile, the same can be said for the indices covering each of the US regions. The only region to not experience a record month over month increase was the West, but even that was its second-largest MoM gain ever. As with the individual categories, most readings are showing more favorable housing markets although the Northeast, like the index for Traffic, remains below 50 (unfavorable market) despite its record uptick. Click here to view Bespoke’s premium membership options for our best research available.

Bespoke Stock Scores — 6/16/20
Off Season Earnings Trends
We’re basically right in the middle of the earnings off-season right now when only a handful of companies are reporting quarterly earnings each day. Bespoke maintains a huge historical database of quarterly earnings reports for nearly every stock traded on US exchanges. Clients have access to the database — called the Earnings Explorer — right on our website. The Earnings Explorer contains a full calendar of upcoming earnings reports, summary charts highlighting historical trends on earnings and revenue beat rates, guidance numbers, and historical quarterly results for individual stocks going back 20 years.
As shown below, the number of earnings reports by day over the next three weeks is minimal, and then the Q2 reporting period starts up in full force in mid-July. Click here to view Bespoke’s premium membership options for our best research available.

Below is a chart from our Earnings Explorer that shows the historical “beat rate” for all stocks that have reported earnings over the last five years. This reading shows the rolling 3-month percentage of companies that have reported stronger than expected EPS and sales numbers. Notably, the bottom-line EPS beat rate had been well above its historical average since late 2017, but it has just recently dipped below its average with a steep decline over the last three months. Conversely, the percentage of companies beating sales estimates has held steady over the last few months and is now higher than it was for all of 2019. Over the last three months, 61.5% of companies have beaten top-line sales estimates, which is five points above the long-term average of 56.5%.

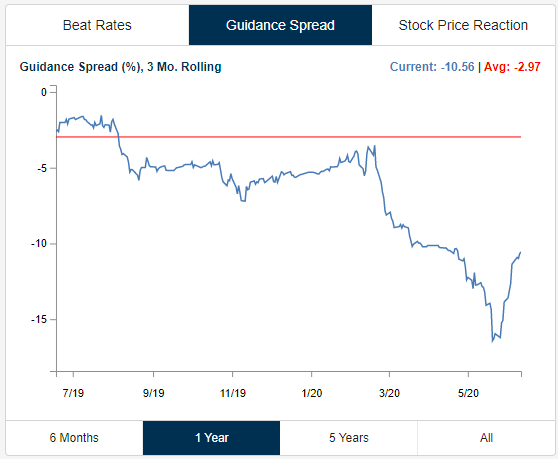
We also monitor the “guidance spread,” which is the difference between the percentage of companies raising guidance and lowering guidance on a rolling three-month basis. As shown, after plummeting from only slightly negative levels as we entered 2020 to -17% at the end of May, the guidance spread has begun to increase quickly in June. Since the reading is still in the red, it means that companies are becoming “less negative” about the future.

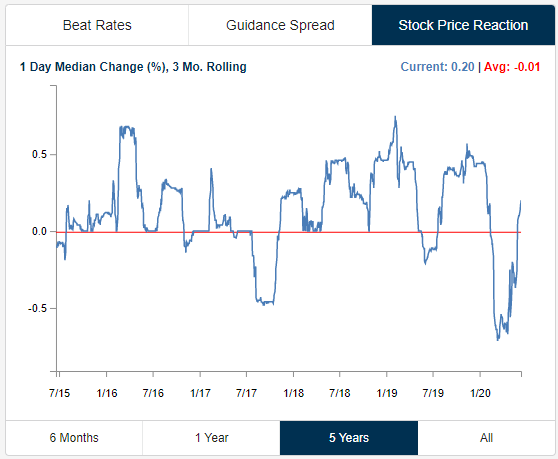
One final indicator that we track is the median one-day percentage change of stocks that report earnings. Over the last three months, stocks that have reported earnings have seen a median one-day share price reaction of +0.20%. As shown below, that’s a huge increase from extremely negative price reactions to earnings that we saw in March and April.

Below we have taken snapshots of two pages from our Earnings Explorer tool that provides snippets of information you can easily review for the stocks you’re most interested in. To try out our Earnings Explorer free of charge, start a two-week free trial to Bespoke Institutional today!


B.I.G. Tips – Retail Sales Rise From the Ashes
For the last several weeks, all we have heard is how Americans have been sitting at home and gambling away their stimulus checks in the stock market. Well, if that’s true, how did they ever find the time or the money to spend like they did in May? Relative to April, Retail Sales rose by a record 17.7%, which was more than double expectations and well more than double the next strongest month back in October 2001.
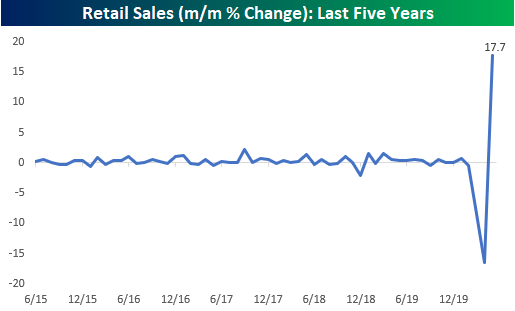
Even after the largest monthly increase on record, Retail Sales remain well in the hole compared to where they were at their highs in January. In fact, through May the pace of sales on a seasonally adjusted basis was still nearly 40% off the highs.

For anyone with more than a passing interest in how the economic shutdown is impacting economic data, our monthly update on retail sales is a must-read. To see the report, sign up for a monthly Bespoke Premium membership now!
Chart of the Day: SPY Gaps Up of 2%+
Bespoke’s Morning Lineup – 6/16/20 – Stimulus Everywhere
See what’s driving market performance around the world in today’s Morning Lineup. Bespoke’s Morning Lineup is the best way to start your trading day. Read it now by starting a two-week free trial to Bespoke Premium. CLICK HERE to learn more and start your free trial.
After yesterday’s rally stunning reversal, which was attributed (wrongly in our view) to the FOMC announcing that it would start buying corporate bonds, global equities are in rally mode again this morning on reports of a $1 trillion stimulus plan scheduled to be unveiled by the Trump Administration for roads, bridges, and technology projects. Futures are at their highs of the morning ahead of what will be a busy day of economic data.
Be sure to check out today’s Morning Lineup for a rundown of the latest stock-specific news of note, the global rally in risk assets this morning, economic sentiment, global and national trends related to the COVID-19 outbreak, and much more.
The chart below from page two of our Morning Lineup report shows the daily overbought/oversold readings of the S&P 500 over the last year. The brief dip into neutral territory following Thursday’s rout didn’t last long as the S&P 500 closed back at overbought levels yesterday and with futures currently up over 3%, we’re only moving further back into overbought levels now.
