Small Business Still Swimming
The NFIB’s reading on small business optimism was unchanged in October. The headline index held steady at 104 which was slightly worse than expectations for a small increase to 104.1. While not higher or lower, the index remains around similar levels to just before the pandemic began and at the low end of the past few year’s range.
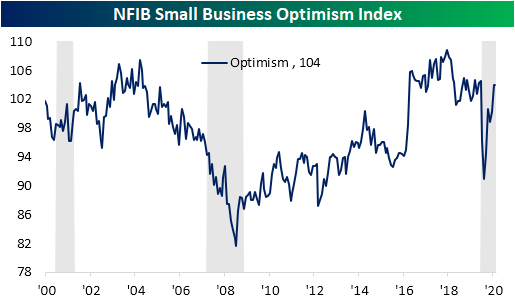
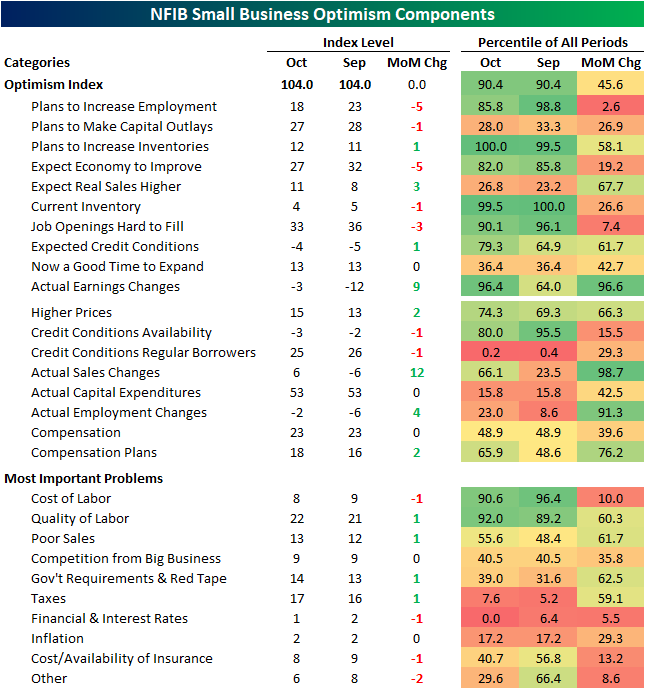
That low end of the past few years’ range is also at the high end of the historic range. At 104, the headline index is still in the top 10% of all readings. With no change in October, breadth among the components was mixed, but most indices were still indicative of more companies reporting stronger conditions on a net basis, albeit not at the same pace as September. Of the ten indices that comprise the headline number, half fell versus September’s levels, one was unchanged, and four were higher.
For the labor market as a whole, multiple indices were not as strong as September, but the readings were still indicative of improvement. Even as the index for Plans to Increase Employment declined five points, there are still more companies expecting to increase hirings than decrease them. Meanwhile, fewer companies are reporting realized decreases in employment as the index for Actual Employment Changes rose 4 points to the strongest level in seven months. That is still consistent with more firms on net basis reporting decreases in employment over the past three months. Additionally, a third of companies continue to report that job openings are hard to fill (down 3 points from last month). 48% of responding firms also reported that there are few or no qualified applicants for their positions, and 87% of firms report that they are currently hiring or trying to hire. In other words, while plans to increase employment are not as strong as they were in September, hiring troubles rather than layoffs appear to a bigger factor. Also, an increasing number of businesses plan to raise hiring in the near future. Given this, a net 18% of firms report that they plan to increase compensation plans with a net 23% raising compensation in October, the same net percentage as September.
As employment metrics are fairly strong, a higher share (net 11% vs 8% last month) of companies reported that they expected sales to be higher. Meanwhile, the index for Actual Sales Changes rose 12 points – tied for the fourth largest MoM gain on record. That was the first positive reading since March. With demand appearing strong, the index for Plans to Increase Inventories reached a record high in October which is a positive for growth going forward. Click here to view Bespoke’s premium membership options for our best research available.

Policy Uncertainty Spiked Into the Election
For the month of October, the NFIB’s reading on small business sentiment was unchanged at the headline levels but many of the sub-indices broadly pointed to further improvements in business conditions. That is not to say small businesses do not have their share of concerns. As shown in the chart below, the NFIB’s index on Economic Policy Uncertainty rose another 4 points in October to 98 which is the second-highest reading on record behind November of 2016; around the time of the last presidential election.
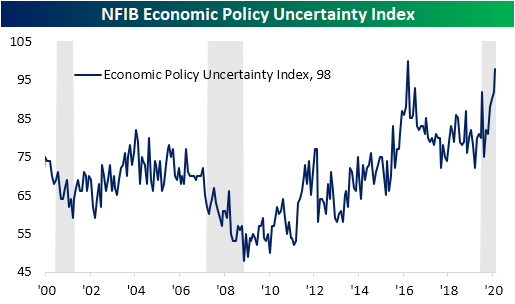
The election played a role in the uncertainty as 31% of small businesses surveyed reported government-related concerns as their biggest problem in October (lower chart). That was up for the second month in a row and is around the high end of the past couple of year’s range. Additionally, as discussed earlier, labor also dominates the minds of small businesses as small businesses report struggles in filling roles. 30% reported cost or quality of labor as the single most important problem (top chart). That is unchanged since August.
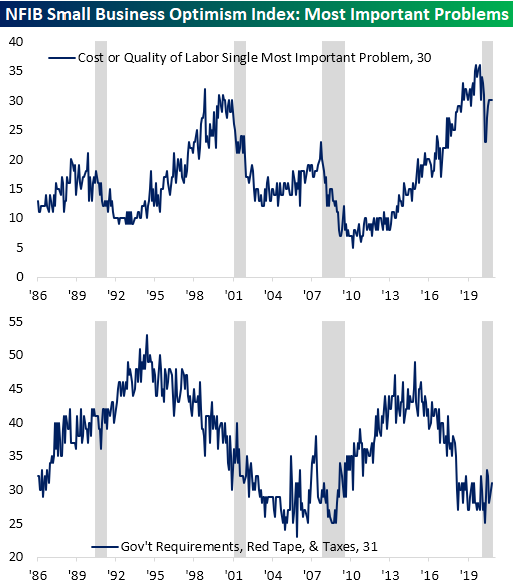
As for the other problems, poor sales remain elevated but were improved again in October dropping one percentage point to 13%. Click here to for a full access free trial to our research and interactive tools.

Big Milestone For Small Stocks
No US equity index has reacted more strongly since Election Day than the Russell 2000 small-cap index. As shown in the chart below, the index finally broke out above its highs from earlier in the year following Monday’s positive vaccine news. After that move on Monday, the Russell 2000 was up over 10% in just the last six trading days.

In just about any other year besides 2020, a 10%+ move in the Russell 2000 would be an extraordinary move, but this year the most recent move is actually the sixth one of at least that much. In fact, coming out of the March lows, the Russell saw three six-day moves of 19.1%, 16.3%, and 14.8%, respectively. The frequency with which we’ve seen these 10%+ moves in the Russell 2000 over a six-day period has been unlike any other year in the Russell’s history. Behind 2020, the year with the next highest total of 10%+ moves was 2011 (4) and then 2008 (3), and the most there has been in any twelve-month rolling basis is five spanning late 2008 through the first half of 2009. Click here to for a full access free trial to our research and interactive tools.

Bespoke Stock Scores — 11/10/20
Chart of the Day: Energy Sector Catches a Break
Bespoke’s Morning Lineup – 11/10/20 – Rotation Continues
See what’s driving market performance around the world in today’s Morning Lineup. Bespoke’s Morning Lineup is the best way to start your trading day. Read it now by starting a two-week free trial to Bespoke Premium. CLICK HERE to learn more and start your free trial.
“The truth is, we know so little about life, we don’t really know what the good news is and what the bad news is.” – Kurt Vonnegut Jr.
The whipsaw rotation in the wake of yesterday’s vaccine news once again has cyclical stocks doing relatively well this morning while the technology stocks are getting crushed. What is good news for the broader economy, has actually been bad news for this year’s biggest winners. NFIB’s small business sentiment was unchanged but came in slightly lower than expected. The only other economic data point on the day is JOLTS data at 10 AM.
Be sure to check out today’s Morning Lineup for a rundown of the latest stock-specific news of note, discussion of vaccine news, sentiment data in Germany, trends related to the COVID-19 outbreak, and much more.

Yesterday was really an interesting day in the equity market. On the upside, 34 stocks in the S&P 500 were up over 20% in a single day, and yet despite those extraordinary gains, all but one of those stocks (EXPE) is down YTD by an average of 36%. More broadly, of the 100 best-performing stocks in the S&P 500 only six are up this year- even after taking into account yesterday’s gains. On the downside, there were 22 stocks in the S&P 500 that were down over 5%, and all but one of those stocks are up YTD by an average of 45%. Again, only ten of the 100 worst-performing stocks in the index yesterday are down YTD.
If the majority of the stocks in your portfolio were up yesterday, that’s good news. The bad news is that it also probably means that you were sitting on big losses YTD. Conversely, it’s never fun to look at a portfolio of stocks that’s down on a day when the market is up. The good news, though, is that if you’ve been hanging onto those names for a while now, you probably haven’t seen a lot of days like yesterday.

Daily Sector Snapshot — 11/9/20
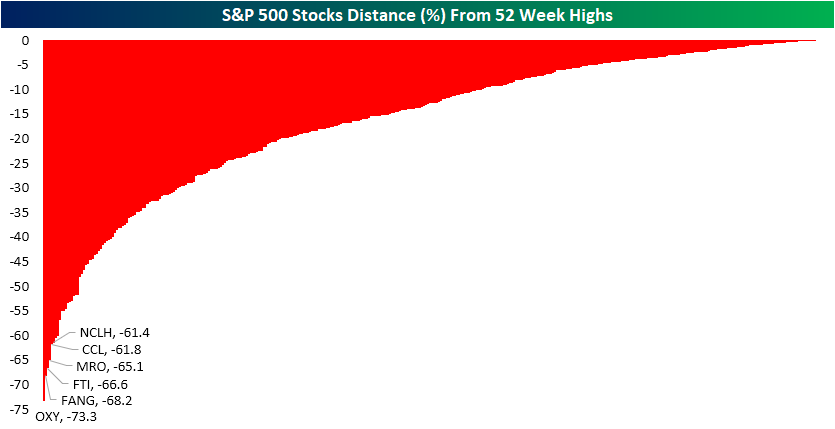
New High in New 52 Week Highs
As equities and other risk assets surge, a massive number of S&P 500 stocks are hitting new 52 week highs today. As shown in the chart below, as of midday 27.92% of S&P 500 stocks have reached new 52 week highs today and just one stock, Biogen (BIIB), is reaching a new 52 week low. The net reading of 27.72% is the highest reading for net new highs since January of 2018. Prior to that, you would need to go all the way back to May 22nd of 2013 to find the last time there was such a high reading.

Looking at the best-performing stocks in the index today, the list is mostly comprised of the stocks that have been extremely beaten down in the COVID economy like energy, travel, and retail/retail real estate names. Despite this, some still find themselves as some of those furthest below their 52-week highs. Take for example Carnival Cruiselines (CCL). The stock is seeing a phenomenal 35% gain just in today’s session, but even at today’s highs it was still well over 60% below its high for the year. It is a similar story for CCL’s peer, Norwegian Cruise Line Holdings (NCLH) which is up 27.78% but was 61.4% from its highs at its best price today. On the other hand, there are 28 stocks that have come within 1% of their 52-week highs at their high prices today. Another 80 stocks have come within 5% of their 52-week highs at their intraday highs today. Click here to view Bespoke’s premium membership options for our best research available.
The Biggest Winners Are Still Big Losers
With household names like Carnival (CCL), Wynn Resorts (WYNN), Simon Property (SPG), and Royal Caribbean (RCL) all up over 20% today, more than a few people out there are probably kicking themselves for not owning any of them. But before you start ripping your hair out, keep in mind that just about all of these stocks are down (and in a big way) on the year. Of the 33 stocks in the S&P 500 that are up over 20% following today’s vaccine news, all but one of them are still down year to date. The only exception is Expedia (EXPE), which even after a 20%+ gain is still up just 18% on the year.
In terms of sector representation, Energy tops the list with more than a third of the names (12) on the list. Behind Energy, Real Estate (8), Consumer Discretionary (6), and Financials (6) are the only other sectors with multiple stocks listed.

Just as the best-performing stocks are all still underperforming the S&P 500 on a year to date basis, the biggest losers today are among the year’s biggest winners. There are 25 stocks in the S&P 500 that were down on the day as of the middle of the afternoon, but the only one that is down on the year is Biogen (BIIB), a stock whose decline has nothing to do with the vaccine news. Including BIIB, the 25 biggest losers are still up an average of 41% YTD (median: 31%). Behind BIIB, the two worst-performing stocks in the S&P 500 today are Pool (POOL) and Etsy (ETSY). Both stocks are down over 10% on the day, but for the year are still holding onto gains of 56.4% and 190.5%, respectively. Click here to view Bespoke’s premium membership options for our best research available.

Dollar Down, Internationals Up
While risk assets are continuing their recent move higher today, the US dollar (as proxied by Bloomberg’s dollar index) is also reversing higher as it looks to end a four-day losing streak. As shown in the chart below, last week saw the dollar drop 1.93%; its worst stretch of five days since June 1st. While today’s rally is reversing some of those losses, last week’s move resulted in a break below support from the consolidation that had been occurring since mid-summer when the dollar fell below late 2019 lows. Although it is off the lows today, the dollar is currently around some of its lowest levels of the past two and a half years.

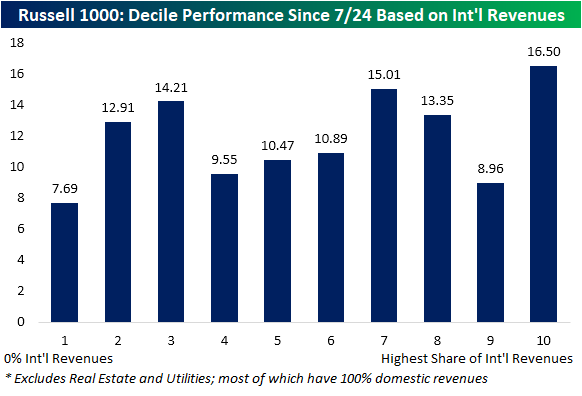
Assuming the dollar fails to move back above that prior support level, a weaker dollar means more attractive prices for US goods for foreigners, and as a result, that could bode well for companies with more international revenue exposure. Recently, that theory has held up fairly well. Using data from our International Revenues Database, in the chart below we created a decile analysis for performance since 7/24 (when the dollar first closed below December 2019 lows) of Russell 1000 stocks based on each stock’s percentage share of revenues that come from abroad. This excludes stocks in the Real Estate and Utilities sectors which generally have nearly all revenues coming from the US. As shown, since the dollar has been pressing to new multi-year lows, the group of stocks that has been the best performers have been those with the highest share of international revenues with an average gain of 16.5% since 7/24. Conversely, the 1st decile comprised of only the stocks with zero international revenues have underperformed with only a 7.69% gain. While not a perfect relationship given some outperformance of the second and third deciles and weakness of the ninth decile, at least at the extremes, more internationally exposed companies have been the top performers since the dollar’s leg lower earlier this year. Click here to view Bespoke’s premium membership options for our best research available.