“The Captain Has Turned on the Fasten Seat Belt Sign”
Since most of us haven’t been on planes in quite a while, it’s been some time since we last heard the above statement warning of turbulence ahead. If only we had one for the market. While there’s still another week left in the month, this September is on pace to be one of the most volatile in terms of the frequency of 1% daily moves (up or down) for the Nasdaq Composite. The table below on the left shows the daily percentage moves of the Nasdaq so far in September. Of the 17 trading days so far including today, all but three have seen one-day moves of at least 1%, and on one of those three days (9/2), the daily move was 0.98% or just shy of 1%. We would note that the Nasdaq has been fluctuating multiple times today between a move of above or below 1%, so depending on where things settle today, the percentage of 1% days this month will be either 82.4% or 76.5%.
If today’s move settles at 1% or more, this month will be on pace to rank as number eight in terms of the highest frequency of 1% daily moves (table on left). It is also on pace to be just the 24th month since 1970 where the Nasdaq moved 1% or more on at least three-quarters of all trading days. Looking through the table, the majority of other months were from the late 1990s through 2002, but there were also a handful of occurrences during the financial crisis and earlier this year.

The chart below of the Nasdaq since 1995 includes red dots indicating each month where the Nasdaq moved 1%+ on at least 75% of all trading days. During the run-up and crash from the dot-com boom, there were occurrences on both sides of the peak, but the vast majority of them came after the peak and then occurred periodically right up through the low in October 2002. During the Financial Crisis, there were four straight months of occurrences spanning October 2008 through January 2009. More recently, March of this year saw the fifth-highest percentage of 1% days at 86.4%, and then in April, just over 76% of all trading days saw 1% moves. With a number of indicators and trends in the market lately, the two periods that keep popping up are the late 1990s to early 2000s and the Financial Crisis, and in the case of a high frequency of 1% daily moves, the same can be said. Keep those air sickness bags handy! Click here to view Bespoke’s premium membership options for our best research available.
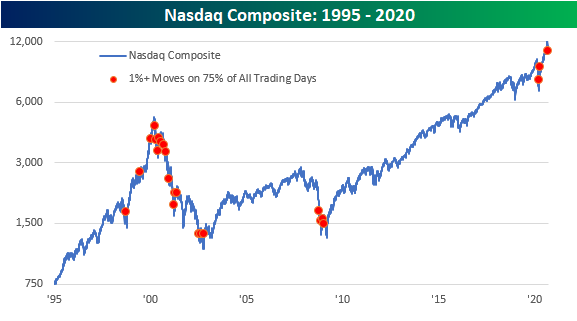
Chart of the Day: Navigating Renewables Stocks
Is Seasonality Driving Claims?
Seasonally adjusted initial jobless claims have stubbornly remained in the elevated upper 800K range with this morning’s release rising by 4K to 870K. That was worse than expectations of a reading of 840K which would have marked a 26K improvement from last week. While it was not an improvement, claims have been fairly stable with this week’s increase not being particularly large as it only leaves initial claims at their highest levels since the first week of September when they were at 893K. In fact, although comparisons to pre-September readings are not perfectly like for like on account of the recent changes to the seasonal adjustment methodology, since the pandemic began the only smaller weekly move was a 2K decline in mid-July.

On a non-seasonally adjusted basis, claims were also higher rising to 824.5K from a pandemic low of 796K last week. But just as with the seasonally adjusted number, that only brings claims to the highest level since two weeks ago. As shown in the second chart below, assuming this year follows the seasonal patterns that have been observed in the past, the 37th week of the year (last week) has, on an average basis, been the seasonal low for jobless claims with a steady rise in claims through New Year’s. That means that this week’s increase in non-seasonally adjusted claims could just as well be a factor of seasonality as a material worsening in the data.


Meanwhile, seasonally adjusted continuing claims also missed expectations of 12.275 million with a reading of 12.58 million. While higher than expected, that was lower from last week’s upwardly revised 12.747 million. Again, the caveat applies of comparisons not being perfectly like for like due to changes in seasonal adjustment, but that would mark the lowest continuing claims reading since the first week of April.

Although the headline number for initial jobless claims was higher this week, including Pandemic Unemployment Assistance (PUA) total claims were actually lower. Initial PUA claims fell from 675K to 630K marking the lowest level of PUA claims (as well as total claims) in a month. While that is still a massive number of people filing for unemployment, it is an improvement and puts this week’s print right inline with the average of what has been observed since the beginning of August.
As for continuing claims, there was a steep drop in PUA claims for the most recent week (the first week of September). Claims dropped from 14.5 million to 11.5 million. That is the fewest continuing PUA claims since the first week of August. Combined with the standard unadjusted continuing claims, there were 24 million total claims which, while still a massive number, is the lowest reading since April. Click here to view Bespoke’s premium membership options for our best research available.

Bespoke’s Morning Lineup – 9/24/20 – It Could Be Worse
See what’s driving market performance around the world in today’s Morning Lineup. Bespoke’s Morning Lineup is the best way to start your trading day. Read it now by starting a two-week free trial to Bespoke Premium. CLICK HERE to learn more and start your free trial.
“For September so far this year the spending by $BAC customers both on debit and credit cards is up–spending overall is up.” – Brian Moynihan, CEO Bank of America
Futures have been modestly lower for most of the morning, but we have a busy day of Fed speakers on the schedule, and jobless claims were just released. Both reports came in higher than expected. Initial claims came in at 870K versus expectations of 840K while continuing claims were more than 300K above consensus forecasts (12.58 million versus 12.275 million). The only other economic data on the calendar is New Home Sales at 10 AM (estimate – 890K) and KC Fed Manufacturing (estimate – 14).
While the labor market appears to be slowing, or even weakening a bit, it was somewhat encouraging to hear Bank of America CEO Brian Moynihan say in an interview on CNBC this morning that both spending and checking account balances in its customer accounts is higher this September than it was last September.
Be sure to check out today’s Morning Lineup for a rundown of the latest stock-specific news of note, market performance in the US and Europe, economic data in Europe, trends related to the COVID-19 outbreak, and much more.

Yesterday was a lousy day for bulls capping off what has been a lousy month. It could be worse. It has now been three weeks (14 trading days) since the S&P 500’s high on September 2nd, and during that span, the index has declined nearly 9.6%, which is just shy of the technical definition of a correction.
Now, rewind six months. Half a year ago this morning, we were all coming in to our desks (or more accurately, at our kitchen counters, a corner of the bedroom, or maybe down at a table in the basement) and looking at a market that had just lost more than a quarter of its value in the same span (14 trading days). By just about all accounts, things were looking bleak. In the six months that followed, though, the S&P 500 has rallied more than 40% in what, even after the declines of the last three weeks, has been one of the strongest six-month rallies in the history of the stock market.
In a B.I.G. Tips report yesterday, we looked at prior periods where the S&P 500 saw similar moves over a six-month stretch to see how the S&P 500 performed going forward. If you haven’t already, make sure to read it over.

B.I.G. Tips – This is No Way to Celebrate
The chart below shows the rolling six-month rate of change for the S&P 500 dating back to the late 1920s. Even after the declines of the last three weeks, the current rally off the March lows represents the strongest six-month rate of change for the S&P 500 since 2009, and before that, you have to go all the way back to the early 1930s. Additionally, the last six months now ranks as just one of nine periods in the S&P 500’s history where it rallied 40% or more in a six-month period. The declines this month haven’t been enjoyable, but let’s keep things in perspective.

In a newly published B.I.G. Tips report, we looked at prior periods where the S&P 500 rallied 40%+ in a six-month span to see how it progressed going forward. Did the rally borrow from future returns? Did is precede even more gains ahead? For anyone with more than a passing interest in what to expect going forward, make sure you check out this report. To see it, sign up for a monthly Bespoke Premium membership now!
Chart of the Day: Record Crash Concerns
Restaurant Stocks Getting Burnt
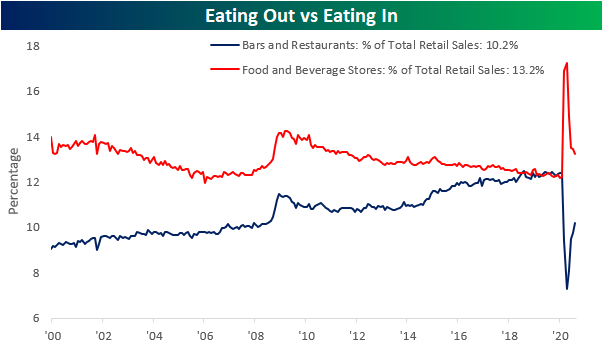
In our recap of last week’s retail sales report, we noted how there is evidence of a trend of Americans returning to spending habits prior to the pandemic. Namely, that can be seen through spending at bars and restaurants which was the strongest category in August having grown 4.71% month over month. The past decade has seen spending at bars and restaurants as a percentage of total retail sales gaining share and eventually overtaking spending at food and beverage stores. In other words, Americans began to spend more eating out than eating in; that is up until the pandemic. COVID’s reversal of this trend reached an apex in April, but more than half of that move has since been erased. Now bars and restaurants account for 10.2% of total retail sales versus 13.2% for food and beverage stores. So while bars and restaurants have taken a big hit and are far from out of the woods, recent months have seen improvements.
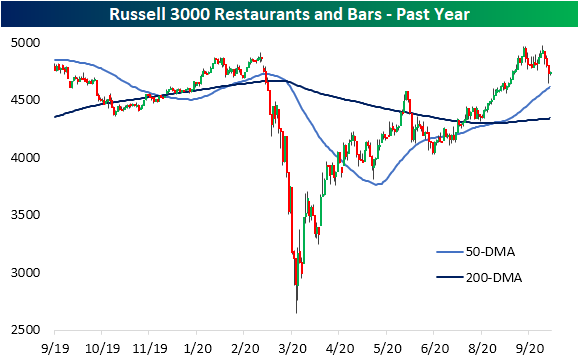
While aggregate spending data for bars and restaurants is not yet back to pre-pandemic levels, the Russell 3000 Restaurants and Bars group has managed to recover all of its COVID-Crash declines. Since its low in mid-March, the index has been trending higher having rallied 63.8%.
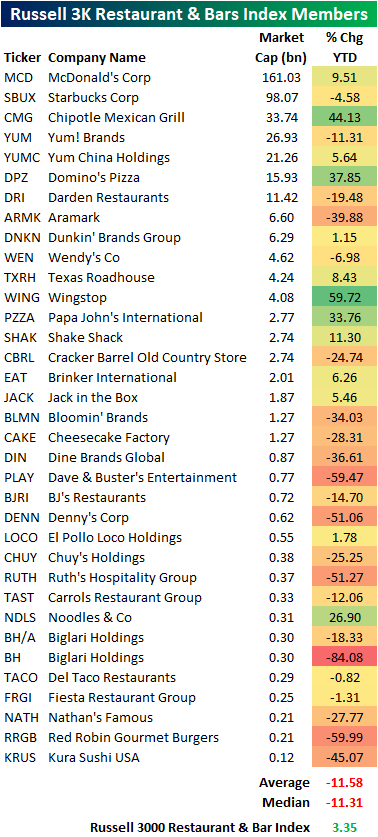
This index includes 35 stocks with a variety of niches ranging from fast food like McDonald’s (MCD) to coffee chains like Starbucks (SBUX) and Dunkin (DNKN) to less grab-and-go oriented chains like Dave and Buster’s (PLAY). Although the index may look like it has held up well at face value and is currently positive on a year to date basis, under the hood the individual stocks of the index are painting a weaker picture. Whereas the cap-weighted index is up 3.35% YTD, the average stock in the index is down 11.31%. In other words, the strength of the index is not so much a factor of broad strength of restaurant stocks, but instead is a result of solid performance of some key large-cap players like Chipotle (CMG), McDonald’s (MCD), and Domino’s (DPZ) to name a few. Click here to view Bespoke’s premium membership options for our best research available.
Bespoke CNBC Appearance (9/22)
Bespoke co-founder Paul Hickey appeared on CNBC’s The Exchange yesterday (9/22) to discuss the current setup of Apple (AAPL) and the broader market in general. To view the segment, please click on the image below. Click here to view Bespoke’s premium membership options for our best research available.

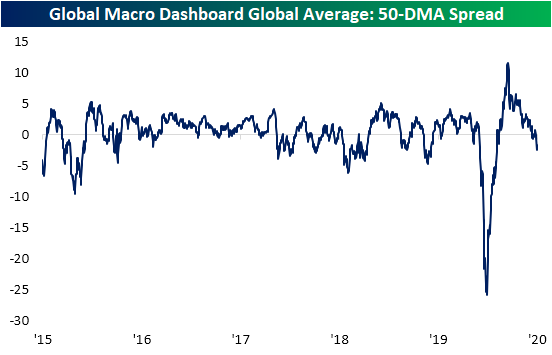
Mean Reversion Seen Around the Globe
Each Wednesday, we publish our Global Macro Dashboard which provides a high-level summary of economic and market indicators of 23 of the world’s largest economies. Included in this report we show the charts of each of these countries’ stock markets and glancing across these charts, the US has not been alone in falling back below its 50-DMA. In the chart below, we show the average distance to the 50-DMA of these 23 countries. At the start of the summer, the global average 50-DMA spread was at the highest levels of the past five years after hitting multi-year lows just months earlier, but through the summer that reading gradually moderated. With weakness in equities around the globe since the start of the month, the average global stock market was 2.43% below its 50-DMA as of yesterday’s close. That is the lowest reading since April. In other words, equity markets around the globe have mean reverted just like the US.
In fact, there are only a small handful of these countries that are currently sitting above their 50-DMAs. Of these Switzerland, Sweden, and Japan are further above at over 1% while Russia and South Korea are a more modest 0.1% and 0.3% above their 50-DMAs, respectively. For the US, this month’s declines only leave the S&P 500 roughly 1% below its 50-DMA which is actually one of the stronger readings (third highest) among countries that are trading below their averages. Currently, nine of these countries are more than 2% below their moving averages.

Although major global equity markets are generally together in sitting below their 50-DMAs, the US is coming from a much different place than most other counties. For starters, other than the US, only South Korea and Taiwan reached new 52-week highs in September while South Africa is the only other country to have seen a 52 week high since the beginning of August.
As shown in the table below, prior to the recent mean reversion (at the last high for the S&P on September 2nd), US equities were 9% above their 50-DMA. That compares to the global average of just 1.4% at the same time. The country that was the next most extended besides the US was South Korea at +4.8%. Since then, US equities have dropped 7.41%, with the month to date decline at 5.3% which is second only to Hong Kong’s 5.7% drop. In other words, equities around the globe have experienced mean reversion, but price action in the US has been some of the most dramatic and perhaps most justified. Click here to view Bespoke’s premium membership options for our best research available.

Nasdaq 100 Underwhelms
Not surprisingly, September hasn’t been a bull-friendly month for the Nasdaq 100. After a sharp decline from its record highs earlier this month, the index has made a series of lower highs and lows ever since. On 9/11, the Nasdaq 100 closed below its 50-DMA for the first time in several months, and while it quickly recovered above that level the following Monday, the bounce didn’t last for long. This Monday, the Nasdaq 100 kicked off the week with another lower low, and while it recovered from those lows, the bounce-back ran out of steam just shy of its 50-DMA. As far as technical patterns go, it’s never positive to see an index attempt to bounce back after breaking an uptrend only to see that rally run out of steam just shy of a key moving average. That’s the pattern shaping up for the Nasdaq now, though, and until the string of short-term lower highs and lower lows breaks, the burden of proof remains on the bulls.

For the broader market as a whole, the percentage of stocks trading above their 50-DMA has also started to dwindle. The chart below is from our Daily Sector Snapshot and shows the percentage of stocks in the S&P 500 finishing each day above their 50-DMA. Back in the early stages of the rally off the March lows, the percentage surged to just under 100%. From there, it started to drift lower, but even in early September more than three-quarters of stocks in the index were above their 50-DMAs. As September has progressed, however, the ranks of stocks above their 50-DMA have been more than cut in half to the current level of 35% – the lowest level in five months. Nothing goes up in a straight line, and pullbacks are part of the process, but September sure has been rough for many investors, who after the last few months may have forgotten that stocks do in fact move in two directions. Click here to view Bespoke’s premium membership options for our best research available.
