Optimism Comes Into the Light
Up until today, the S&P 500 has been somewhat wishy-washy on whether or not it was to stay above its 50-DMA. Despite that choppy price action in addition to a crazy few days of headlines ranging from the squashing then revival of hopes for a stimulus deal to the president’s contraction of and recovery from COVID, sentiment has seen a significant pick up this week. The American Association of Individual Investors’ weekly reading on bullish sentiment rose 8.5 percentage points this week to 34.74%. That is the highest level of bullish sentiment since the initial rally off the bear market lows on April 16th when bullish sentiment was only slightly higher at 34.86%. That 8.5 percentage point increase was also the largest one week rise in bullish sentiment since January when it rose 8.76 percentage points.

Those gains to optimism took from the bearish camp as bearish sentiment fell to 38.97%. Although the 4.1 percentage point decline was not particularly large—for example, less than a month ago we saw a larger 8.06 percentage point decline—bearish sentiment has fallen back below 40% for just the second time since mid-June; the other week below 40% being August 27th (39.62%). Bearish sentiment is now at the lowest level since June 11th.

With bullish and bearish sentiment at new highs and lows, respectively, the bull-bear spread has reached its least negative level since June 11th. At -4.23, the record streak of consecutive negative readings in the spread—meaning bearish sentiment outweighs bullish sentiment—is on the ropes, but still alive growing to 33 weeks long.

The gains in bullish sentiment also took from neutral sentiment as the percentage of investors reporting as such fell from 30.69% to 26.29%. That is the lowest level for neutral sentiment since a reading of 23.79% back in mid-July. It was also the largest single week decline in the reading since that same week. Click here to view Bespoke’s premium membership options for our best research available.

Claims Inch Their Way To A New Low
Last week’s Nonfarm Payrolls report was a bit of a mixed bag for the health of the labor market as it showed signs of slowing in the pace of the rebound in employment as permanent job losses have mounted. Initial jobless claims—updated Thursday morning—have been showing a similar story of further improvements but at a slowing pace. Seasonally adjusted claims for the most recent week came in at the lowest level of the pandemic at 840K. But, as has been the case for two-thirds of releases since the peak in claims in late March, that missed forecasts of a drop to 820K. Additionally, that only was a 9K decline from last week; the only smaller improvement for any week since the peak in claims was a 2K decline in the second week of July.
The undersized decline this week is an example of the general trend of slowing improvements in initial claims. Over the past two months, seasonally adjusted claims have averaged a decline of 1.54% week over week. That compares to mid to high single-digit readings throughout the summer and double-digit readings in the more immediate aftermath of the peak in claims back in the spring. Again, while those small improvements are still welcome as claims are at the lowest level of the pandemic, this week’s reading was still 145K above the previous record from before the pandemic (695K in October of 1982) and the slower rate of improvement only further prolongs the recovery.

On an unadjusted basis, claims actually rose 4.3K this week to 804K. Granted, that is not a particularly large increase. In fact, of all weeks that claims have risen WoW since the peak in the spring, this week’s 5K rise was the smallest. Another silver lining of this increase is that it is also consistent with seasonal patterns given claims typically rise from the fall through the end of the year. At the current level, unadjusted claims are basically right in line with the four-week moving average of NSA claims at 806K.

While initial claims have not been rapidly improving, continuing jobless claims (lagged an additional week to initial claims) have continued to fall at a healthier clip. Like seasonally adjusted initial claims, continuing claims are at the lowest level of the pandemic after falling by over 1 million this week. That is the largest WoW decline since August 21st. As previously mentioned, while initial claims have been improving at a slower rate, continuing claims look healthier (or less catastrophic!). The average WoW decline over the past two months now stands at over 4% which is the strongest rate since the first week of July.

Including other measures of unemployment insurance like Pandemic Unemployment Assistance (PUA), NSA claims were lower for both initial and continuing claims for the most recent week. In the case of initial claims, total claims (headline plus PUA) fell to a pandemic low of 1.27 million from 1.31 million last month. That decline was mostly driven by a drop in PUA claims which fell by 44.3K to less than 500K; the only other week with initial PUA claims below 500K was the first week of August. Lagged another additional week, continuing claims also fell to a new low of 23 million thanks to sizeable drops in both regular NSA claims (-808.7K) and PUA claims (-433.5K). Click here to view Bespoke’s premium membership options for our best research available.

Chart of the Day: Big Lots (BIG)
Bespoke’s Morning Lineup – 10/8/20 – More Stimulus Hopes
See what’s driving market performance around the world in today’s Morning Lineup. Bespoke’s Morning Lineup is the best way to start your trading day. Read it now by starting a two-week free trial to Bespoke Premium. CLICK HERE to learn more and start your free trial.
“I sometimes compare my brainstorming on paper to the drilling of oil wells. The only way to strike oil is to drill a lot of wells.” – Tom Monaghan, Founder Domino’s Pizza
Futures have been rallying all morning and are currently trading at their highs of the session. The catalyst this morning is – you guessed it – more stimulus hopes. In other news, IBM pre-announced better than expected results and said it would spin-off its managed infrastructure unit. In economic news this morning, jobless claims came in at 840K versus consensus forecasts for a level of 820K. Continuing Claims came in at 10.976 million which was much lower than forecasts for 11.4 million. Overall, a mixed bag but it’s encouraging to see continuing claims drop below 11 million for the first time since March.
Be sure to check out today’s Morning Lineup for a rundown of the latest stock-specific news of note, market performance in the US and Europe, trends related to the COVID-19 outbreak, and much more.

Small caps have been a disappointing area of the market for the last few years now, but the last few days have been a different story. Over just the last ten trading days, the Russell 2000 has rallied more than 10%. That’s the strongest 10-day rate of change for the index since the Spring coming off the COVID crash lows. While there have been plenty of other instances where the Russell 2000 saw a stronger 10-day rate of change, what makes the current period unique is that while most big rallies in the Russell 2000 have come after sharp declines, that wasn’t the case this time around.
The lower chart shows the Russell 2000’s 10-day rate of change going back to the start of 2018. In the rally off the March lows, the Russell 2000 had previously been down more than 30% over a 10-day period, and before that the 10%+ rally in early 2019 followed what was a 12% decline just before. The most recent rally, though, has been different. At no point in the last 50 trading days has the Russell 2000’s 10-day rate of change seen a decline of more than 5%. In other words, while most prior big short-term rallies have been a snapback from a prior decline, there was no big drop to snap back from this time around.

Daily Sector Snapshot — 10/7/20
Mortgage Purchases and Refis Flat
In Monday’s Closer, we discussed the details of the monthly Mortgage Monitor for the month of August from Black Knight. The report showed a further decline in the delinquency rate, albeit at a slower pace of improvement. Additionally, while lagged an extra month, the report also showed new mortgage originations for the month of July. Like most housing-related data, the report showed new originations continue to come in at a strong clip with the reading for the month of July rising to a 1.422 million; the highest since at least 2013.

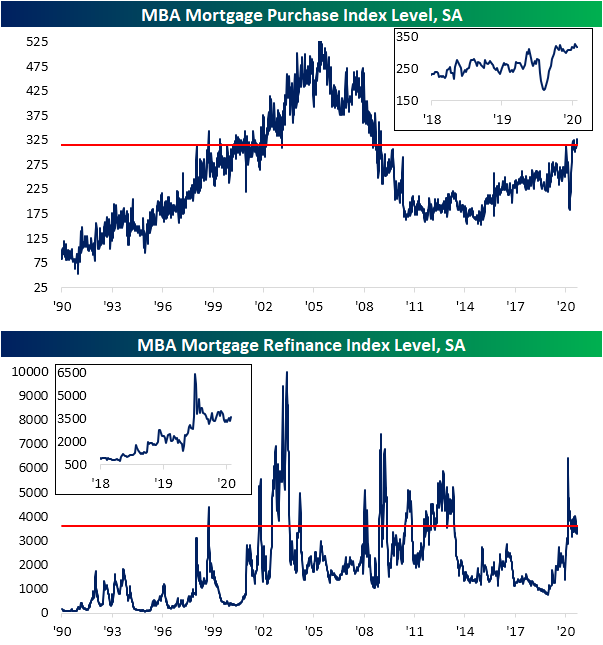
By the same token, the Mortgage Bankers Association’s indices of mortgage purchases and refinance activity (updated this morning) both likewise remain at very healthy levels. In the case of the Mortgage Purchase index, it has fallen in back to back weeks for the first time since the second half of July. But the1.5% decline this week and 1.9% drop last week have only brought the index as low as it was at the end of August. Overall, the index has been more or less trending sideways over the past few months, but that sideways move has been at very strong levels. In fact, outside of the higher readings earlier this year, the purchase index’s current levels are similar to those last seen in the first weeks of 2009. In other words, there has not been any significant increases or decreases in mortgage purchase and refinance activity in recent months, but activity remains very elevated relative to the past decade.
It is a similar story for the refinance index which rose over 8% this week to its highest level since mid-August as mortgage rates have shifted lower; the 30-year fixed rate national average has dropped roughly 5 bps from the late September peak. Just as with the purchase index, refinancing activity has been off the highs and fairly stable over the past few months, but that is at some of the highest levels of the past several years.
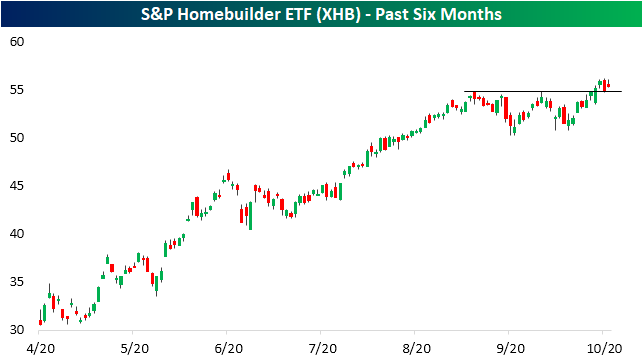
Similar to the indices from the MBA, the homebuilders have also hit a bit of a plateau recently. In September, the Homebuilder ETF (XHB) had been in consolidation, but over the past few days, the Homebuilder ETF (XHB) has once again broken out and has so far successfully retested the prior September highs as support. Click here to view Bespoke’s premium membership options for our best research available.
B.I.G. Tips — One Year’s Losers Are Next Year’s…
Chart of the Day – “It’s Always Tease, Tease, Tease”
Investor Actions Speak Louder Than Words
The TD Ameritrade Investor Movement Index is a proprietary, behavior-based index created by TD Ameritrade designed to indicate the sentiment of individual investors’ portfolios. It measures what investors are actually doing with their money as opposed to other sentiment surveys based on what investors say they’re doing with their money. While a number of sentiment indicators only ask investors how they feel about the market, this index sheds a bit more light on their actual actions.
Based on the latest results of TD Ameritrade’s index, investors remain increasingly optimistic even after September’s pullback in equity markets. In this month’s update, the index climbed from 4.93 to 5.71. That’s the highest reading since October 2018 and the first time that the index topped its pre-COVID peak of 5.68 from back in January. With a long-term average level of 5.7, it’s hard to argue that investor sentiment remains subdued after this month’s update. That being said, the index has been higher than current levels a number of times over the last ten years. With equities right near record highs, you would expect sentiment to be optimistic, and now it appears that the wall of worry isn’t as high as it once was. Click here to view Bespoke’s premium membership options for our best research available.

Bespoke’s Morning Lineup – On and Off Again Stimulus Talks
See what’s driving market performance around the world in today’s Morning Lineup. Bespoke’s Morning Lineup is the best way to start your trading day. Read it now by starting a two-week free trial to Bespoke Premium. CLICK HERE to learn more and start your free trial.
“Never judge a potato by its skin. One day, it will be french fries.” – Ian Wilson
French fries are on our mind this morning due to the fact that one of the only companies reporting earnings is Lamb Weston (LW), which basically produces nothing but french fries and other frozen potato products. The company just reported results and exceeded EPS forecasts by 31 cents (0.61 vs 0.30) on stronger than expected revenues. How can you lose with french fries!
In other news this morning, futures have rebounded much of the late day declines towards the end of the day yesterday following additional tweets from the President where he has appeared to restart stimulus talks over Twitter after unilaterally canceling them earlier. Where this all ends up nobody knows, but the longer this drags on the less likely it is that anything gets done.
Be sure to check out today’s Morning Lineup for a rundown of the latest stock-specific news of note, market performance in the US and Europe, trends related to the COVID-19 outbreak, and much more.
From its afternoon high to the close yesterday, the S&P 500 declined more than 2%. Using our intraday database, we found that there were 62 other trading days since 1982 where the S&P 500 sold off more than 2% between its high in the last 90 minutes of trading and the close. In the chart of the S&P 500 below, we indicate each of those prior occurrences with a red dot. While these types of moves were common during the financial crisis, they have also occurred at a number of other more benign periods throughout the market cycle.
