Homebuilders Hot While Purchases Decline
The housing sector remains on fire and as such, homebuilder sentiment remains historically elevated. After falling for the past two months, the NAHB’s Housing Market Index experienced a small bounce in February. The index rose from 83 to 84 compared to expectations of no change. At 84, it is still 6 points below the November record high of 90, but that is also above any other reading in the history of the data prior to October.

The improvement in the headline number this month was driven entirely by higher traffic. That index was up 4 points month over month and now sits 5 points below November’s record high of 77. Meanwhile, of the other components, Present Sales went unchanged at 90 while optimism for the future was dented with that index dropping to a six-month low of 80. Again, although those readings have not improved, they remain historically strong.

As with the different categories of the report, the readings across the various regions’ indices were mixed. The West was the only region where homebuilder sentiment declined. Granted, that drop was only 1 point and at 91, the index still ties the pre-pandemic record high. Meanwhile, the South went unchanged and the Midwest experienced a small rebound.
One of the more notable changes of the whole report was sentiment in the Northeast. Even though it too has been at some of the strongest levels on record, over the past few months the region’s reading on homebuilder sentiment has been a significant laggard compared to the rest of the nation. From its high of 87 in October, the index for the Northeast fell 19 points through January. For comparison, in that same span, the Midwest index fell only 4 points while the South and West were up 1 and 3 points, respectively. In February, though, whereas other regions remain several points off their highs, the Northeast put in a new record high after lurching 21 points higher. The only times that this index has risen by more in a single month was in June (31 points) and July (22 points) of last year.

As for other housing data released this morning, the MBA’s weekly reading on mortgage purchase applications has continued to fall. Since the peak in mid-January, mortgage purchase applications have fallen nearly 14%, and the index now sits at the lowest level since the first week of November. Granted, that is still well above pre-pandemic levels, so it’s hardly a weak reading.

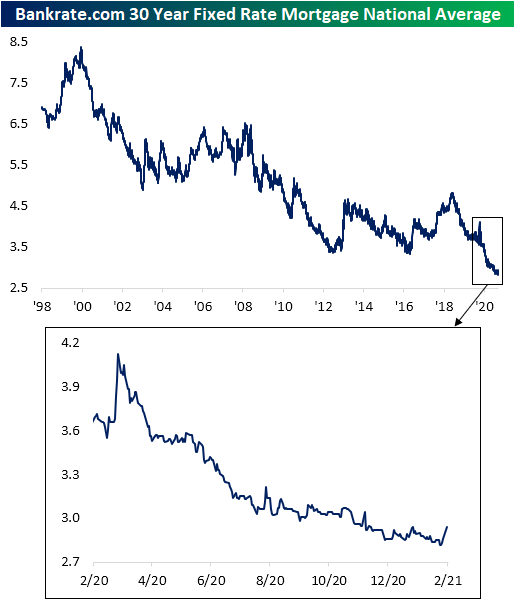
Higher mortgage rates likely in part played a role in that lower reading in mortgage applications. As shown below, with a broader rise in rates recently, the national average for a 30 year fixed rate mortgage has gone from a low of 2.82% just over a week ago to 2.94% yesterday; tied with January 12th for the highest rate since the end of November. That has also been the biggest one-week rise in the average mortgage rate since August.
Like the macro data released today, homebuilder stocks are in turn off their highs. After reaching extreme overbought levels last week at the top of its uptrend channel that has been in place over the past few months, the S&P Homebuilders ETF (XHB) has been mean-reverting over the past couple of days. With the downward move, the 50-DMA will be a support area to watch as it consistently has been since the summer. Start a two-week free trial to Bespoke Institutional to access our interactive economic indicators monitor and much more.
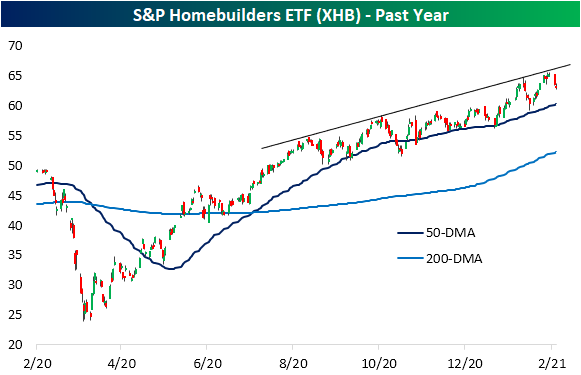
Chart of the Day: S&P 500 YTD Decile Analysis
B.I.G. Tips – Retail Sales Surge
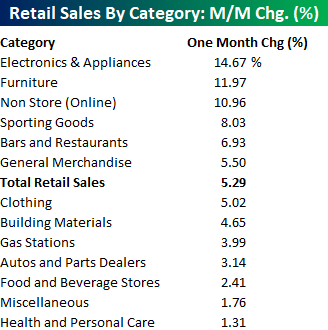
Based on the latest Retail Sales report for January, it looks like the $600 stimulus checks that were sent out to both struggling (and non-struggling) Americans in later December and early January achieved their purpose. After three straight weaker than expected reports, Retail Sales for the month of January blew the doors off estimates, surging by 5.3% compared to expectations for an increase of 1.1%. After stripping out Autos and Gas, the increase was even more at close to 6%.
To put this spread versus expectations into perspective, since the late 1990s, the only other times that Retail Sales topped expectations by more than four percentage points were last June coming out of the lockdowns and back in November 2001 after the 9/11 attacks. While December’s report was revised down, it did little to dent the positive impact of the January numbers.
Not surprisingly, breadth in this month’s report was perfect. Of the thirteen sectors that comprise the total pie, all of them were higher on a m/m basis led by Electronics & Appliances, Furniture, and Online, which all spiked more than 10%. If the distortions resulting from the COVID lockdowns weren’t so fresh in our collective memories, we’d be calling these types of moves historic. On the downside, Health and Personal Care was the weakest sector, and it still increased over 1%!
The characteristics behind the total level of sales have changed markedly in the post-COVID world. In our just-released B.I.G. Tips report, we looked at these changing dynamics to highlight the groups that have been the biggest winners and losers from the shifts. For anyone with more than a passing interest in how the COVID outbreak is impacting the economy, our monthly update on retail sales is a must-read. To see the report, sign up for a monthly Bespoke Premium membership now!
Bespoke’s Morning Lineup – 2/17/21 – Trends Come and Go
See what’s driving market performance around the world in today’s Morning Lineup. Bespoke’s Morning Lineup is the best way to start your trading day. Read it now by starting a two-week free trial to Bespoke Premium. CLICK HERE to learn more and start your free trial.
“Big market price changes happen when lots of people are forced to reevaluate their prejudices, not necessarily when the world actually changes – Colm O’Shea
Futures are little changed this morning, but that could change over the next 90 minutes as there’s a big slug of economic data on the calendar. Its starts with PPI and Retail Sales, which were just released. Both of these reports were gargantuan. Headline PPI came in at 1.3%, which was more than three times consensus expectations and the largest m/m increase in over ten years. Retail Sales were also much stronger than expectations. While economists were expecting the headline reading to rebound to 1.1% after three weaker than expected readings, the actual reading came in at 5.3%. Consumers were clearly ready to spend to start the year. When it comes to economic data, that’s not all either. At 9:15 eastern, we’ll get the latest updates on Industrial Production and Capacity Utilization, followed by Homebuilder sentiment at 10 AM.
Be sure to check out today’s Morning Lineup for updates on the latest market news and events, earnings reports from around the world, economic data out Asia and Europe, an update on the latest national and international COVID trends, and much more.

It may have just seemed like a late summer day at the time, but September 2, 2020 was a notable day for the market as it represented the beginning of the longest period of consolidation for the current bull market so far. After a solid and steady rally off the March lows, the S&P 500 traded in a sideways pattern for the next several weeks and didn’t make a new high for more than two months. While the market ultimately resumed its winning ways, as we all know now, the character of the rally changed considerably. The chart below shows the performance of S&P 500 stocks from the close on 2/19/20 through 9/2/20. The x-axis of the chart is sorted by market cap with the largest stocks as of 2/19/20 all the way to the left, and as you move to the right, market caps get progressively smaller.
During the 6.5 month stretch from 2/19/20 through 9/2 it was the mega-cap stocks that led the rally. While the ‘average’ stock was down 2.5% during that span, the five largest stocks in the S&P 500 (red bars) were among the best performers averaging a gain of 40.1% and ranking an average of 48 out of 500 in terms of performance.

Since 9/2, though, performance has changed considerably. While the ‘average’ stock is up 20.2% during this period, the same five stocks that led the market from 2/19 through 9/2 are barely higher, averaging a gain of 3.1% and ranking an average of 353 out of 500 in terms of performance.

Another way to illustrate the changing characteristics of performance since 9/2/20 based on market cap, the chart below shows the rolling 50-stock average performance based on market cap from 2/19/20 through 9/2/20 (red line) while the blue line shows the performance of these same stocks from 9/2 through 2/16. In each line, the left-most point shows the average performance of the 50 largest stocks in the S&P 500 (a/o 2/19/20) while the next point represents the average of stocks 2 through 51 and then all the way down the line.
Looking at the period from 2/19 through 9/2 (red line), the fifty largest stocks in the S&P 500 were among the best performing group of 50 stocks in the S&P 500 while the smallest stocks were among the worst performers. Since then (blue line), we’ve seen the complete opposite pattern play out as the 50 largest stocks in the S&P 500 have been the worst performers relative to every other rolling 50-stock group while the 50 smallest stocks have practically been the best performers.
At the time, September 2nd didn’t seem like an especially remarkable day in the market, but it represented a long-term shift in the performance of mega-caps relative to the rest of the market.

Daily Sector Snapshot — 2/16/21
Chart of the Day: Market Deja Vu
NY Manufacturing Finally Reaccelerating
This morning’s release of the New York Fed’s February manufacturing report handily topped expectations. Whereas the report was expected to see the headline number rise from 3.5 in January to 6, instead, it more than doubled those forecasts coming in at 12.1. That is the first m/m increase in the headline index since September and also brings the index to the highest level since July. Although the past few months have been consistent with decelerating activity, February did mark an eighth consecutive month of growth for the region’s overall manufacturing sector.

Although the index for General Business Conditions has finally risen and now sits at multi-month highs, it is still in the middle of its historical range. On the other hand, there are several categories in the top deciles of their historical readings as every category showed growth in February. In the case of the indices for Unfilled Orders and Inventories, these positive readings were the first since March of last year. The only index that was lower in February was for Shipments which fell 3.3 points to 4. The indices for expectations six months from now were similarly strong as there were only two indices (Shipments and Number of Employees) that were lower month over month.
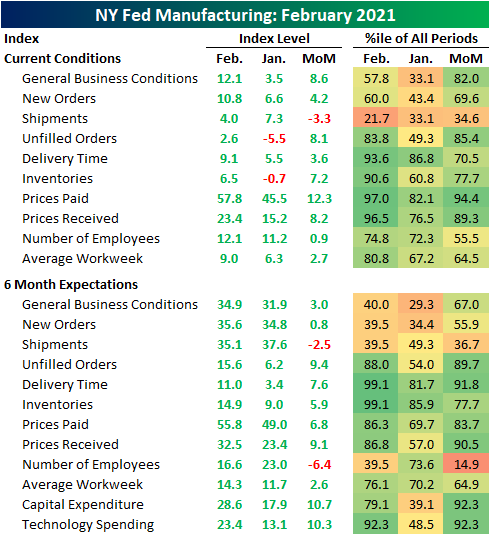
Overall order growth accelerated in February. The New Orders Index rose 4.2 points to 10.8 which is the highest level since October. Given the further growth in New Orders, Unfilled Orders also grew. As previously mentioned, this month’s 8.1 point month over month increase led to the first positive reading in this index in 10 months. Despite the growth in demand, Shipments experienced some deceleration albeit they are still growing. The index was also the only one in the report to fall month over month. Its 3.3 point drop leaves it in the bottom quartile of historical readings. Part of the reason for the slowdown in shipments could be supply-chain related given manufacturers in the region reported longer lead times as evident through the higher reading in the Delivery Time index. Rising 3.6 points to 9.1 in February, the index is at the highest level since August of 2018. The index for expectations six months out was even higher in the top 1% of all monthly readings as it reached 11- the highest level in three years.

Not only are products taking longer to reach their destination but manufacturers are also paying more for them. The index for Prices Paid rose to the top 3% of all readings reaching the highest level since May 2011. Those higher prices appear to be getting passed along to customers as well with the index for Prices Received also rising to the highest level since May 2011.

With firms generally remaining optimistic for the future, expectations for Capital Expenditures and Technology Spending have picked up. The latter has reached its highest level in two years while the index for Technology Spending is at the highest level since December 2019. Click here to view Bespoke’s premium membership options for our best research available.

Bespoke Stock Scores — 2/16/21
Small Cap Growth Taking the Lead
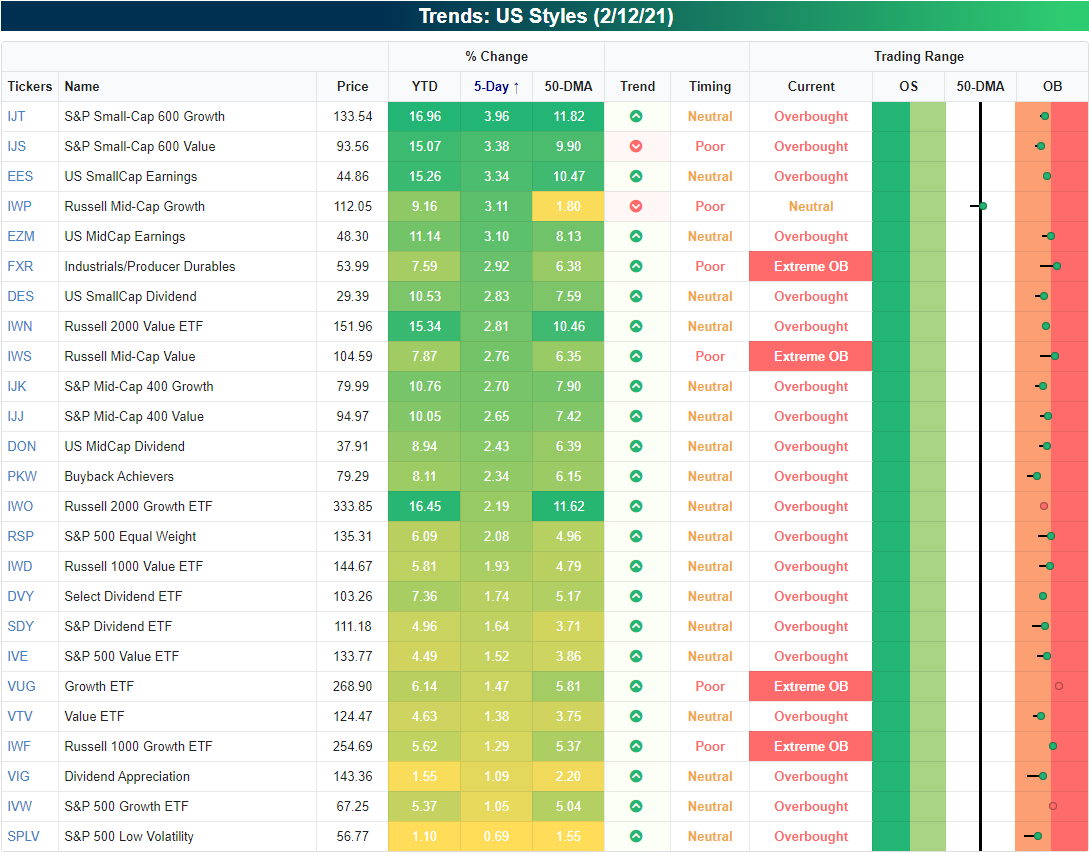
One of the topics we covered in last Friday’s Bespoke Report was the outperformance of small caps over the past year. Even on a much shorter time horizon, that outperformance has been evident. As shown in the snapshot of our Trend Analyzer below, in the five days ending last Friday and on a year to date basis, both Small Cap Growth (IJR) and Small Cap Value (IJS) have been two of the top-performing ETFs in our US Styles screen while large-cap counterparts have also been higher but with more modest gains. With a particular focus on growth stocks, while the S&P SmallCap 600 Growth (IJT) ETF was up the most of these ETFs last week with a 3.96% gain, the S&P 500 Growth ETF (IVW) was the second-worst performer after ‘only’ rising 1.05%. That continued a trend that has been in place YTD with the performance spread between the two ETFs topping ten percentage points.
We are coming up on the one-year anniversary of the last highs on February 19th, 2020 just before the COVID crash. For most of the past year since then, large-cap growth (IVW) had actually been outperforming small-cap growth (IJT), but since the new year began, small-cap growth has jumped ahead. Now, the S&P Small Cap Growth ETF (IJT) is up 35.31% since the 2/19/20 high compared to a 28.16% gain for the S&P 500 Growth ETF (IVW). As shown in the second chart below, IJT had been catching up on IVW for some time now though. The relative strength line of IJT versus IVW had been in a downtrend for most of the past five years meaning large-cap growth had been generally outperforming the small-cap counterpart. Since the lows last March, the line trended sideways meaning neither one saw significant outperformance, but come the fall, the line has taken off in favor of small caps. With more outperformance in the past week and a half, that line has turned sharply higher once again reaching the highest level since December of 2019 last week. Click here to view Bespoke’s premium membership options for our best research available.

Bespoke’s Morning Lineup – 2/16/21 – While You Were Out
See what’s driving market performance around the world in today’s Morning Lineup. Bespoke’s Morning Lineup is the best way to start your trading day. Read it now by starting a two-week free trial to Bespoke Premium. CLICK HERE to learn more and start your free trial.
“Finance is not merely about making money. It’s about achieving our deep goals and protecting the fruits of our labor. It’s about stewardship and, therefore, about achieving the good society.” – Robert J. Shiller
While you were on vacation over the long weekend, global risk assets continued to rally around the world. The most notable of these advances may have been bitcoin, which rallied right through this morning and briefly touched $50K before pulling back a bit in the time since. While it may have been nothing more than a coincidence, we couldn’t help but notice seeing headlines from St. Louis Fed President Bullard saying that the FOMC isn’t even thinking about thinking about raising interest rates interspersed with headlines regarding Bitcoin’s topping of $50K. In economic news this morning, the only data point was the Empire Manufacturing report which came in at twice the consensus forecast (12.1 vs 6.0), so the manufacturing sector appears to remain strong.
Be sure to check out today’s Morning Lineup for updates on the latest market news and events, earnings reports from around the world, economic data out of the UK, an update on the latest national and international COVID trends, and much more.
It was another strong week for global equities last week. While small caps led the way in the US, every US index ETF that we track in our Trend Analyzer tool posted positive returns. Micro-Caps, as measured by IWC surged 3.85%, but large and mega-cap ETFs were all up less than 1.5%. While the gains are fun if you’re long, market rallies inevitably cause short-term overbought conditions, and that’s exactly the environment we find ourselves heading into the holiday-shortened week. Every index ETF we track is currently at least at overbought conditions and seven are at ‘extreme’ levels. These types of overbought conditions ultimately need to be worked off through either a correction in time or price, and that’s why seven of the ETFs have timing scores that rank as ‘Poor’ while the rest are all neutral.
