Triple Plays Chart Update
The earnings calendar has been quiet, and it will remain that way until the second half of the month when the Q1 earnings season really kicks into gear. When it comes to earnings, the 3 month rolling EPS beat rate and guidance spread have pulled back significantly over the past few months. Granted, both of these as well as the sales beat rate remain at levels well above typical levels. As such, there have been a huge number of triple plays over the past three months, 268 of the total 2048 reporting companies to be exact. A triple play is when a company reports better than expected sales and earnings while also raising guidance. Typically, this can be viewed as a sign of fundamental strength for a company.
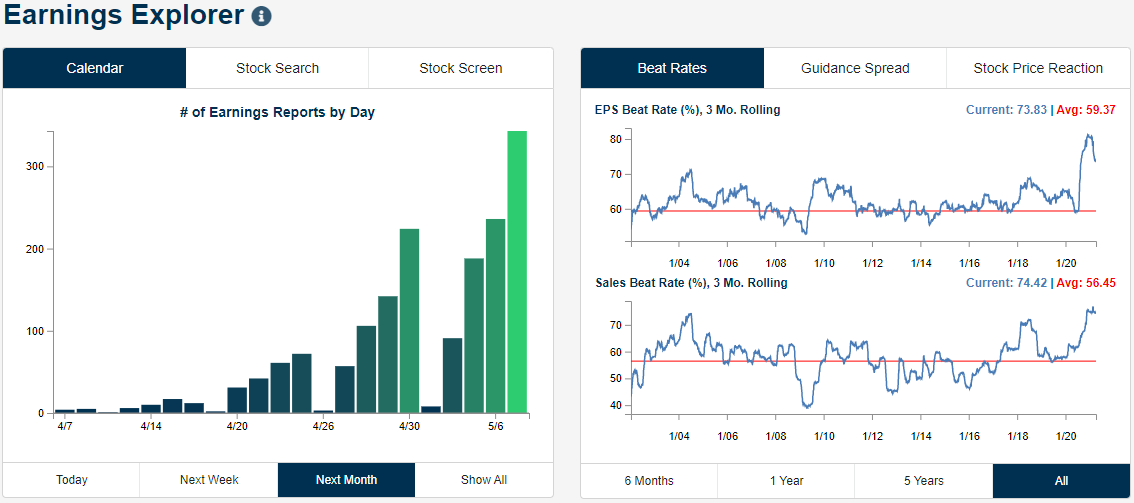
Looking over those triple plays, the average stock that has reported a triple play over the past three months rose over 3% on its earnings reaction day with 64% finishing the day in the green. That positive performance has tended to continue in the weeks after earnings although there have been some that have recently been consolidating. In the charts below, we show a handful of these. Some like Abbott Labs (ABT) and Perficient (PRFT) have been in short-term downtrends that have brought them back down to support around their 50-DMAs. Others like Analog Devices (ADI), Broadcom (AVGO), and Crocs (CROX) have been stuck under resistance over the past several weeks but have made attempts to break out in the past few days. For all of these, there has yet to be a decided move either to the up or downside.

While the names above have yet to break out of their consolidation ranges, there are a number of recent triple-plays that have successfully managed to break out to the upside. For a recap of those names, make sure to log in. If you aren’t currently a client, sign up for a free trial to one of Bespoke’s research offerings.
As Close to a Perfect Year For Equities as You Can Get
Every day in our Morning Lineup, we provide a technical snapshot of the market looking at various metrics. One chart we show is the relative strength of stocks (S&P 500) versus bonds (US Treasury Long Bond Future) over the trailing 12 months (chart below). Whenever the line is in the green area, it indicates that stocks are outperforming bonds relative to the start date, while readings in the red zone indicate bonds outperforming stocks. What stood out about the chart in this morning’s report was the fact that relative to one year ago (4/1 close), stocks have been outperforming bonds every day since. Sure, there have been periods in between where bonds outperformed stocks (falling line), but from a longer-term perspective, it has been about as perfect a year for stocks relative to bonds as you could imagine.
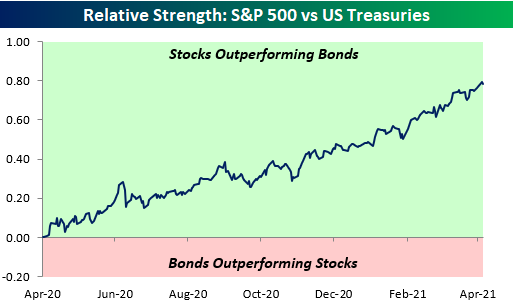
The chart below shows the performance of both asset classes individually over the last year. If you think the divide between political parties in the US has ripped wider, it has nothing on the growing divide between stocks and bonds. While the S&P 500 is up over 50%, the US Treasury Long Bond Future is down 14%. If we had to bet on which divide will start to narrow sooner, is there anything closer to a sure thing than taking the stock vs bond divide over the Democrat vs Republican divide? Click here to view Bespoke’s premium membership options for our best research available.

Bespoke’s Morning Lineup – 4/7/21 – The CEOs Speak
See what’s driving market performance around the world in today’s Morning Lineup. Bespoke’s Morning Lineup is the best way to start your trading day. Read it now by starting a two-week free trial to Bespoke Premium. CLICK HERE to learn more and start your free trial.
“The discipline of writing something down is the first step toward making it happen.” – Lee Iacocca
CEOs of two of the largest companies in the US are making headlines for recent comments this morning; one in a blog post and the other in his firm’s annual letter.
First, despite disagreement even within the Democratic caucus, Amazon CEO Jeff Bezos came out in support of the Biden Administration’s plan to boost investment in US infrastructure. Realizing the costs involved in such a plan, the Amazon founder noted in a blog post that “we’re supportive of a rise in the corporate tax rate.” While cynics would say that AMZN doesn’t pay corporate taxes so why should it care, we would note that the company has in recent years seen its tax bill go up as it has become more profitable. The rate is still very low, however, as in 2020, the company’s effective tax rate was 9.4%.
The second CEO making headlines this morning is JP Morgan Chase CEO Jamie Dimon. In the bank’s annual letter, Dimon expressed some concerns about potential inflation due to stimulus hitting the economy as it is already starting to rebound. That could lead to higher interest rates ‘making things a little worse’. In terms of equity valuations, he noted that they are high by ‘almost all measures, excect interest rates’. Therefore, higher interest rates to combat inflation could be problematic for the stock market. The high valuations, though, could be justified if the multi-year boom in the economy that he expects ‘could easily run into 2023’ comes to fruition.
Read today’s Morning Lineup for a recap of all the major market news and events including a recap of Composite PMI data for March, US and international COVID trends as well as our series of charts tracking vaccinations, and much more.

After a strong start to the quarter in its first two trading days, US equities took a breather yesterday from what was and still is an extreme overbought condition. As shown in the chart below, the S&P 500 was more than 2.5 standard deviations above its 50-day moving average heading into yesterday’s trading, which was not only the most extreme overbought reading in the last year but also the most overbought level since February 2017. Extreme overbought readings don’t mean that the market has to immediately sell off, but it often suggests that a rally is due for a pause.

Daily Sector Snapshot — 4/6/21
Bespoke Stock Scores — 4/6/21
Bespoke Matrix of Economic Indicators – 4/6/21
Our Matrix of Economic Indicators is the perfect summary analysis of the US economy’s momentum. We combine trends across the dozens and dozens of economic indicators in various categories like manufacturing, employment, housing, the consumer, and inflation to provide a directional overview of the economy.
To access our newest Matrix of Economic Indicators, start a two-week free trial to either Bespoke Premium or Bespoke Institutional now!
Precious Metals Finding Support and Eyeing Breakouts
After a strong run in the first months of the pandemic, gold (GLD) has been in a downtrend since the summer erasing most of the past year’s move higher. While GLD is far from breaking its longer-term downtrend, the past few weeks have at least seen a bit more constructive price action with a potential double bottom forming. After trading deep into oversold territory in early March, GLD found at least a temporary bottom right around the lows of last sping’s range. Last Tuesday, there was another successful retest of those same support levels. Since then, GLD has pressed higher and is getting close to breaking out of the past few weeks’ consolidation range.

Elsewhere in the precious metals space, silver (SLV) has generally fared better over the past several months. While it hasn’t been pressing higher either, SLV has more or less been trending sideways since last summer’s high. Since late February, SLV had been heading back to the bottom end of its range, but like GLD, it recently found some support. SLV took a brief dip below its 200-DMA one week ago which snapped a streak of 217 consecutive closes above its long-term moving average; the third-longest on record since SLV began trading in 2006 as shown in the second chart below. That drop below did not last long though as SLV has since moved back above its 200-day. Now, it is sandwiched between its 200-DMA and 50-DMA; which it had previously failed to move above last month. Additionally, the move higher today is breaking the short-term downtrend that has been in place for most of 2021. Like gold, the overall longer-term picture for silver has a lot of room for improvement, but at least in the near term, there are some positives developing in the past week. Click here to view Bespoke’s premium membership options for our best research available.


Chart of the Day: Breakout Basket
Bespoke’s Morning Lineup – 4/6/21 – All Quiet on the Market Front
See what’s driving market performance around the world in today’s Morning Lineup. Bespoke’s Morning Lineup is the best way to start your trading day. Read it now by starting a two-week free trial to Bespoke Premium. CLICK HERE to learn more and start your free trial.
“How did you go bankrupt?”
“Two ways. Gradually, then suddenly.” – Ernest Hemingway, The Sun Also Rises
With little in the way of economic data today and earnings season not really kicking off until next week, it’s a quiet morning. Futures are modestly lower even as the 10-year yield is back below 1.7%. After being closed yesterday, European markets are back open this morning and making up for lost time by rallying in reaction to the strength in the US yesterday.
In SPAC news, NFTs may be the hot trend in the collectible space, but traditional baseball cards are the center of attention this morning as Topps has announced a deal to go public in a merger with Mudrick Capital. The deal for the maker of cards for baseball, most other major sports, and who can forget- Garbage Pail Kids- will be valued at $1.3 billion. You can also bet that at some point, they will be moving into the NFT space. Perhaps the most telling aspect of the SPAC environment these days is the fact that in an interview with Topps Chairman Micheal Eisner, he stressed that the company will be operating as a ‘real’ company.
Read today’s Morning Lineup for a recap of all the major market news and events including the latest Australian Central Bank decision, a recap of SENTIX investor sentiment surveys for April, US and international COVID trends as well as our series of charts tracking vaccinations, and much more.
The market may be quiet this morning, but there have already been plenty of fireworks to start the second quarter. While the two 1% gains came four calendar days apart, this is the first time that the S&P 500 has kicked off a new quarter with back-to-back 1%+ gains since Q2 2009! As shown in the table below, in the post-WWII period, there have only been seven other quarters that kicked off with back-to-back gains of at least 1%.
The table below shows the S&P 500’s performance in the week after each of those prior strong starts as well as its performance over the rest of the quarter. Over each of the time periods, the S&P 500 saw positive returns on both an average and median basis, and while the S&P 500 was up for the remainder of the quarter following each of the last four occurrences, in the three occurrences prior to 1987, it was down over the remainder of the quarter every time.
