Bitcoin in 2017 vs. Now
On the same day that Coinbase (COIN) is set to IPO, Bitcoin traded above $64,000 for the first time ever. The leader in the cryptocurrency space has gone on a massive run over just the past few months having more than doubled just year to date. Over the past year, bitcoin is up well over 800%.
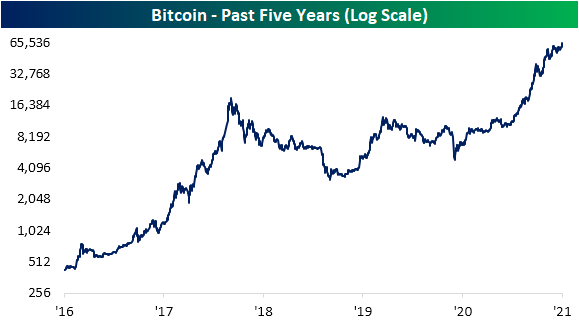
Those eye-popping returns in a relatively short span of time may seem like a bit of déjà vu from only a few years ago, but we would note that the comparison does not quite stack up. For starters, while Bitcoin has been a nine-bagger over the past year, the rate of change was much gaudier back in late 2017 when it rose upwards of 2,400% year over year by the time of its high around $19,000.

In the chart below we show the performance of Bitcoin in the year leading up to the December 2017 peak versus the run over the past year. Both runs are extremely impressive and at times have tracked each other fairly well, but there is one distinguishing difference. In weeks leading up to the prior peak in 2017, Bitcoin went into orbit gaining over 240% from mid-October to the December high. By comparison, Bitcoin is up only around 30% from mid-February through today.

In addition to the move having been smaller recently, Bitcoin also appears to have seen interest fall off. As shown below, Google Trends data showing searches for “Bitcoin” peaked in late 2017 at the height of the crypto craze as people rushed to learn about the asset. Search interest has been mostly muted since then, but it did pick up within the past several months. Bitcoin is on the tips of more tongues today especially given the direct listing of Coinbase (COIN), but Google searches for the crypto are still well below the highs from a few years ago and are even well below the more recent peak from the start of this year. In other words, from a sentiment perspective Bitcoin appears to be less of a frenzy now than it has been in the past. Click here to view Bespoke’s premium membership options for our best research available.

Chart of the Day – Coinbase (COIN) Goes Direct
Bespoke’s Morning Lineup – 4/14/21 – Banks Bring It
See what’s driving market performance around the world in today’s Morning Lineup. Bespoke’s Morning Lineup is the best way to start your trading day. Read it now by starting a two-week free trial to Bespoke Premium. CLICK HERE to learn more and start your free trial.
“No price is too great for a work of unquestioned beauty and known authenticity.” – J.P. Morgan
We’re still far from the peak of earnings season, but today has been the busiest day of the season so far. Of the six companies that have reported this morning, all six of them topped EPS forecasts while five out of six beat revenue expectations. Some of the largest banks and brokerages have been the headline reports this morning with Goldman Sachs (GS), JP Morgan (JPM), and Wells Fargo (WFC) all blowing away forecasts. Of the three, GS is the only one trading meaningfully higher while JPM is actually lower. As is typically the case with these big beats from the financials, there’s usually a ‘yeah but’.
Besides earnings, the economic calendar is light today with Import Prices the only report on the calendar. That will leave plenty of time for investors to watch the debut of Coinbase (COIN) to the public markets. The listing couldn’t come at a better time for the company as crypto-currencies have been on absolute fire with both bitcoin and ether trading at record highs and riding what looks to be their seventh straight day of gains. In the words of J.P. Morgan, no price these days seems to be too great for crypto assets. They may not have ‘unquestioned beauty’ but they do have ‘known authenticity’.
Read today’s Morning Lineup for a recap of all the major market news and events including a recap of the biggest overnight events including some key earnings reports, European Industrial Production, as well as the latest US and international COVID trends including our vaccination trackers, and much more.

We’ve been talking a lot lately about the market’s consistent gains during the trading day. One index which hasn’t been nearly as strong is small caps. The Rusell 2000 is currently more than 5% from its record high as a number of stocks in the index work off some of the big gains and overbought conditions from earlier this year. The chart below compares the Russell 2000’s price to its cumulative A/D line over the last year. Along with lower prices, breadth in the Russell 2000 has also been on the weak side. Would we prefer to see stronger breadth? Of course. On the flip side, though, there’s no indication in breadth that suggests material additional weakness underneath the surface.

Daily Sector Snapshot — 4/13/21
“How Much Was the Market Up Today?”
We’re old enough to remember when stocks would sometimes trade down when the market was open. These days not so much. For both the S&P 500 (SPY) and Nasdaq 100 (QQQ) tracking ETFs, there hasn’t been a single day since March 25th that either one closed the day lower than it opened. That’s an incredible streak of 13 straight trading days, and for both ETFs – which have been in existence for more than 20 years – it’s a record.
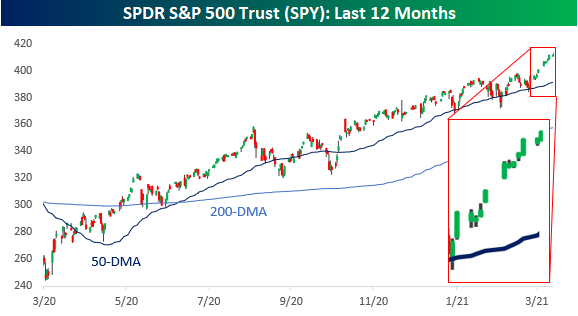

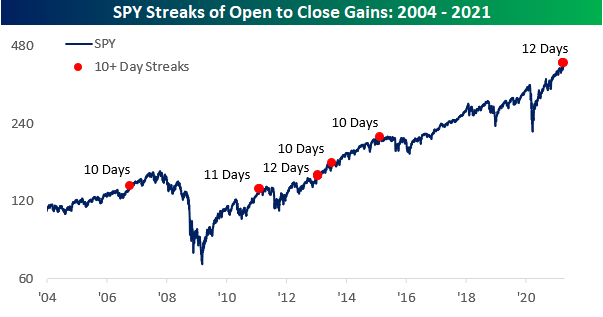
In the case of SPY, there have only been five other periods in the ETF’s history (all after 2005) where SPY was positive from the open to close for ten or more trading days. The prior record for consecutive open to close gains was 12 trading days back in January 2013, and the most recent was in February 2015 (ten trading days).
For QQQ, streaks of ten or more trading days of open to close gains have been a bit more common with eight prior streaks (again all after 2005). Prior to the current streak, there were two other streaks of 12 trading days (July 2009 and February 2017), but the most recent streak of 10 or more days was back in early December 2020.
Given the positive correlation between the S&P 500 and Nasdaq 100, you would think that, like the current streak, many of the prior streaks overlapped with each other. However, the only two periods besides the current one where there was any overlap between the two streaks was back in October 2006 and February 2015. If you remember the year that followed February 2015, unless you’re underweight equities, you’re probably not hoping for a repeat of that period. Click here to view Bespoke’s premium membership options for our best research available.

What Is Bothering Small Businesses?
In today’s Morning Lineup, we detailed some of the findings of the NFIB survey of small business optimism released this morning including the record high in businesses reporting jobs are hard to fill and how the survey results are usually tied to politics. In addition to optimism indices, the NFIB also surveys small businesses on what they consider to be their single most important problems. Considering a record number of responding firms reported that jobs are hard to fill, on a combined basis, 31% reported either the cost or quality of labor as their most pressing issue. While the reading for the quality of labor was unchanged at 24%, fewer firms reported the cost of labor as their biggest issue. Only 7% reported labor costs as their biggest problem in March compared to 9% the prior month. The percentage of firms reporting either cost or quality of labor as their biggest concern continues to sit off the respective peaks, but that is still at historically high levels.
The other area that has dominated businesses’ main problems concern taxes and government requirements. Following the election, the percentage of businesses reporting either of these issues as their biggest problem spiked to 35% in December. In the time since then, that move has reversed down to 31% in March with the readings for both taxes and government requirements falling one percentage point. At that level, the combined reading is the lowest since right before the election in October.
With both government and labor-related problems less on the mind of small businesses recently, it begs the question of what has replaced them. The more clear part of that answer is inflation. 4% of businesses reported inflation as their biggest issue which is consistent with the index for higher prices reaching its highest level since 2008. That compares to the previous month when only 2% of businesses reported inflation as their biggest concern. As for the larger and less clear change, 10% of businesses reported “other” as their biggest problem, up 4 percentage points from the previous month. The ‘other’ category is poorly defined as to what it encompasses, but it could be a range of factors. Based on events in the month of March, we can speculate that they could include supply chain issues given the blockage of the Suez Canal and the semiconductor shortage. Click here to view Bespoke’s premium membership options for our best research available.

Bespoke CNBC Appearance (4/12/21)
Bespoke co-founder Paul Hickey appeared on CNBC’s Closing Bell on Monday (4/13) to discuss markets heading into earnings season. To view either of the segments click on the links or image below. Click here to view Bespoke’s premium membership options for our best research available.
Closing Bell: Intel’s Plans to Invest in American Chip Fabs

Bespoke Stock Scores — 4/13/21
People vs Parcel Transporters
One of the hottest areas of the market heading into this week was the Transports as the Dow Transportation Index was riding a streak of ten straight positive weeks- its longest weekly winning streak since 1989. The index is down so far this week, so unless it can turn things around, the weekly streak will end just one shy of the 11-week record in 1989. This week’s decline aside, if you are a follower of Dow Theory, the strength in the Transports is positive.
![]()
The snapshot below is a custom portfolio of the members of the Dow Transports from our Trend Analyzer and is sorted by YTD performance. Topping the list are shares of Avis Budget (CAR) which has more than doubled YTD. Like CAR, most of the index’s biggest winners have also been beneficiaries from the re-opening trade as American Airlines (AAL), JetBlue Airways (JBLU), Alaska Air (ALK), and Southwest Airlines (LUV) round out the top five. While re-opening stocks focused on transporting people have seen the biggest gains YTD, companies focused on the transportation of goods have lagged. At the bottom of the list, shares of CH Robinson (CHRW(, United Parcel Service (UPS), Union Pacific (UNP), and CSX are all up less than 10% YTD.
![]()
As mentioned above, the recent strength in the Transports has been led by ‘people’ rather than ‘parcel’ transporters, but it’s interesting to see how leadership has shifted over time. We broke out the Dow Transports based on those that transport people (CAR, ALK, LUV, UAL, DAL, AAL, and JBLU) versus those that transport stuff (all the others) and then calculated the relative strength between the two baskets. In the chart below, a rising line indicates outperformance on the part of ‘people-movers’ versus ‘parcel-movers’ and vice versa. In the early days of the pandemic even before the lockdowns started and the WHO declared a pandemic, the ‘people-movers’ cratered on both an absolute and relative basis. They continued to drop after, and it wasn’t until mid-May that they finally bottomed on a relative basis. The period from late May through early June was strong for the ‘people-movers’, but as the summer wave accelerated, they quickly ran out of steam. From there, there was little in the way of outperformance from either group.
In early November, the ‘people-movers’ got a boost from the Pfizer (PFE) announcement regarding preliminary results of its COVID vaccine, but throughout the winter there was still little leadership among either group. It wasn’t until February of this year when vaccine rollouts picked up steam and fatigue from a winter of remaining stuck at home, that Americans finally really started to start going out again providing a huge boost for the ‘people-movers’. More recently, even as Americans are more optimistic than ever about moving around heading into the Summer, the ‘people-mover’ stocks have stalled out relative to the ‘parcel movers’ which continue to rally. Whether this is just a period of consolidation following a big rally or something else remains to be seen, but it’s noteworthy that even as passenger air traffic continues to pick up and more airlines recall staff, the transports most leveraged to travel are at the same level they were at in late February. Click here to view Bespoke’s premium membership options for our best research available.
![]()