Near Record Highs Brings Some Bulls Back
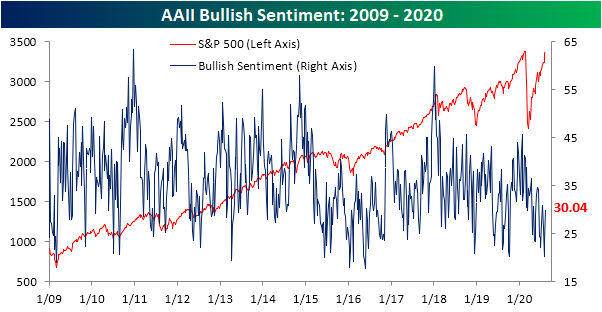
The S&P 500 has pressed ever closer to a new all-time high, but as we noted last week, sentiment remains fairly muted. Historically, when the S&P 500 has been at or within 1% of an all-time high bullish sentiment has sat around an average of 40%. Bearish sentiment, on the other hand, has typically been around 25.5%. With the S&P 500 less than a tenth of a percent away from its February 19th closing high today, bullish sentiment from AAII stands at 30.04%; roughly 10 percentage points away from what could be expected when the S&P 500 is so close to an all-time high. Although bullish sentiment is lower than might be normal for where the S&P trades, it did pick up considerably week over week, rising 6.75 percentage points in what was the largest single weekly increase since March 5th when it rose by 8.31 percentage points. Even after that increase, though, bullish sentiment was higher less than a month ago (July 16th).
Again, historically bearish sentiment has only been just over 25% when the S&P 500 is close to all-time highs. That is far from the case today as 42.12% of respondents in AAII’s survey reported as bearish. Conversely to bullish sentiment, though, bearish sentiment fell 5.48 percentage points. That was the largest week over week decline since May 21st’s 5.59 percentage point decline, leaving bearish sentiment at its lowest level since June 11th.
Those moves in bullish and bearish sentiments led the bull-bear spread to be cut in half, rising from -24.31 to -12.08. That is the most the spread has climbed in a single week since February when it rose from -1.35 to 14.93. Despite that large move, the spread still favors bears as the record streak of negative readings lives on. The bull-bear spread is now at its highest reading since June 11th.
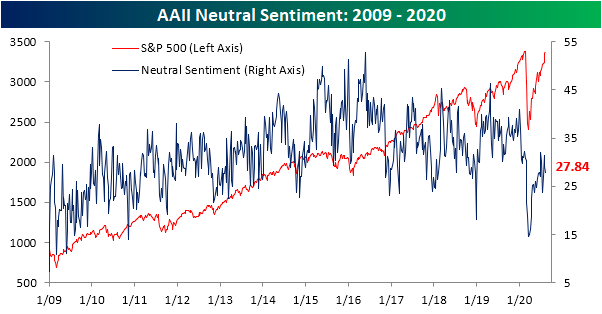
Meanwhile, neutral sentiment was slightly lower, dropping 1.27 percentage points to 27.84%. That only leaves it at its lowest level since July 23rd. Start a two-week free trial to Bespoke Institutional to access our interactive economic indicators monitor and much more.
The Strangest Top 25 List In Some Time
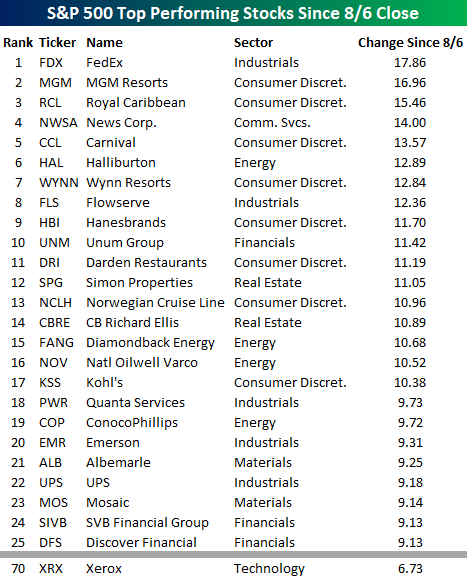
Look closely at the list of the top 25 performing S&P 500 stocks since last Thursday’s close and tell us what’s wrong with it? Do you see it? Keep looking, you’ll figure it out. Yup. That’s it! Not a single one of the 25 best performing stocks over the last week is from the Technology sector. In looking through the list of names, it’s littered with stocks that were left for dead at varying points in the last several months. FedEx (FDX) is up nearly 18%. Casinos and cruise ships have been collecting dust and rust for the last five months, but the stocks of MGM and Royal Caribbean (RCL) are the second and third best-performing stocks in the S&P 500 over the last week.
Not only are there no stocks from the Technology sector in the top 25, but there aren’t even any in the top 50. To find a Tech sector stock on the list, you have to go all the way down to spot number 70 where Xerox (XRX) sits with its gain of 6.73%. Yeah. We were surprised too. Not only is XRX still a public company, but it’s considered a tech stock.
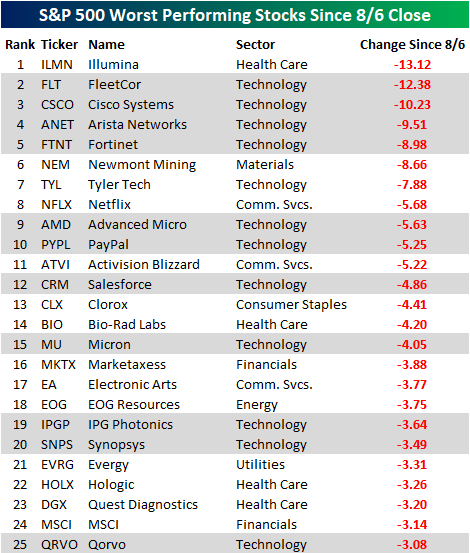
If you want to find a lot of stocks from the Technology sector, they are on the list of the 25 worst performers since last Thursday. Of the 25 names listed below, 12 are from the Technology sector. Not only that, but even many of the non-tech stocks listed like Illumina (ILMN), Netflix (NFLX), Activision Blizzard (ATVI), Marketaxess (MKTX), Electronic Arts (EA), and Hologic (HOLX) have very high tech characteristics behind their businesses. Like what you see? Start a two-week free trial to Bespoke Institutional for full access to our research and interactive tools.
Jobless Claims Finally Below 1 Million
This morning’s release of initial jobless claims marked the first time that claims were below 1 million since the week ending March 13th (21 weeks). Jobless claims fell 228K to 963K compared to expectations of a much smaller drop to only 1.1 million from 1.19 million last week. This week’s 228K decline was a slightly smaller drop than the prior week’s 244K decline but remains a much larger improvement than what was observed through most of June and July. Overall, claims are certainly on the right track with the first sub-1 million milestone now in the bag, but the 963K initial claims filed in the past week is still a historically elevated level higher than anything observed prior to the pandemic.
On a non-seasonally adjusted basis, this was actually the second week that claims were below 1 million with last week’s reading of 988.3K and this week’s 831.9K. This decline comes with the seasonal tailwind that claims typically decline from early July through September.
Continuing claims are echoing the continued improvements in labor data with another decline of 604K this week bringing the seasonally adjusted number to 15.486 million. That leaves continuing claims at the lowest level since the first week of April. Again, as is the case with initial claims, continuing claims remain historically high but are headed in the right direction.
Not only is the headline number of claims improving but so are claims for Pandemic Unemployment Assistance (PUA). Initial claims by this measure fell from 0.66 million to 0.49 million this week. These are some of the lowest readings since the program began in mid-April. That brings the total between NSA claims and PUA claims to 1.32 million. While lagged an additional week, continuing claims for the week ending July 24 (26.6 million) were the lowest since April 24th, and for PUA claims in particular, it was the lowest reading since the end of May. Start a two-week free trial to Bespoke Institutional to access our interactive economic indicators monitor and much more.
Bespoke’s Morning Lineup – 8/13/20 – Jobs in the Spotlight
See what’s driving market performance around the world in today’s Morning Lineup. Bespoke’s Morning Lineup is the best way to start your trading day. Read it now by starting a two-week free trial to Bespoke Premium. CLICK HERE to learn more and start your free trial.
Time is the friend of the wonderful company, the enemy of the mediocre.” – Warren Buffett
For the first time in 21 weeks, jobless claims dropped below a million (963K), which was below consensus forecasts for 1.1 million. Continuing claims also came in lower than expected but by a narrower margin. 963K is still high by all historical comparisons outside of the last several months, but it indicates a continuation of a move in the right direction. Regarding stimulus talks, if it was going to take a sense of urgency to get Democrats and Republicans to come to an agreement, the stock market trading right near record highs and jobless claims back below a million aren’t providing any ammunition.
Be sure to check out today’s Morning Lineup for a rundown of the latest stock-specific news of note, market performance in the US and Europe, new FHFA fees on mortgage refinancings, trends related to the COVID-19 outbreak, and much more.
Small caps have been outperforming large gaps in recent weeks off the March lows after the Russell 2000 was decimated during the COVID crash. Over just the last week, the Russell 2000 has outperformed the S&P 500 by nearly a full percentage point, but as shown in the chart below, the index still has some catching up to do. Besides the fact that small caps saw their peak relative to large caps earlier in the last decade, they have only erased barely more than half of the underperformance they saw from the S&P 500’s February peak to March trough.

Daily Sector Snapshot — 8/12/20
100 Days of Gains
Today marked 100 trading days since the Nasdaq 100’s March 20th COVID Crash closing low. Below is a chart showing the rolling 100-trading day percentage change of the Nasdaq 100 since 1985. The 59.8% gain over the last 100 trading days ranks as the 3rd strongest run on record. The only two stronger 100-day rallies ended in January 1999 and March 2000.
While the Nasdaq 100 bottomed on Friday, March 20th, the S&P 500 bottomed the following Monday (3/23). This means tomorrow will mark 100 trading days since the S&P 500’s COVID Crash closing low. Right now the rolling 100-day percentage change for the S&P 500 sits at +46.7%. But if the S&P manages to trade at current levels tomorrow, the 100-day gain will jump above 50%. It has been 87 years (1933) since we’ve seen a 100-day gain of more than 50%! Click here to view Bespoke’s premium membership options for our best research available.
TGIW
Friday is just about everyone’s favorite day of the week, but for both the entire year and since March 23rd, the best days for the S&P 500 have been Monday and Wednesday. On a YTD basis, the S&P 500’s median gain on Mondays has been 0.70% while Wednesday’s median gain has been 0.50%. Outside of those two days, Tuesdays and Thursdays have been modestly positive, while Friday is the only day of the week that has seen declines on a median basis.
Looking just at the period since 3/23, Mondays and Wednesdays have still been the strongest with median gains of 0.73% and 0.71%, respectively. Behind those two weekdays, Fridays have seen improved performance with a median gain of 0.34% followed by Tuesday (0.17%) and Thursday (0.00%). What’s notable about the nearly five months since the 3/23 low is that every day of the week has seen gains on a median basis.
In terms of consistency, Mondays have been the most positive day of the week both on a YTD basis and since the March lows. Since the March low, Wednesday and Friday have both seen gains two-thirds of the time, and while Monday through Thursday have seen similar levels of consistency whether you look on a YTD basis or since the March lows, Friday has had a pretty wide disparity. In the period from late January through late March, investors did little in the way of buying on ‘Corona Fridays’ ahead of the weekend, but once the initial panic of the outbreak began to subside in April, that sentiment started to fade. Click here to view Bespoke’s premium membership options for our best research available.
B.I.G. Tips – Big Drops in Gold and Silver
Chart of the Day: Rotation Underway
Bespoke’s Morning Lineup – 8/12/20 – Summer Reruns
See what’s driving market performance around the world in today’s Morning Lineup. Bespoke’s Morning Lineup is the best way to start your trading day. Read it now by starting a two-week free trial to Bespoke Premium. CLICK HERE to learn more and start your free trial.
“From neither the White House nor any other senior administration post would there come any leadership, any attempt to set priorities, any attempt to coordinate activities, any attempt to deliver resources.” – John M. Barry, The Great Influenza
In reading the quote above, critics of the President would think that it’s a description of the current attitude in the White House towards the Covid-19 outbreak. It’s actually from the book, The Great Influenza: The Story of the Deadliest Plague in History. Back in 1918. Amazingly, President Wilson never made a single public statement related to the flu pandemic and acted like it never happened and instead had a singular focus on mobilizing the country for WWI.
In looking at today’s “Overnight Trading” chart from the Morning Lineup, it looks the exact same as yesterday’s chart. For the sake of the bulls, let’s hope that today’s intraday trading for US stocks isn’t a re-run of Tuesday as well.
Joe Biden’s selection of Kamala Harris wasn’t particularly surprising to the market as she was already considered one of the leading contenders along with Susan Rice, and the pick makes sense for Biden as Harris will likely be solid on the campaign trail and go after Trump in the way that a VP candidate is expected to. While the selection isn’t likely to provide much of a boost for Biden, at this point it likely won’t hurt him either. Harris wasn’t exactly successful as a Presidential candidate in her own right, but back in 2008 neither was Biden and that didn’t hurt Obama.
On the inflation front, after yesterday’s PPI doubled expectations (+0.6% vs 0.3% forecast), today’s CPI for July saw the exact same print on a headline basis relative to the same consensus expectation for an increase of 0.3%.
Be sure to check out today’s Morning Lineup for a rundown of the latest stock-specific news of note, market performance in the US and Europe, trends related to the COVID-19 outbreak, and much more.
Since last Thursday’s close, the S&P 500 is down 0.46%, but the decline has been far from broad-based. As shown to the right, four sectors are up over 1% during that period with Industrials and Financials both rallying more than 4%. On the downside, Technology has been the main drag with a drop of over 3.6% while Communication Services has dropped 1.8%. Of the 500 stocks in the index, nearly two-thirds are actually up during that span, so the vast majority of stocks in the index and the US for that matter have risen during this period.


