News High for Net New Highs
Yesterday, the S&P 500 closed at its highest level since only a few days after the early September high. While the index has yet to reach a new high, many individual stocks in the index have. As shown in the charts below, 11.71% of S&P 500 stocks closed at a new 52-week high yesterday while no stocks closed at a new 52-week low. That makes for the second-highest net new highs reading of the pandemic with the only higher reading (17.62%) occurring just over a month ago at the last all-time high on September 2nd. Before that, the last time net new highs were as high as now was on February 19th: the last all-time high before the bear market began.
As for the individual sectors, there has also been a significant pickup in the net percentage of new 52-week highs. Industrials currently has the highest reading of net new highs among the 11 sectors at 26%. Just like the broader S&P 500, that is the highest since September 2nd when the net percentage of new highs rose above 30%. Consumer Discretionary is the runner up in being the sector with the highest percentage of net new highs. One distinguishing factor, though, is whereas every other sector has seen higher readings at some point since the bear market in the spring, Consumer Discretionary’s current reading of 18% is tied with the reading from August 24th. On the other end of the spectrum, both Communication Services and the Energy sector have seen no new highs over the past few days. Granted, there have not been any new 52-week lows either. Meanwhile, Financials and Real Estate have both seen an uptick in net new highs, but it has been much more modest than other sectors. Click here to view Bespoke’s premium membership options for our best research available.
Bespoke’s Morning Lineup – 10/9/20 – Finishing Strong
See what’s driving market performance around the world in today’s Morning Lineup. Bespoke’s Morning Lineup is the best way to start your trading day. Read it now by starting a two-week free trial to Bespoke Premium. CLICK HERE to learn more and start your free trial.
“When you learn to let go of the need to be right, being wrong gradually loses its power to disturb you.” – Yvan Byeajee
In the ongoing saga over the china trade deal stimulus talks, it appears as though things are back on again, or at least what the pundits are saying. Futures are higher this morning, and while it could be due to optimism over a larger stimulus bill getting done, it could also very well be over less uncertainty regarding the election, economic improvement even without a stimulus, or the fact that more successful treatments for COVID-19, even without a vaccine seem to come out every day. Just today, Gilead’s CEO was on CNBC and commented that a study of Remdesivir shortened recovery times of COVID patients by five days and significantly reduced the number of people that died of the virus.
Be sure to check out today’s Morning Lineup for a rundown of the latest stock-specific news of note, market performance in the US and Europe, European manufacturing, trends related to the COVID-19 outbreak, and much more.
We’re all familiar with the saying “Show me a man’s [or woman’s] friends, and I’ll show you the man [woman].” A corollary to that could be, “Show me which way the dollar is moving, and I’ll show you the direction of the stock market.” You see, so far this year, the direction of the dollar every month has been the opposite of the S&P 500. So when the dollar has rallied, as it did in the first three months of the year and in September, the S&P 500 declined. Likewise, in months where the Dollar Index declined, the S&P 500 rallied. October is only eight days old, but so far the Dollar Index has dropped 0.60% and the S&P 500 is up 2.49%. See, it’s as easy as that!

Breadth Booming
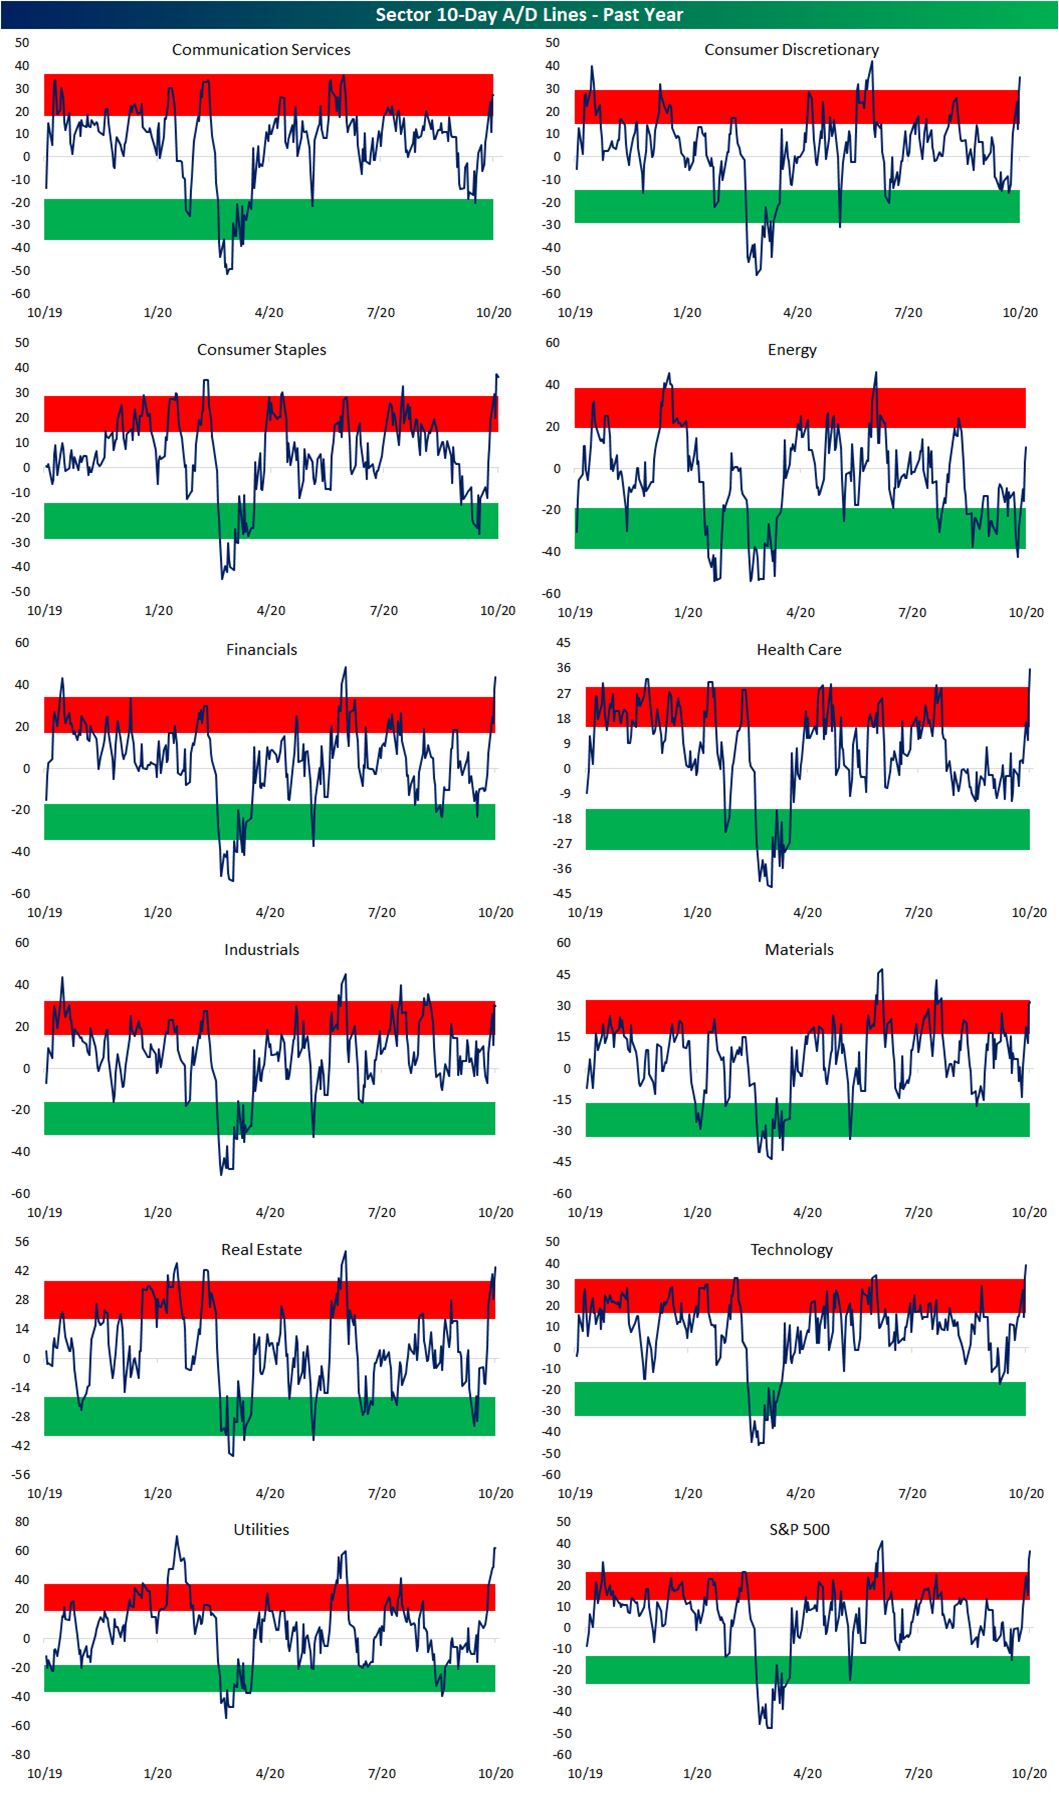
One of the most notable aspects of the rally off the late September lows has been broad participation. As shown below, breadth is very strong as the 10-day advance-decline lines for several sectors are at some of their highest levels of the past year. For the S&P 500, the 10-day advance-decline line is at its highest level since June 8th. The same can be said for Communication Services, Consumer Discretionary, Financials, and Real Estate. For Consumer Staples, the sector’s 10-day A/D line is at its highest level since June of 2019 and for Health Care it is at its highest level since May of 2019. In the case of Technology, it has been even longer as that sector’s line is at its highest level since last April.
While broad participation is healthy for the long-term prospects of a rally, these 10-Day A/D lines have gotten extremely overbought in the near term, suggesting a cool-down period is likely in the days ahead.
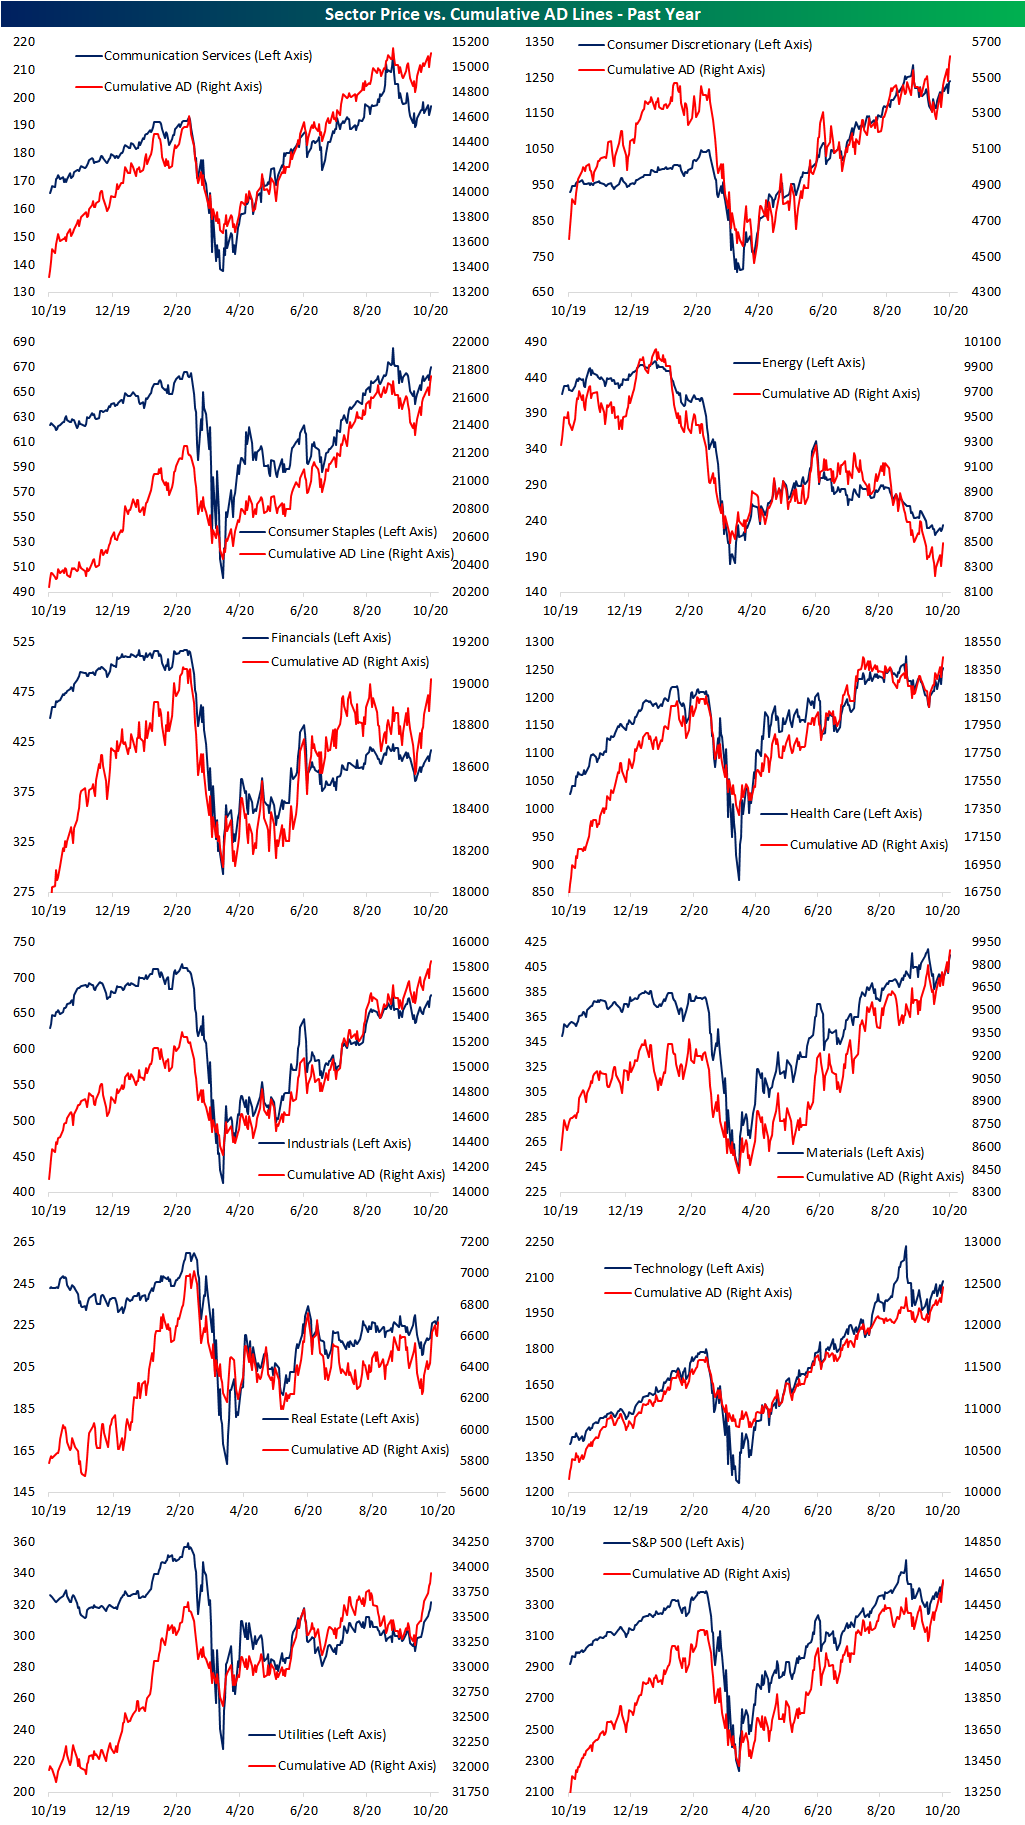
With short term breadth running very hot, the cumulative A/D lines of several sectors are breaking out to new highs as well. Utilities and Materials are the only sectors to have seen prices reach a new high in the past few days alongside their cumulative A/D lines. As for the other sectors, Consumer Discretionary, Consumer Staples, Health Care, Materials, and Tech have also all seen new highs for cumulative breadth. The same applies to the S&P 500, but again, none of these have yet to see price do the same. You can see these sector charts along with many more in our Daily Sector Snapshot. The Sector Snapshot is included with a Bespoke Premium membership. Click here to start a two-week free trial to Bespoke Premium.
The Bespoke 50 Top Growth Stocks — 10/8/20
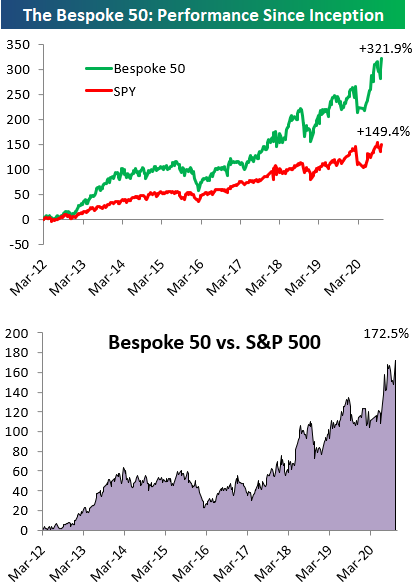
Every Thursday, Bespoke publishes its “Bespoke 50” list of top growth stocks in the Russell 3,000. Our “Bespoke 50” portfolio is made up of the 50 stocks that fit a proprietary growth screen that we created a number of years ago. Since inception in early 2012, the “Bespoke 50” has beaten the S&P 500 by 172.5 percentage points. Through today, the “Bespoke 50” is at new all-time highs and up 321.9% since inception versus the S&P 500’s gain of 149.4%. Always remember, though, that past performance is no guarantee of future returns. To view our “Bespoke 50” list of top growth stocks, please start a two-week free trial to either Bespoke Premium or Bespoke Institutional.
Bespoke’s Weekly Sector Snapshot — 10/8/20
Optimism Comes Into the Light
Up until today, the S&P 500 has been somewhat wishy-washy on whether or not it was to stay above its 50-DMA. Despite that choppy price action in addition to a crazy few days of headlines ranging from the squashing then revival of hopes for a stimulus deal to the president’s contraction of and recovery from COVID, sentiment has seen a significant pick up this week. The American Association of Individual Investors’ weekly reading on bullish sentiment rose 8.5 percentage points this week to 34.74%. That is the highest level of bullish sentiment since the initial rally off the bear market lows on April 16th when bullish sentiment was only slightly higher at 34.86%. That 8.5 percentage point increase was also the largest one week rise in bullish sentiment since January when it rose 8.76 percentage points.
Those gains to optimism took from the bearish camp as bearish sentiment fell to 38.97%. Although the 4.1 percentage point decline was not particularly large—for example, less than a month ago we saw a larger 8.06 percentage point decline—bearish sentiment has fallen back below 40% for just the second time since mid-June; the other week below 40% being August 27th (39.62%). Bearish sentiment is now at the lowest level since June 11th.
With bullish and bearish sentiment at new highs and lows, respectively, the bull-bear spread has reached its least negative level since June 11th. At -4.23, the record streak of consecutive negative readings in the spread—meaning bearish sentiment outweighs bullish sentiment—is on the ropes, but still alive growing to 33 weeks long.
The gains in bullish sentiment also took from neutral sentiment as the percentage of investors reporting as such fell from 30.69% to 26.29%. That is the lowest level for neutral sentiment since a reading of 23.79% back in mid-July. It was also the largest single week decline in the reading since that same week. Click here to view Bespoke’s premium membership options for our best research available.
Claims Inch Their Way To A New Low
Last week’s Nonfarm Payrolls report was a bit of a mixed bag for the health of the labor market as it showed signs of slowing in the pace of the rebound in employment as permanent job losses have mounted. Initial jobless claims—updated Thursday morning—have been showing a similar story of further improvements but at a slowing pace. Seasonally adjusted claims for the most recent week came in at the lowest level of the pandemic at 840K. But, as has been the case for two-thirds of releases since the peak in claims in late March, that missed forecasts of a drop to 820K. Additionally, that only was a 9K decline from last week; the only smaller improvement for any week since the peak in claims was a 2K decline in the second week of July.
The undersized decline this week is an example of the general trend of slowing improvements in initial claims. Over the past two months, seasonally adjusted claims have averaged a decline of 1.54% week over week. That compares to mid to high single-digit readings throughout the summer and double-digit readings in the more immediate aftermath of the peak in claims back in the spring. Again, while those small improvements are still welcome as claims are at the lowest level of the pandemic, this week’s reading was still 145K above the previous record from before the pandemic (695K in October of 1982) and the slower rate of improvement only further prolongs the recovery.
On an unadjusted basis, claims actually rose 4.3K this week to 804K. Granted, that is not a particularly large increase. In fact, of all weeks that claims have risen WoW since the peak in the spring, this week’s 5K rise was the smallest. Another silver lining of this increase is that it is also consistent with seasonal patterns given claims typically rise from the fall through the end of the year. At the current level, unadjusted claims are basically right in line with the four-week moving average of NSA claims at 806K.
While initial claims have not been rapidly improving, continuing jobless claims (lagged an additional week to initial claims) have continued to fall at a healthier clip. Like seasonally adjusted initial claims, continuing claims are at the lowest level of the pandemic after falling by over 1 million this week. That is the largest WoW decline since August 21st. As previously mentioned, while initial claims have been improving at a slower rate, continuing claims look healthier (or less catastrophic!). The average WoW decline over the past two months now stands at over 4% which is the strongest rate since the first week of July.
Including other measures of unemployment insurance like Pandemic Unemployment Assistance (PUA), NSA claims were lower for both initial and continuing claims for the most recent week. In the case of initial claims, total claims (headline plus PUA) fell to a pandemic low of 1.27 million from 1.31 million last month. That decline was mostly driven by a drop in PUA claims which fell by 44.3K to less than 500K; the only other week with initial PUA claims below 500K was the first week of August. Lagged another additional week, continuing claims also fell to a new low of 23 million thanks to sizeable drops in both regular NSA claims (-808.7K) and PUA claims (-433.5K). Click here to view Bespoke’s premium membership options for our best research available.
Chart of the Day: Big Lots (BIG)
Bespoke’s Morning Lineup – 10/8/20 – More Stimulus Hopes
See what’s driving market performance around the world in today’s Morning Lineup. Bespoke’s Morning Lineup is the best way to start your trading day. Read it now by starting a two-week free trial to Bespoke Premium. CLICK HERE to learn more and start your free trial.
“I sometimes compare my brainstorming on paper to the drilling of oil wells. The only way to strike oil is to drill a lot of wells.” – Tom Monaghan, Founder Domino’s Pizza
Futures have been rallying all morning and are currently trading at their highs of the session. The catalyst this morning is – you guessed it – more stimulus hopes. In other news, IBM pre-announced better than expected results and said it would spin-off its managed infrastructure unit. In economic news this morning, jobless claims came in at 840K versus consensus forecasts for a level of 820K. Continuing Claims came in at 10.976 million which was much lower than forecasts for 11.4 million. Overall, a mixed bag but it’s encouraging to see continuing claims drop below 11 million for the first time since March.
Be sure to check out today’s Morning Lineup for a rundown of the latest stock-specific news of note, market performance in the US and Europe, trends related to the COVID-19 outbreak, and much more.
Small caps have been a disappointing area of the market for the last few years now, but the last few days have been a different story. Over just the last ten trading days, the Russell 2000 has rallied more than 10%. That’s the strongest 10-day rate of change for the index since the Spring coming off the COVID crash lows. While there have been plenty of other instances where the Russell 2000 saw a stronger 10-day rate of change, what makes the current period unique is that while most big rallies in the Russell 2000 have come after sharp declines, that wasn’t the case this time around.
The lower chart shows the Russell 2000’s 10-day rate of change going back to the start of 2018. In the rally off the March lows, the Russell 2000 had previously been down more than 30% over a 10-day period, and before that the 10%+ rally in early 2019 followed what was a 12% decline just before. The most recent rally, though, has been different. At no point in the last 50 trading days has the Russell 2000’s 10-day rate of change seen a decline of more than 5%. In other words, while most prior big short-term rallies have been a snapback from a prior decline, there was no big drop to snap back from this time around.


