Most Volatile Stocks on Earnings
As earnings season lurks around the corner, we took a look into the most volatile stocks on earnings that are reporting between now and the end of November, as we do ahead of each earnings season. These stocks have historically experienced the largest one-day moves in reaction to their earnings reports.
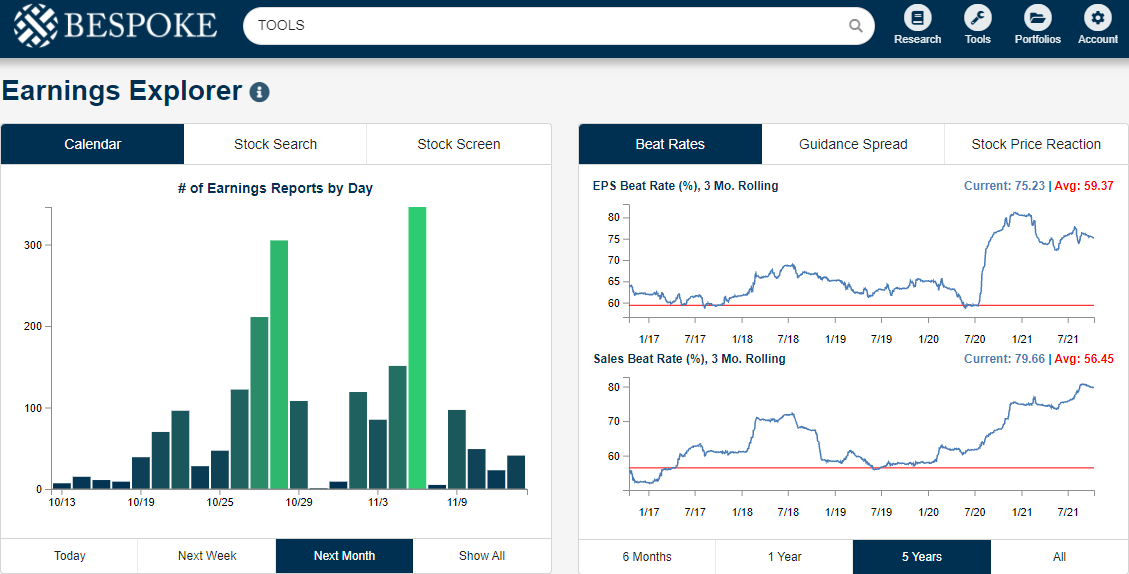
The number of daily earnings reports ramps up next week but doesn’t hit full-stride until two weeks from now, which is the end of October. Earnings season continues into the start of November as well. (You can track upcoming earnings reports and monitor earnings-related trends using our Earnings Explorer tool.)
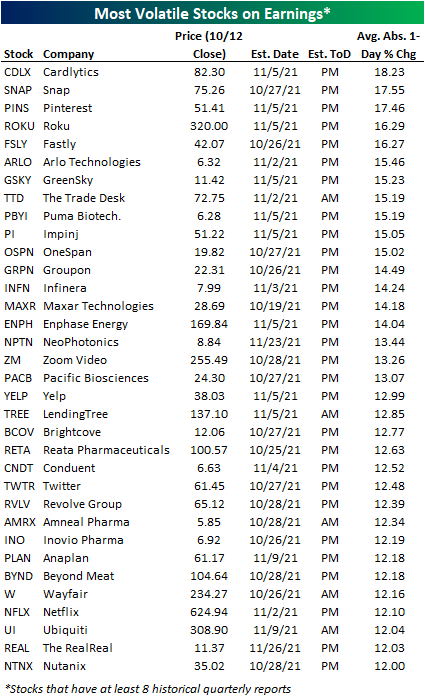
In the table below you will find the stocks that have historically seen the biggest share-price reactions to earnings that have at least 8 quarters (2 years) of earnings reports. On the trading day following their respective earnings reports, these companies have had the highest average absolute percentage change in share price. (For stocks that report before the open, we are looking at its one-day change on that trading day. For stocks that report after the close, we are looking at its one-day change on the next trading day.)
Of the companies reporting between now and the end of November, Cardlytics (CDLX) has the highest average absolute one-day change of +/-18.62%. Snap (SNAP) and Pinterest (PINS) have average one-day moves of over +/-17%. Roku (ROKU) and Fastly (FSLY) average one-day moves of over +/-16%. Other notable stocks on this list include The Trade Desk (TTD), Groupon (GRPN), Zoom Video (ZM), LendingTree (TREE), Twitter (TWTR), and Netflix (NFLX). All names on this list average one-day moves of over +/-10% on their earnings reaction days.
To show you the volatility of these names, let’s take a look at the earnings results for the top name of this list, CDLX. Below, you will see that the stock has typically seen dramatic moves on its earnings reaction days. Specifically, the stock has experienced the largest drawdowns when it has lowered guidance. The maximum one-day earnings drawdown since CDLX’s IPO was 36.7%. Conversely, its maximum upside was a gain of 42.9% back in November 2019. CDLX is heading into its upcoming earnings report on a two-quarter losing streak. On its earnings reaction day in May, CDLX fell 16.96%, while it fell 27.61% on its last earnings report in August.

The table below examines the most volatile stocks on earnings that have at least five years (20 reports) of quarterly reports. Over time, stocks tend to decrease in volatility around earnings because of the increase in available data points.
Of the stocks with at least five years of quarterly earnings data that are reporting between now and the end of November, The Trade Desk (TTD) has been the most volatile with average absolute one-day price movements of +/-15.19%. Impinj (PI) has averaged a move of over +/-15% as well. Groupon (GRPN), Infinera (INFN), and Enphase Energy (ENPH) follow with average price moves of over +/-14%. Other notable members of this list include Wayfair (W), iRobot (IRBT), Chegg (CHGG), and Crocs (CROX).

The top name on the list above, TTD, has had interesting earnings reactions and is far from predictable. Over the last 8 earnings periods, the company has beaten on EPS and revenues every single time, and it has only failed to raise guidance once. However, the stock dropped 26% after beating both EPS and sales and raising guidance back in May. The market seems to set its own expectations apart from the street for this name.

On the final list, we will only be looking at names that have at least 10 years (40 quarterly reports) of earnings history. Although these are well established companies, they still experience absolute average price moves of +/-10% on earnings reaction days.
The names at the top of this list are Infinera (INFN), Netflix (NFLX), WW (WW), iRobot (IRBT), and 3D Systems (DDD). Other notable names include First Solar (FSLR), Overstock.com (OSTK), Sketchers USA (SKX), Guess? (GES), and Green Dot (GDOT).
While all of the stocks listed on these tables have historically seen violent moves in reaction to earnings, there is of course no way to know whether the large moves will be to the upside or downside, so tread lightly!

The volatility leader of the above list, INFN, has experienced a lower level of volatility after its four most recent reports in comparison to historical averages. During the last four periods, INFN has averaged an absolute average one-day change of just under 4%. This is significantly below its overall average of +/-14.24% on its 56 historical reports dating back to 2007. Since the start of historical data, the stock has only booked four straight absolute one-day price changes of under 10% one other time, which occurred in the last three quarters of 2012 and the first quarter of 2013.

Two Big Banks Break Two Long Streaks
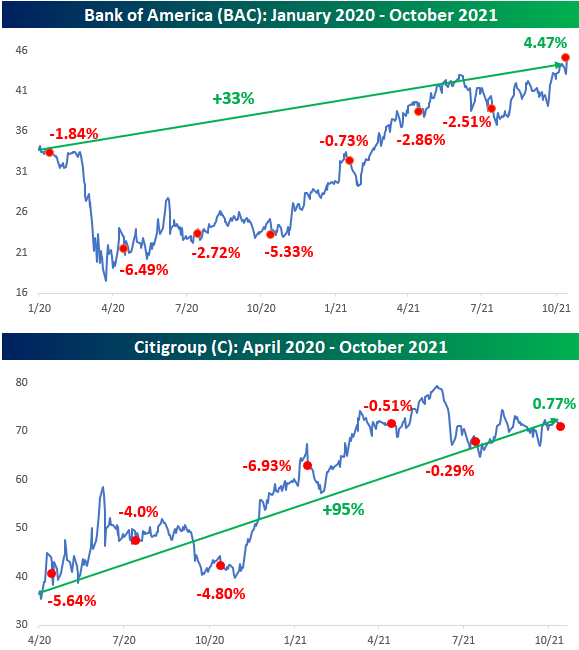
Earlier on Thursday, we noted how shares of JP Morgan Chase (JPM) had traded lower on their earnings reaction days for five straight quarters. Despite the string of weak short-term reactions to earnings, though, JPM has performed very well in the period encompassing this streak rallying more than 66% since the start of September 2020. While JPM’s streak of five straight negative reactions to earnings reports was impressive enough, two other big banks that reported on Thursday were riding even longer streaks of negative reactions to earnings. Heading into Thursday’s report, Bank of America (BAC) had traded lower in reaction to earnings for seven straight quarters while Citigroup (C) traded down for six straight quarters. In both cases, Thursday’s positive price reactions to their respective reports ended those streaks.
Like JPM, while both stocks have experienced very negative short-term reactions to their earnings reports, during the entire run of declines on their earnings reaction days, they have both rallied sharply. In the case of BAC, the stock has rallied 33% since the start of 2020 when its earnings losing streak began, while shares of C are up 95% since the start of April when its six-quarter streak began. In the case of Citi, in fact, it has actually outperformed the S&P 500 which is up 75% in that same span. As noted with JPM, the performance of these two stocks also suggests that a stock’s short-term reaction to earnings isn’t necessarily a good indicator of its longer-term outlook. Click here to view Bespoke’s premium membership options.
Bespoke’s Weekly Sector Snapshot — 10/14/21
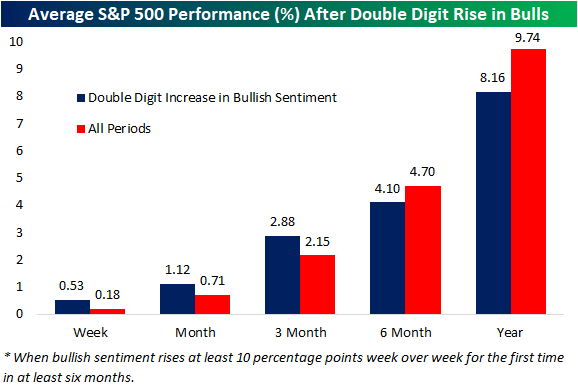
Double Digit Gain for Bullish Sentiment
The S&P 500 has managed to put in a higher low in the past few days, and investor sentiment is reflecting the recovery in equity prices. The AAII’s weekly sentiment survey saw the percentage of respondents reporting as bullish leap 12.4 percentage points to 37.9%. That is only the highest level since September 9th, but it also marked the largest one-week increase in bullish sentiment since last November. The last double-digit increase was just over six months ago during the week of April 8th when it rose 11.1 percentage points.

The recovery in bullish sentiment this week leaves the reading essentially right in line with its historical average, but again it has been a while since bullish sentiment has experienced such a large increase. Going back through the history of the survey, there have been 43 other times in which bullish sentiment has risen at least 10 percentage points in a week without another occurrence in the prior six months. As shown below, those types of moves have typically been positive for short-term performance with the S&P 500 on average outperforming the norm one week, one month, and three months out. With that said, returns six and twelve months later have tended to see slightly weaker than normal returns.
With a big increase in bullish sentiment, bearish sentiment pulled back to 31.8%. That is the lowest level since the first week of September, and similar to bullish sentiment, it is not far off from the historical average. In other words, the size of the move was large but the level of sentiment is pretty unremarkable.

The inverse moves in bullish and bearish sentiment resulted in the spread between the two to move back in favor of bulls for the first time in a month. The one-week increase in the spread also tied the week of February 11th for the largest jump since last November.

Bullish sentiment appears to have borrowed more heavily from those formerly reporting as neutral. Whereas bearish sentiment dropped 5 percentage points week over week, neutral sentiment shed 7.4 percentage points. Again, that decline does not mark any notable low and is not far away from the historical average. Click here to view Bespoke’s premium membership options.

Chart of the Day: Banks Keep Beating
Claims Sub-300K
Initial jobless claims have continued to decline with this week’s reading falling to 293K from an upwardly revised reading of 329K last week. The 36K week/week decline was not only more than double the expected decline, but it was also the largest since a 48K drop at the end of June. Additionally, after this week’s decline, the seasonally adjusted number is now at the lowest level of the pandemic, only 37K above the levels from March 14, 2020. After revisions to prior weeks, this week also marks the first sub-300K reading since the pandemic began.

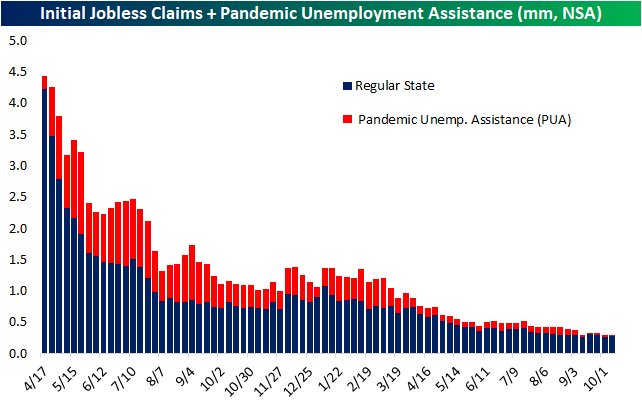
While seasonally adjusted claims were lower, unadjusted claims rose to 277K from 261K. A rise in regular state claims is very much the norm for the current week of the year with said week having historically observed claims rise WoW over three-quarters of the time going back to 1967. Before seasonal adjustments, claims have likely put in their seasonal low and will continue to trend higher into the end of the year. Additionally, with the end of enhanced benefit programs in early September, PUA claims have continued to drop off coming in at 21.62K this week. While at a nearly negligible level, that is still a few thousand off the low of 14.79K from the week of September 17th.

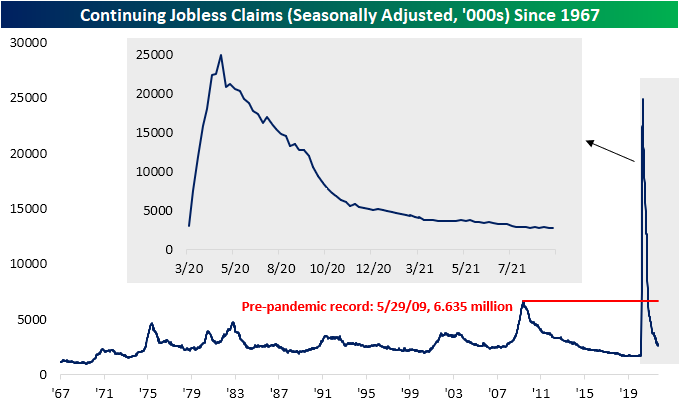
Continuing claims after seasonal adjustment likewise reached a new low of 2.593 million. This week’s 134K decline was the third week/week drop in a row and the largest of those weeks. That leaves claims 809K above the levels from right before the pandemic.
Tacking on all programs for continuing claims gives a more complete picture with the most recent data through the week of September 24th. Total claims across all programs totaled 3.66 million that week. Since the end of the support of pandemic era programs, total claims have now fallen by 7.6 million. Essentially the entirety of that decline is thanks to the massive drops in PUA, PEUC, and Extended Benefits programs as support has come to an end. In fact, since the first week of September (the last week before the expiration of enhanced benefits) regular state claims are actually higher by 26.4K whereas PUA, PEUC, and Extended Benefits programs have together fallen 7.616 million. Outside of regular state programs, PUA claims still account for the largest share of total claims with 549.1K claims followed by PEUC (440.4K), and the Extended Benefits (222.6K). With regards to Extended Benefits, throughout the summer we noted the volatile swings in that program. The teeter-tottering has appeared to have stopped for the time being as the program has now seen back-to-back significant declines from the 9/10 high of 431.3K. In other words, any oddities in that program’s data (potentially as a result of claimants switching from PUA or PEUC claims as their expiration ended) appear to be finally working themselves out. Click here to view Bespoke’s premium membership options.

Airline Passenger Traffic Back on the Ascent After a Weird August
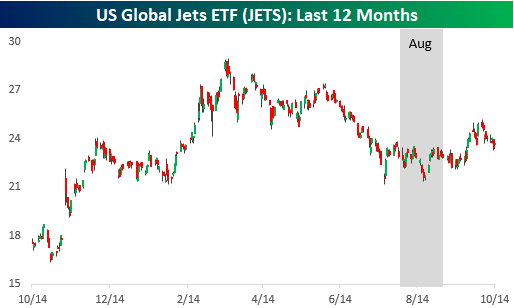
After a surge in the first half of the year and into Summer which took the number of daily air passengers back to levels last seen before the pandemic, Americans started to pull back in their air travel from late July through early September. Much of this decline was likely seasonal in nature, but the rise of the COVID Delta variant likely played a role too, at least at the margin. After peaking out just shy of 2.1 million passengers per day, the average daily volume of travelers in the nation’s airports fell by nearly 25% through mid-September. Since that low a month ago, though, volumes have been on the rise, and average daily air passenger traffic over the last seven days is now only down 10% from its July high.

As air passenger traffic has picked up, it’s not surprising that the airline stocks have bounced a bit off their lows in August. The ETF which tracks the major airlines in the sector (JETs) has rallied more than 10% from its August low. It was also up as much as 18% earlier this month before crude oil prices topping $80 started to weigh on sentiment in the sector.
In looking at air travel trends on a monthly basis, one thing that stands out is just how strange of a month August was. The chart below shows the percentage of days by month that passenger traffic was up relative to its reading in the prior week. Back in March 2020 when air passenger traffic ground to a halt, every day saw week/week declines in passenger traffic. Coming off of a low base, these readings picked up in May and June as the panic started to subside, and throughout 2021, we continued to see steady levels of week/week increases in air passenger traffic. In five of the first seven months of 2021, at least half of all days saw air passenger traffic levels above their week-ago levels, and the two that didn’t (January and April) still had more than a third of all days show increases.
But then came August. Throughout the entire month of August, there was only one day (8/1) where passenger traffic was up week/week and from there the next 30 days were all lower. Granted, traffic levels were coming off of post-pandemic highs, but the fact that traffic levels were so steady to the downside implies that Americans just didn’t want to fly. While most people were sad to see the summer come to an end, thankfully for the country’s airlines, traffic picked up again in September, and October is now on pace to be the second straight month where passenger traffic levels have increased on a week/week basis on at least two-thirds of days. Click here to view Bespoke’s premium membership options.

The Bespoke 50 Growth Stocks — 10/14/21
Bespoke Morning Lineup – 10/14/21
See what’s driving market performance around the world in today’s Morning Lineup. Bespoke’s Morning Lineup is the best way to start your trading day. Read it now by starting a two-week trial to Bespoke Premium. CLICK HERE to learn more and start your trial.
Below is the intro text to today’s full Morning Lineup:
“It will fluctuate.” – J. P. Morgan
Futures were already strong heading into this morning’s economic data, and they remained strong after both jobless claims and PPI came in below forecasts. As things stand now, the major averages are indicated to open up by 1% or more. While yields aren’t changed all that much today, we would note that the 10-year yield has declined nearly 10 bps this week.
On the earnings front, bank earnings this morning have been strong, and most of them are trading higher in the pre-market. Overall, of the eleven companies reporting this morning, just two (Commercial Metals and Domino’s) missed EPS forecasts. Top line results versus consensus forecasts have been equally strong.
In what has become a trend for a lot of big banks, JP Morgan Chase (JPM) declined in reaction to its earnings report yesterday falling by 2.64%. Yesterday’s decline marked the 5th straight time that shares of JPM declined in reaction to earnings. While these weak reactions to earnings reports tend to cause a fair amount of near-term angst on the part of investors towards the stock, it’s important to focus on the big picture rather than the day-to-day squiggles. Despite a negative one-day reaction to each of its last five earnings reports, shares of JPM are up 66% since the start of last November.

Start a two-week trial to Bespoke Premium to read today’s full Morning Lineup.
Stocks on Streaks Headed into Earnings Season
As earnings season kicks off in earnest this week, using data from our Earnings Explorer tool, we set out to find the stocks that are on the biggest earnings winning and losing streaks when it comes to share price performance.
There are 21 stocks reporting between now and the end of earnings season that have seen gains on their earnings reaction days for the last six consecutive quarters or more. (For a stock that reports after the close, its earnings reaction day is the next trading day. For a stock that reports before the open, its earnings reaction day is that trading day.) Five of the 21 stocks have gained on each of their last nine earnings reports! One of these is SiteOne Landscape (SITE). Below is a snapshot of SITE’s earnings reports going back to early 2019 pulled from our Earnings Explorer. Heading into its last report on August 4th, SITE had gained on each of its last 8 earnings reaction days, and it went on to gain another 7.65% that day as well!

Below is a table listing the 21 stocks that are currently on earnings winning streaks of six quarters or more. Along with SITE, the other stocks that have seen gains on their last nine earnings reaction days include Lindsay Corp (LNN), ExlService (EXLS), LKQ, and Cheniere Energy (LNG). For owners of these stocks, quarterly earnings have been a breeze over the last 2+ years.

On the downside, there are 16 stocks that have fallen on their earnings reaction days for seven or more straight quarters. These are stocks that just can’t catch a break lately when it comes to earnings. As shown, Hawaiian Holdings (HA), Verisk Analytics (VRSK), and BrightView Holdings (BV) have fallen on each of their last 11 quarterly earnings reaction days!

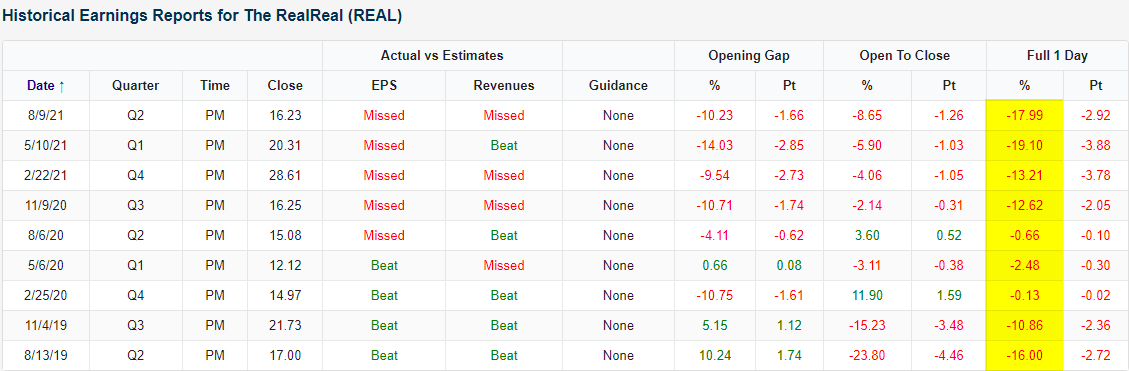
One of the absolute worst performing stocks in response to earnings has been The RealReal (REAL). The luxury consignment website went public back in June 2019, and so far the stock has yet to see a price gain on any of its nine earnings reaction days! Talk about a painful streak for shareholders. Below is a snapshot of REAL’s historical earnings reports pulled from our Earnings Explorer. As shown, not only has REAL fallen on each of its nine earnings reaction days since going public, but it has also fallen more than 10% on each of its last four earnings reports. You can use our Earnings Explorer to monitor historical earnings trends for the names you care about most. Start a two-week trial to Bespoke Institutional to access our Earnings Explorer now.