Mortgage Activity Rollover
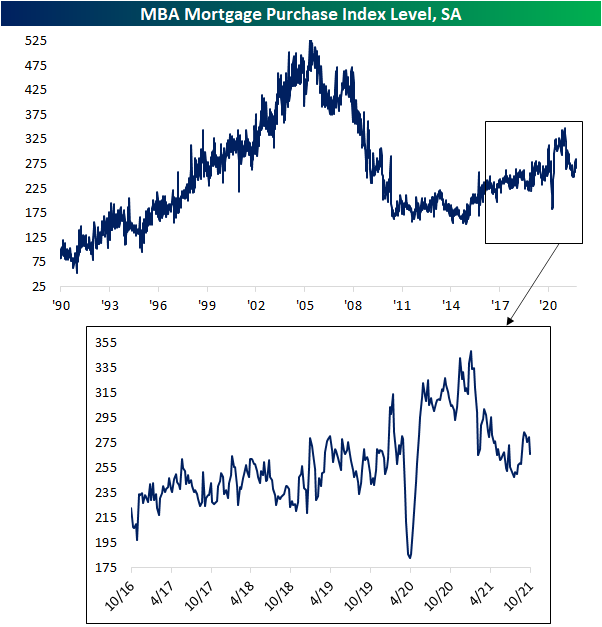
This morning the Mortgage Bankers Association (MBA) released their weekly read on mortgage activity. Whereas most of the past year has seen purchase applications trending lower, the reading bottomed out in late July indicating positive signs for other economic releases like new and existing home sales. Over the past month, though, as interest rates have been rising, the index has been erasing the late summer gains with this week’s 4.86% decline the largest for a single week since July 16th. With that said, the current level of purchase applications remains solid at the high end of the pre-COVID range.
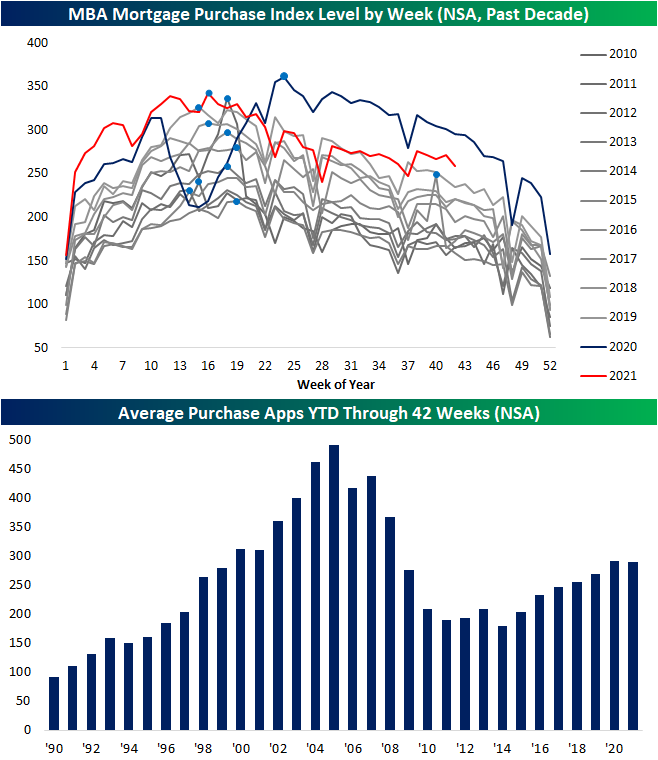
Purchase applications are generally following the normal seasonal pattern as well this year. Last year (dark blue line in the chart below) as the pandemic came about, purchase applications took a huge hit during what is normally the strongest point of the year for activity. That resulted in a later than normal seasonal peak (light blue dots). This year’s peak occurred in the spring as has been the norm over the past decade. While purchases have seen their usual seasonal decline since the spring, that does not mean purchases have been weak. Albeit not as strong as 2020 levels, purchase apps have been running at a clip similar to, if not stronger than, 2019 levels.
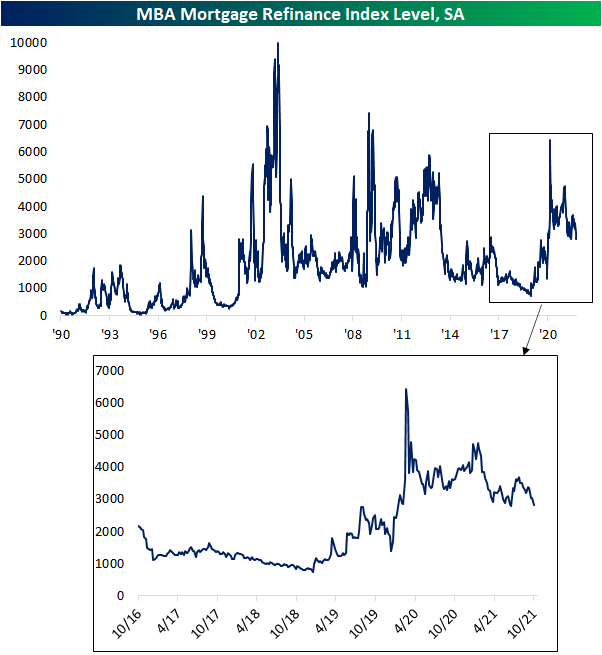
Refinance activity has also rolled over after moving higher in the summer. In fact, this week marked the fourth week in a row with a decline. In that span, this week and two weeks ago marked the largest declines of 7.12% and 9.58%, respectively. Those now leave the index just off recent post-pandemic lows set in early July.
Mortgage rates are certainly one factor contributing to the recent rollover in mortgage activity. As shown below, the national average for a 30-year fixed-rate mortgage is still at historic lows but is now off the lows. This rate bottomed in early August, and the end of last month saw a particularly significant leap higher. Currently, the rate stands at 3.18% versus 3.00% one month ago. Click here to view Bespoke’s premium membership options.

Bespoke’s Morning Lineup – 10/20/21 – Futures Little Changed
See what’s driving market performance around the world in today’s Morning Lineup. Bespoke’s Morning Lineup is the best way to start your trading day. Read it now by starting a two-week trial to Bespoke Premium. CLICK HERE to learn more and start your trial.
“Stone Age. Bronze Age. Iron Age. We define entire epics of humanity by the technology they use.” – Reed Hastings
There’s little movement in international equity markets and US equity futures currently, and the 10-year yield is flat at 1.63%. There’s no economic data to speak of today, but the Beige Book will be released at 2PM eastern. The S&P 500 has been up for five straight days now (its longest winning streak since late August) so a rest wouldn’t be too bad of a thing.
Read today’s Morning Lineup for a recap of all the major market news and events from around the world, including the latest US and international COVID trends.
While it initially rallied after the report was released, shares of Netflix (NFLX) quickly reversed in after-hours trading and are now looking at a loss of about 2% in the pre-market. While subscriber growth numbers came in better than expected, growth in North America looked a little more sluggish raising questions (again) that the streaming service has reached the saturation point in the United States.
Similar to the illustrations we provided of the large banks last week, the chart below shows the performance of NFLX since the start of 2020 with red dots indicating the closing price on the company’s earnings reaction day. What’s looking like a decline of around 2% for NFLX today would mark the seventh time in the last eight quarters where NFLX declined in reaction to earnings, and in each case, it has been a similar story; either sub growth was weaker than expected or investors anticipated that North American sub growth going forward would slow. Despite the short-term pessimism around each quarter’s report, since the start of 2020, NFLX has risen about 97% which is more than double the 44% gain of the S&P 500.

Start a two-week trial to Bespoke Premium to read today’s full Morning Lineup.
Daily Sector Snapshot — 10/19/21
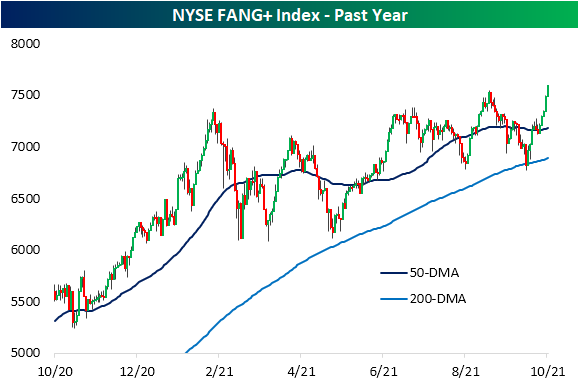
FANG+ Hits a New High With Mixed Relative Strength
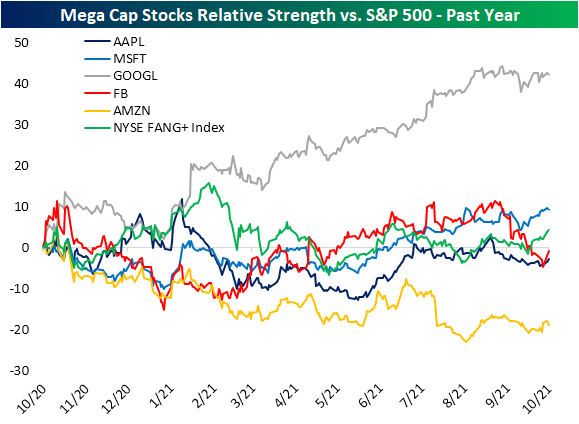
One week ago, mega-cap Tech as measured by the NYSE FAANG+ index was trading right around its 50-DMA after successfully testing its 200-DMA not long before. After rallying 6.44% in the past five days, the index of FANG+ stocks is now back at a 52-week high.
In the chart below we show the relative strength lines of the five largest S&P 500 stocks as well as the FANG+ index versus the S&P 500. Microsoft (MSFT), Facebook (FB), and Apple (AAPL) have generally performed in line with the broader market over the past year. More recently, FB has given up any outperformance it had versus the S&P 500 as the stock has come under pressure over the past few weeks. Meanwhile, the broader FAANG+ space has seen its relative strength line turn higher. Two standout stocks on opposite ends of the spectrum for relative strength have been Alphabet (GOOGL) and Amazon (AMZN). Both have seen fairly flat moves in their relative strength lines since the late summer, but from their performance earlier in the year, GOOGL has distanced itself to the upside whereas AMZN has lagged behind other mega-caps.
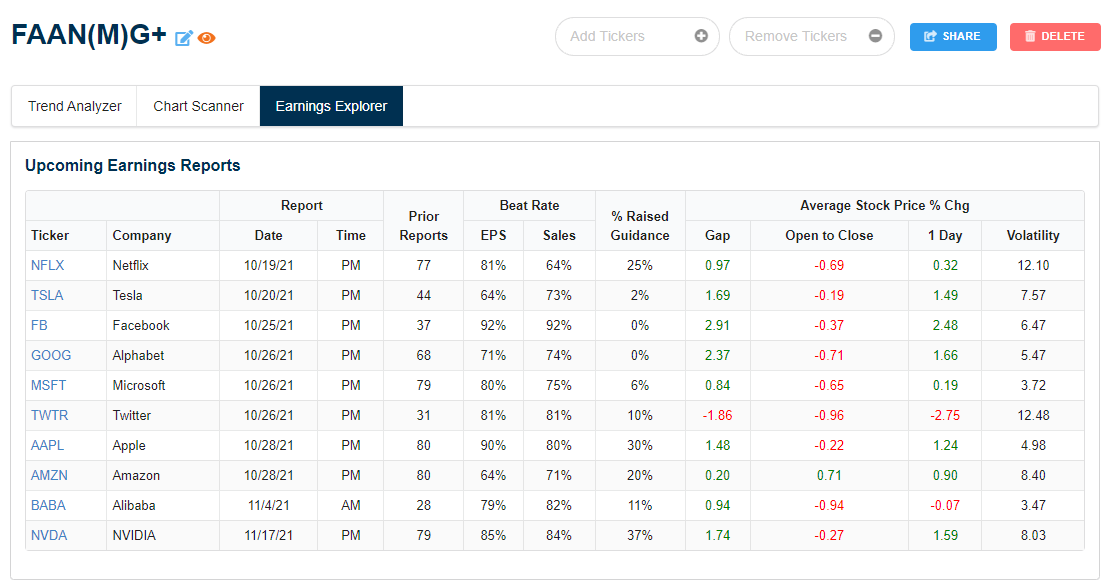
We would also note that a large portion of FAANG—or FAAN(M)G when including Microsoft—is scheduled to report earnings in the coming week. Of these, Twitter (TWTR) and Netflix (NFLX)—which reports tonight—have historically been the most volatile stocks on earnings with each one averaging a move of more than 12% (up or down). TWTR is also one of the only ones in the group to average a full-day decline on its earnings reaction days as shown in the snapshot of our Earnings Explorer below. Click here to view Bespoke’s premium membership options.
Bespoke Stock Scores — 10/19/21
Consumer Discretionary Ripping
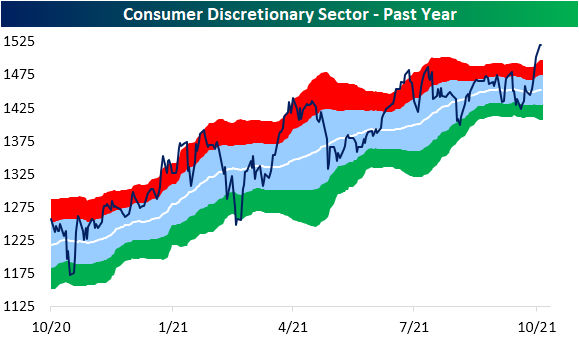
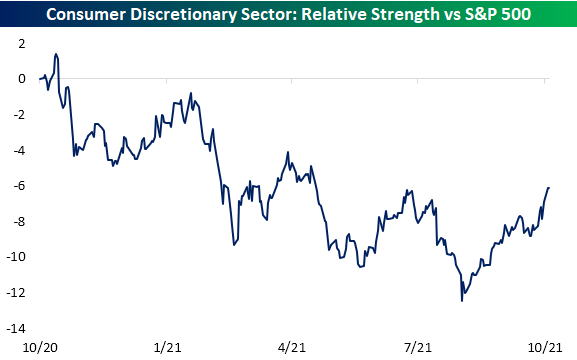
As we noted in last night’s Closer, some of the biggest members of the Consumer Discretionary sector by market cap like Amazon.com (AMZN) and Tesla (TSLA) have been pulling more than their fair share for the S&P 500’s gains recently. That also means the sector itself has been on a stellar run having risen over 5% in the past five days; the best five-day run since a 7.18% gain this past March. While currently elevated, this week’s move has marked a dramatic break out above the summer high. Additionally, its relative strength line versus the broader index has also made a significant breakout from the past year’s downtrend.
With that also comes a historic overbought reading. In the chart below, we show the distance in standard deviations that the Consumer Discretionary sector has traded from its 50-DMA. Finishing just shy of 3 standard deviations above its 50-DMA yesterday, the sector hit its most overbought level since the day after Christmas 2019. Going back to the start of our data in 1990, there have only been 20 times including that 2019 occurrence that the Consumer Discretionary sector was as overbought as it was yesterday.

Looking closer at some of the stocks that have driven the sector shows some interesting themes. As previously mentioned, online retail giant Amazon.com (AMZN) has been a key contributor to the S&P 500’s gains, and while the index has clearly broken out of its recent downtrend, AMZN is fighting to do the same. Meanwhile, Target (TGT) has posted double-digit gains in the past week bringing it quickly from oversold to overbought territory. Like AMZN, that move has smashed through a downtrend line.
Home improvement stores have also seen notable breakouts with Home Depot (HD) and Lowe’s (LOW) both breaking above their prior highs. Tractor Supply (TSCO), on the other hand, has maintained its uptrend but has yet to break out.
As consumers have likely had to put off car purchases due to constrained supply and instead repair the car they have, auto parts retailers have also been solid performers with notable breakouts of their own. Stocks like Advance Auto Parts (AAP), O’Reilly (ORLY), LKQ (LKQ), and AutoZone (AZO) have all made new highs in recent days. There are a couple of holdouts, though. Aptiv (APTV) continues to sit just short of a new high while Genuine Parts (GPC) has exited its downtrend but is much further below prior highs than its peers. Click here to view Bespoke’s premium membership options.

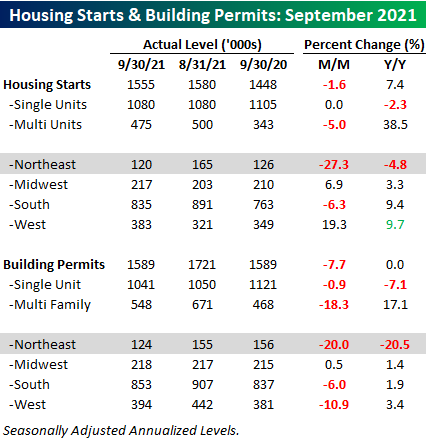
Residential Construction Activity Disappoints
This morning’s release from the Census Bureau on residential construction activity in September provided a double disappointment for investors. Not only did both Housing Starts and Building Permits come in weaker than expected, but the August reports were also revised modestly lower. The table below breaks down this month’s report by the size of unit and region. One positive about this month’s headline readings in both Housing Starts and Building Permits stems from the fact that all of the weakness was in multi-family units. Single-family units starts were actually unchanged relative to August and single-family permits were down less than 1%. Multi-family starts, meanwhile, were down 5.0% with permits even weaker, positing a decline of 18.3%.
On a regional basis, the Northeast was clearly an outlier with overall housing starts down 27.3% and permits down 20.0%. The remnants of Hurricane Ida and the massive flooding that encompassed many areas of the region may have been partly responsible for the slowdown in September’s activity.
Residential housing data barely even saw a downside blip in the aftermath of the pandemic, and levels of activity surged in the second half of 2021 and early this year. Signs are increasingly starting to emerge that things are cooling, though. Whether it’s lack of available supplies, labor shortages, affordability, or just a reversion to the mean after a strong pull-forward of demand, you can take your pick from one or all of the above. The slowdown is showing up in the 12-month moving averages of both starts and permits which both declined in September for the first time since May 2020, and unless monthly readings start to accelerate again next month, this trend will continue in the months ahead.

As for how Housing Starts interact with homebuilder stocks, the chart below compares the three-month average of starts to the performance of the iShares US Home Construction ETF (ITB) since 2007. The two series tend to track each other pretty well (correlation coefficient of +0.87), and you’ll notice that in recent months, the homebuilder stocks have run out of steam just as the level of starts began to stall out. Click here to view Bespoke’s premium membership options.

Chart of the Day: Reopening Index Update
Bespoke’s Morning Lineup – 10/19/21 – 8.47%
See what’s driving market performance around the world in today’s Morning Lineup. Bespoke’s Morning Lineup is the best way to start your trading day. Read it now by starting a two-week trial to Bespoke Premium. CLICK HERE to learn more and start your trial.
“The worst market I have ever seen in my lifetime or would hope to see again.” – John J. Phelan Jr.
Futures have been moving higher throughout the overnight session but have taken a slight hit following some weaker than expected residential housing data. In terms of both Building Permits and Housing Starts, the headline numbers came in significantly weaker than expected while August readings were revised modestly lower. Looking at the data, multi-family units look to have been the main driver of the weakness. Despite the weaker data, the 10-year yield is still above 1.6%. Commodities are higher as the dollar falls to its lowest levels of the month. All eyes will be on the crypto space this morning as the first US-based bitcoin ETF debuts today.
Read today’s Morning Lineup for a recap of all the major market news and events from around the world, including the latest US and international COVID trends.
Thirty-four years ago today, the S&P 500 experienced what was at the time (and remains now) the largest ever single-day percentage decline losing just over a fifth of its value. The crash of 1987 has a lot of lessons for investors, but one important one is that time is on your side when it comes to investing. If you were a dip buyer and stepped in right at the close on 10/19/87 and held through now, your annualized return, not including dividends, would have been an impressive 9.2%. But what if you had the worst possible timing and decided to get long the market on the Friday before Black Monday? Surely, you would have felt pretty stupid on Monday afternoon. However, if you were able to lick your wounds and put the pain of those losses behind you, and hold through the present, the annualized return of your investment would have still been 8.5% (not including dividends). Sure it’s not as good as you would have done if you waited a couple of days and put that money to work after the crash, but it’s still nothing to turn your nose at. When making investment decisions, sitting on your hands sometimes is one of the better decisions you can make.

Start a two-week trial to Bespoke Premium to read today’s full Morning Lineup.