Bespoke’s Matrix of Economic Indicators – 2/28/22
Our Matrix of Economic Indicators provides a concise summary analysis of the US economy’s momentum. We combine trends across the dozens and dozens of economic indicators in various categories like manufacturing, employment, housing, the consumer, and inflation to provide a directional overview of the economy.
To access our newest Matrix of Economic Indicators, start a two-week free trial to either Bespoke Premium or Bespoke Institutional now!
Wage Expectations Surge in Dallas
The receding of COVID case counts and higher oil prices had a beneficial impact on manufacturers in the eleventh district in February. The Dallas Fed’s Manufacturing Outlook Survey was forecast to see Business Activity rise only slightly from 2 in January to 2.8 after three straight months of declines. Instead, the index surged 12 points to 14 which is the biggest one-month gain since June 2020 and the highest reading since October.

As we have seen with other regional Fed manufacturing surveys this month, breadth across components has been somewhat mixed in spite of the move in the headline index. While there are a handful of categories in the upper end of their historical ranges, others like Company Outlook and Inventories have been more middling. Additionally, six categories decelerated month over month.

One area that experienced a decline was in regards to output. Production and Capacity Utilization both fell in February. For the former, that was the third decline in a row leaving it at the lowest level since January of last year. Capacity Utilization is also at the lowest level in a year and a month, but this month’s decline was far smaller than the prior month’s 9.4 point drop.
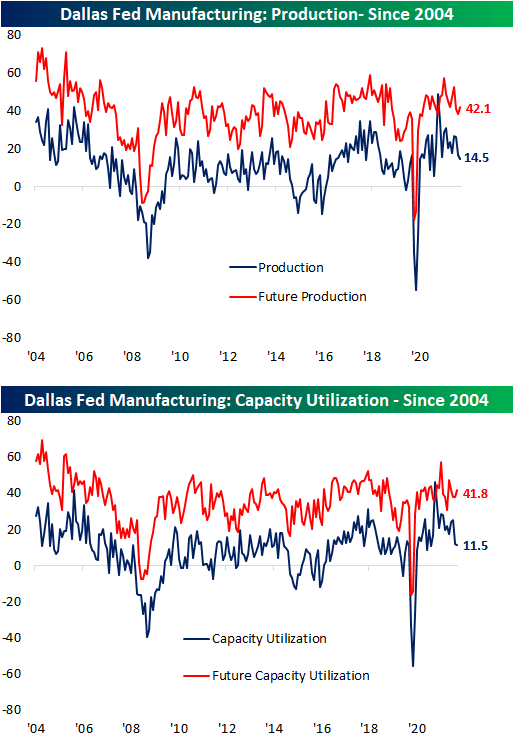
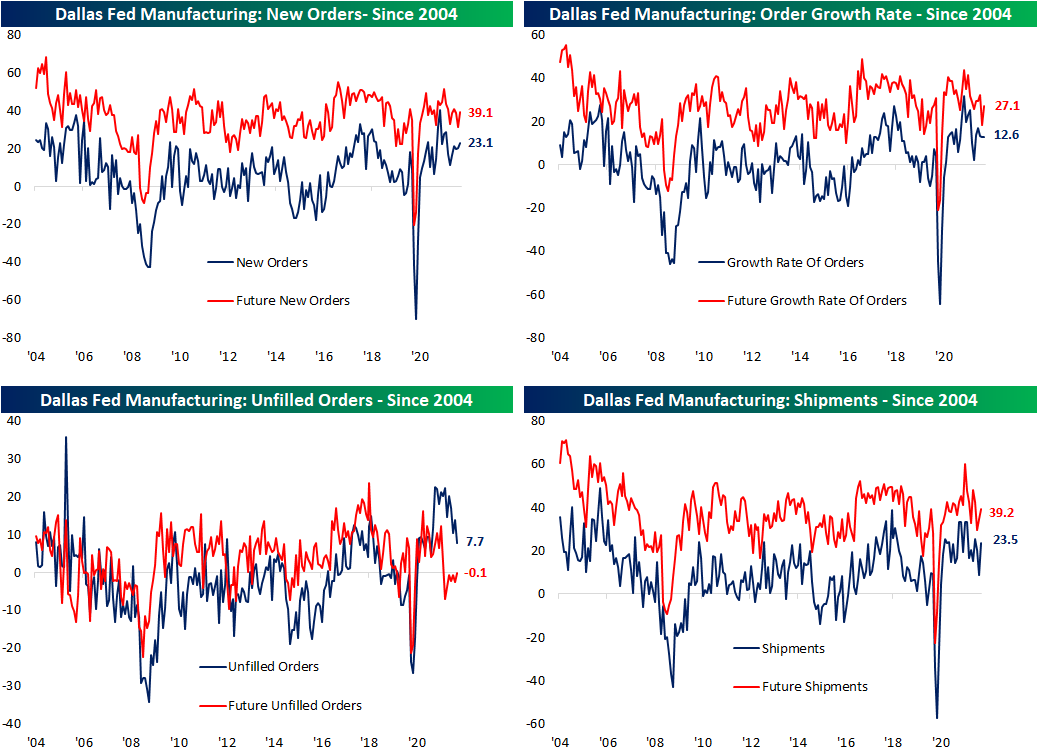
While production has pulled back, Order Growth Rate held firm as New Orders hit the highest level since July. Meanwhile, order backlogs continue to fall from historic levels with this month marking the lowest reading since last January as shipments recovered some of the declines from the past few months.
Employment was perhaps the most interesting area of the report. While the region’s firms continue to report net hiring, the Employment index plummeted 9.3 points for the largest single-month decline since March 2020. That deceleration in new employees happened alongside a deceleration in Hours Worked and Wages & Benefits as well. While current conditions for the Wages and Benefits index was lower, expectations have been blown out of the water. That index not only set a new record high, but it did so on the largest one-month gain to date. In other words, hiring slowed slightly in February, but there are widespread plans to increase wages in the future. While it is hard to pinpoint the exact reason for that increase, one potential explanation can be firms trying to raise wages to entice new workers. Click here to view Bespoke’s premium membership options.
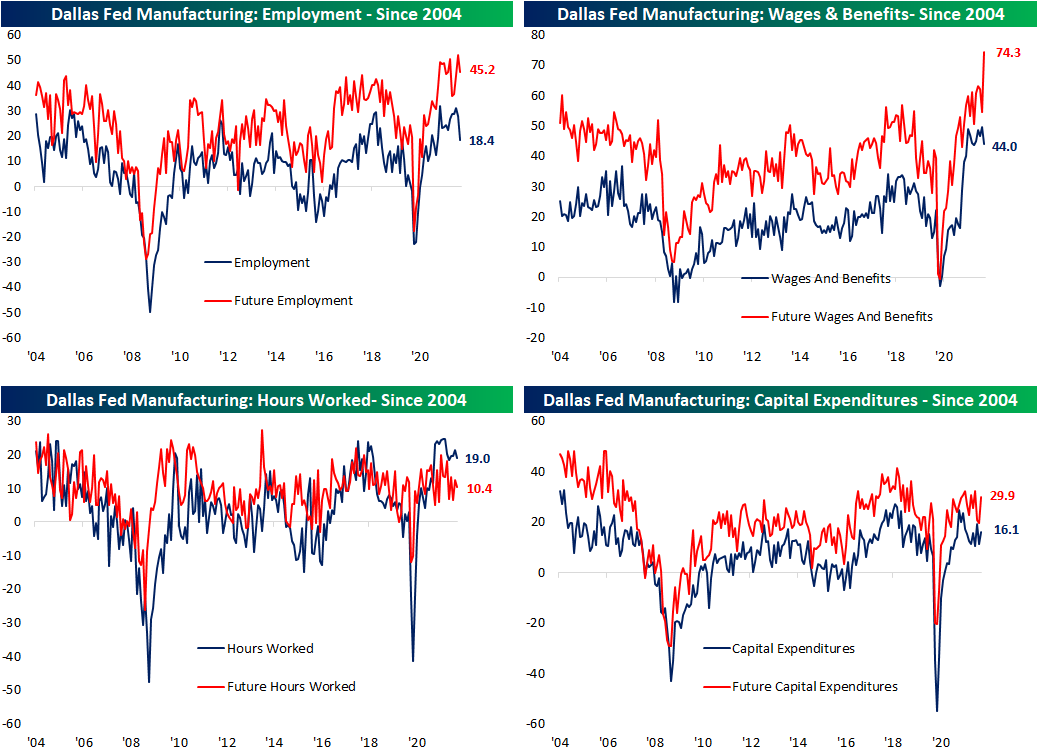
Chart of the Day – March Intra-Month Performance
Bespoke’s Morning Lineup – 2/28/22 – Down But Not Out
See what’s driving market performance around the world in today’s Morning Lineup. Bespoke’s Morning Lineup is the best way to start your trading day. Read it now by starting a two-week trial to Bespoke Premium. CLICK HERE to learn more and start your trial.
“The two most powerful warriors are patience and time.” – Leo Tolstoy
Some periods of time or more eventful than others, and this past weekend was one of the more news-jammed weekends we have seen in years as nearly the entire world has unified against Russia’s actions in Ukraine. Futures are lower this morning in reaction to the continued hostilities, but there are a ton of moving parts to contend with. Make sure to read this morning’s full recap of all the events in today’s Morning Lineup.
Read today’s Morning Lineup for a recap of all the major market news and events from around the world, including the latest US and international COVID trends.
Despite the weak picture in the futures market, equity prices still remain well above their lows from last week, and within the commodity space, we’ve seen a similar picture play out. For both gold and WTI crude oil, last night saw early moves higher at the open, but neither commodity was able to rally enough to take out the intraday highs from last week. Besides the fact that they weren’t able to take out those highs, both commodities have also given up much of their early gains. Gold is now 3.4% off last week’s high of 1,976.5 per ounce while WTI is down 4.72% from its high of 100.54 per barrel. Those highs from last week will be key levels to watch. Nobody knows how things are will play out from here, but last week’s highs in gold and crude oil are important milestones to watch. As long as they are able to remain in place, the better sign it is that the worse of this crisis could be behind us.


Start a two-week trial to Bespoke Premium to read today’s full Morning Lineup.
Bespoke Brunch Reads: 2/27/22
Welcome to Bespoke Brunch Reads — a linkfest of the favorite things we read over the past week. The links are mostly market related, but there are some other interesting subjects covered as well. We hope you enjoy the food for thought as a supplement to the research we provide you during the week.
While you’re here, join Bespoke Premium with a 30-day free trial!
Inflation
After Long Covid, U.S. Businesses Get Ready for Long Inflation by Shawn Donnan and Emma Kinery (Bloomberg)
Amidst extremely stressed supply chains, high commodity prices, and extremely tight labor markets, US businesses are getting more comfortable and used to the idea of raising prices to solve profitability challenges. [Link; soft paywall, auto-playing video]
Why This Economic Boom Can’t Lift America’s Spirits by Josh Mitchell (WSJ)
While the unemployment rate has plunged, consumer spending is booming, and wage gains are rapid, Americans are feeling much less optimistic about the economy compared to recent periods of weaker growth. [Link; soft paywall]
Crime
Miami Street Gangs See No Hope In Dope. They’ve Switched To Identity Fraud Fueled By Russian Hackers by Thomas Brewster (Forbes)
With stiff penalties and lots of competition (not to mention physical danger) in drugs, semi-organized criminals are turning to white collar crimes as lower hanging fruit. [Link; soft paywall]
Three men plead guilty to planning U.S. power grid attack, driven by white supremacy by Kanishka Singh and Sarah N. Lynch (Reuters)
A small terrorist conspiracy to violently attack the American power grid has led to guilty pleas from conspirators per plea agreements recorded this week. [Link; soft paywall]
China
Beijing Olympic Ratings Were the Worst of Any Winter Games by Tiffany Hsu (NYT)
It wasn’t just your imagination: this Olympics wasn’t good. China’s winter games drew only a little better than half of the viewership the prior games in Korea reported. [Link; soft paywall]
China Is About to Regulate AI—and the World Is Watching by Jennifer Conrad and Will Knight (Wired)
New rules introduced by Chinese regulators will change how algorithms that dictate pricing, determine search results, and power a galaxy of different consumer tech are managed, a first in the world. [Link; soft paywall]
Renewables
U.S. offshore wind auction bids top $1.5 billion, with more to come by Nichola Groom (Yahoo!/Reuters)
The largest-ever sale of offshore wind development rights in the US got major interest from 14 different companies despite efforts by homeowners to restrict development based on protection of views from summer homes. [Link]
Million-Dollar Home Listings Dry Up for Wealthy Suburban Buyers by Prashant Gopal (Bloomberg)
Large footprint suburban homes have evaporated off the market as dual-income Millennials seek breathing space with big budgets. The result is a massive price boom for the McMansion. [Link; soft paywall, auto-playing video]
Markets
Heavily Hedged Traders Have Been Awaiting a Stock-Market Storm by Vildana Hajric and Katie Greifeld (Yahoo!/Bloomberg)
Short interest has risen and put options have flown into the hands of speculators nervous about a market decline, making the drop in equities this week less painful than it might otherwise have been. [Link; auto-playing video]
Ukraine Swaps Signal 90% Chance of Default as Russia Attacks by Laura Benitez (Bloomberg)
Financial markets are pricing high odds of a default for Ukraine, but the aggressor is also being punished thanks to sanctions and fears over political disruption. [Link; soft paywall]
Read Bespoke’s most actionable market research by joining Bespoke Premium today! Get started here.
Have a great weekend!
The Bespoke Report — The Putin Put?
This week’s Bespoke Report newsletter is now available for members.
In this week’s Bespoke Report we cover the crazy action seen across financial markets this week along with a look at bearish sentiment, valuations, seasonality, and more. To read this week’s full Bespoke Report and access everything else Bespoke’s research platform has to offer, start a two-week trial to one of our three membership levels.


Daily Sector Snapshot — 2/25/22
The Bespoke Metaverse Index
Bespoke’s Metaverse Index tracks 40 companies with exposure to the continued rollout of the metaverse. We outlined seven components of the metaverse and selected the companies that have either spoken about their metaverse plans or have the capabilities to fulfill metaverse needs within these categories.

Bespoke’s Metaverse Index is available at the Bespoke Premium level and higher. You can sign up for Bespoke Premium now and receive a 14-day trial to read our Metaverse report. To sign up, choose either the monthly or annual checkout link below:
B.I.G. Tips – Death by Amazon – 2/25/22
In this note we update performance of our “Death By Amazon” and “Amazon Survivors” indices. The rebound from the COVID shock led to massive outperformance of retail-related stocks like those in our “Death By Amazon” index which made up its entire performance lag versus the broad market since 2012. Since November, that outperformance has trailed off dramatically as “meme” stocks that happen to be in the portfolio trail off and the broad market declines. Since inception, total returns for the DBA are roughly in-line with the overall market.
As for “Amazon Survivors,” since 2016 there’s been significant outperformance that is entirely driven by their performance in the recovery from the COVID drop. Over the past five and a half years, this group of stocks have substantially outperformed the market as a whole. More recently, though, the index has lagged, underperforming the broad market in a manner similar to the “Death By Amazon” index.
Our “Death By Amazon” index was created many years ago to provide investors with a list of retailers we view as vulnerable to competition from e-commerce. In 2016, we also created our “Amazon Survivors” index which is made up of companies that look more capable of dealing with the threat from online shopping. To see how the two indices have been performing lately and view the full list of stocks that make up the indices, please read our newest report on the subject available to Bespoke Premium and Bespoke Institutional members.
To unlock our “Death By Amazon” and “Amazon Survivors” indices, login or start a two-week free trial to either Bespoke Premium or Bespoke Institutional.
Bespoke’s Morning Lineup – 2/25/22 – Where it Stops, Nobody Knows
See what’s driving market performance around the world in today’s Morning Lineup. Bespoke’s Morning Lineup is the best way to start your trading day. Read it now by starting a two-week trial to Bespoke Premium. CLICK HERE to learn more and start your trial.
“Don’t blindly follow someone, follow market and try to hear what it is telling you.” – Jaymin Shah
After trading lower most of the night, futures have seen a significant turnaround leading up to the opening bell. Although not nearly as dramatic as Thursday’s intraday reversal, major US indices are currently looking at steady gains. Whether that holds into the closing bell ahead of the weekend remains to be seen. The catalyst behind this morning’s strength has been calls for diplomacy from China in settling the Ukraine conflict and apparent signals from Russia that they too are ready to have diplomatic talks. At the same time, though, the Russian military says it has seized control of a key airport outside of Kyiv.
Economic news this morning was generally positive Durable Goods, Personal Income, and Personal Spending all surpassing expectations while inflation data was mostly inline with expectations.
Read today’s Morning Lineup for a recap of all the major market news and events from around the world, including the latest US and international COVID trends.
Yesterday, we noted that the Nasdaq 100 ETF’s (QQQ) positive reversal was just the third time in its history that the ETF gapped down more than 3% at the open and finished the day more than 3% higher. The other two days were in April 2000 and May 2001. Neither of those two prior days were followed by positive returns for US stocks. Widening out the criteria a little more, yesterday was only the 14th time that QQQ gapped down 2% at the open and finished the day higher. Once again, the vast majority of prior instances occurred during the dot-com bust, but they weren’t exclusively confined to that period, and there have also been a handful of prior occurrences since the end of the financial crisis that occurred late in market selll-offs as well. In other words, the jury is still out, and given the catalyst behind yesterday’s downside gap (a major geopolitical conflict) it’s probably not a good idea not to read too much into one day’s action.

Start a two-week trial to Bespoke Premium to read today’s full Morning Lineup.