Daily Sector Snapshot — 3/16/22
Bespoke Baskets Update — March 2022
Poor Outlook From Homebuilders
After a small and brief pullback at the start of the month, the national average for a 30-year fixed rate mortgage has continued to press higher hitting 4.46% as of the most recent reading from Bankrate.com. That is now the highest level of a 30 year fixed mortgage since the start of 2019. While the costs to finance a home have risen drastically, homebuilder sentiment has continued its decline. The NAHB’s headline number on the subject fell another 2 points to 79 in March marking the third monthly decline in a row. While the decline in present sales was modest and traffic was actually up 2 points, futures sales were the major drag, falling 10 points to the lowest level since June 2020. That ties November 2018 for the third-largest month-over-month decline on record. The only two months with larger drops in this index were December 1987 (12 points) and April 2020 (39 points).
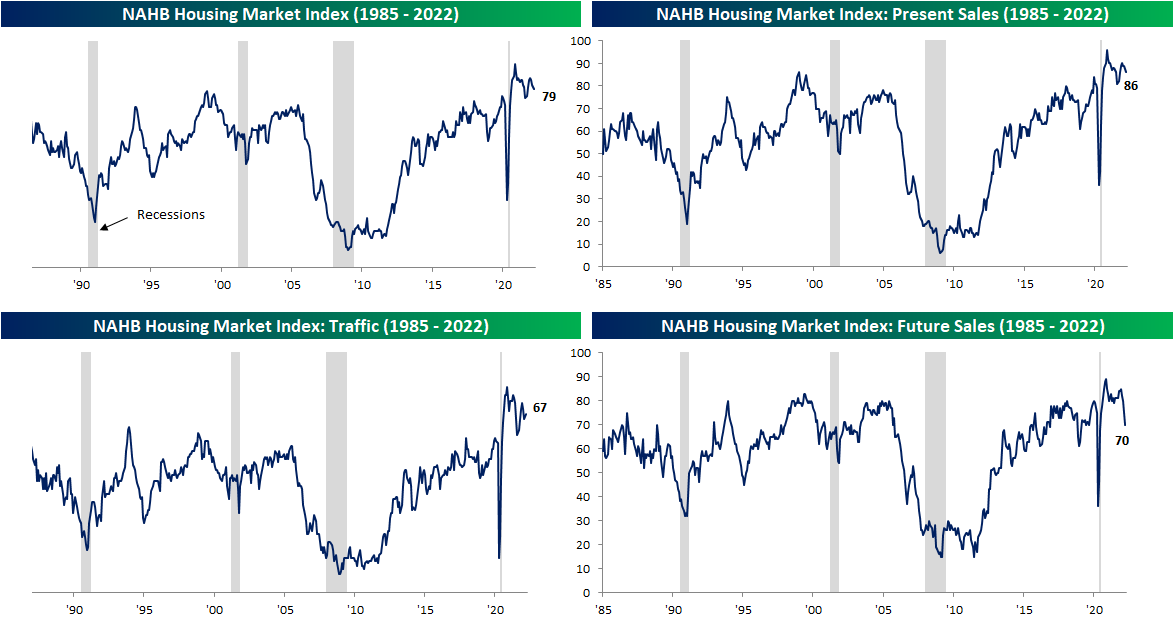
Regionally, it was a similar picture in which one index saw far weaker results than the others. Homebuilders in the Northeast have seen sentiment collapse all the way down to 60 which is again the weakest reading since June 2020. While sentiment in the South has also fallen, it is nowhere close to as significant of a low. Meanwhile, the Midwest and West actually saw unchanged to improved sentiment.Click here to view Bespoke’s premium membership options.

Howard Shultz Returns as SBUX CEO
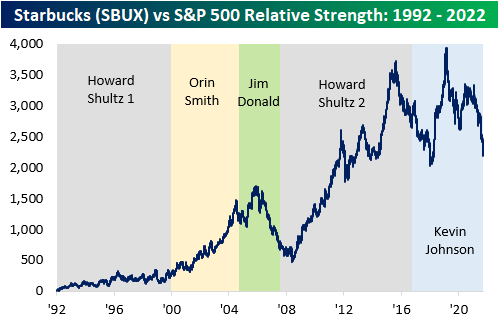
Today, Starbucks (SBUX) announced that Howard Shultz would assume the reins of CEO for the third time. When the company IPO’d in 1992, Shultz was at the helm and remained there until 2000, when he passed the torch to Olin Smith. In 2005, Jim Donald assumed the role, before Shultz returned as CEO in the heart of the great financial crisis (2008). In 2017, Shultz passed the role on once again, and Kevin Johnson became CEO.
Today’s news has the stock up sharply, and when looking at the historical performance of SBUX when Schultz was at the helm, today’s rally makes sense. During his first stint as CEO, SBUX booked an annualized return of 37.8% (not including dividends), which is the highest of any CEO in the company’s history. His first successor, Orin Smith, also saw strong gains during his tenure, but when Smith left, the stock’s performance under Jim Donald was lousy with an annualized decline of nearly 12%. With SBUX seemingly losing its way, Howard Schultz stepped back into the CEO chair, and the stock surged with annualized gains of 22.2% from 2008 until he handed the reins over to Kevin Johnson in 2017. Performance under Johnson’s tenure, however, has been lacking with annualized gains of ‘only’ 7.4%.

Below is a graph summarizing the performance of SBUX relative to each CEO’s tenure. As you can see, Kevin Johnson would have done quite well if not for the massive pullback that occurred over the last few months. Due to factors beyond Johnson’s control, SBUX is currently over 29.3% off its highs. Shultz has worked through broader market pullbacks before, and after stepping back into the CEO role in 2008, the stock performed incredibly well until news hit that he would be leaving the helm again.

Although the above chart is relevant, there were a multitude of economic and political factors that affected performance during each CEO’s tenure. To help adjust for market moves, we also looked at the relative strength against the S&P 500 to determine a truer sense of each CEO’s strength as a leader. Shultz’s last tenure in office was astoundingly strong relative to the performance of the S&P 500. Johnson has struggled to deliver the same alpha as Shultz, only passing him on a relative strength basis for a brief time. The current relative strength reading is below that of the last day of Shultz’s last tenure, which may explain Shultz’s return and the fact that the stock is rallying on the news. Jim Donald is the only other CEO to have seen a loss in relative strength during his tenure. Click here to try out Bespoke’s premium research service.
None of the information in this post or any opinions expressed constitutes a solicitation of the purchase or sale of any securities or commodities. This is not personalized advice. Investors should do their own research and/or work with an investment professional when making portfolio decisions. Past performance of any investment is not a guarantee of future results. Bespoke representatives or clients may have positions in securities discussed or mentioned in its published content. See our full disclaimer at bespokepremium.com/interactive/legal/.
B.I.G. Tips – Retail Sales Disappoint
Chart of the Day: S&P 500 Performance on Fed Days by Chair
Bespoke’s Morning Lineup – 3/16/22 – Move Over Fed Put, Hello Daylight Savings Time
See what’s driving market performance around the world in today’s Morning Lineup. Bespoke’s Morning Lineup is the best way to start your trading day. Read it now by starting a two-week trial to Bespoke Premium. CLICK HERE to learn more and start your trial.
“There’s no one thing that’s true. It’s all true.” – Ernest Hemingway
Global equities are surging this morning following yesterday’s rally in the US. In Asia, Chinese and Hong Kong stocks surged following some policy changes from the Chinese government and positive comments related to overseas listings of ADRs. Led higher by tech, the Hang Seng was up over 9%, but to put that rally in some perspective, the index is still down 2.5% over the last week. That’s how oversold Hong Kong was heading into the session!
We’ve got a busy slate of data on the docket today with Retail Sales, Import Prices, Business Inventories, and Homebuilder sentiment all coming out between 8:30 and 10:00 AM. Retail Sales were weaker than expected across the board with the ex Autos and Gas reading actually declining. One silver lining was that January’s reading was revised higher. Import Prices, however, also came in weaker than expected on both a m/m and y/y basis.
As if that wasn’t enough, the Fed will announce its first rate hike at 2 PM and then Chair Powell will hold a press conference at 2:30. And as has been the trend during his tenure, when the Fed Chair speaks, people sell. Also, don’t forget, Ukrainian President Zelenskyy will address Congress at 9 AM Eastern. It’s going to be a busy day!
Read today’s Morning Lineup for a recap of all the major market news and events from around the world, including the latest US and international COVID trends.
Yesterday, the Senate approved a bill to make Daylight Savings Time a permanent feature beginning in 2023. Obviously, the most important thing to consider when a change like this is made, is what will the impact be on the market? To answer that question, in the table below, we calculated the performance of the S&P 500 during Daylight Savings time (DST) and Standard time going back to 2007 when the start of DST was moved to early March. For each year, DST performance shows the S&P 500’s change from the March start through the November end while the Standard time performance shows the change from the start of Standard time in November through the beginning of DST in the following year.
Overall, the S&P 500’s average and median performance during DST has been a gain of 7.5% with positive returns 80% of the time. During Standard time, the S&P 500’s average performance has only been a gain of 2.01% (median: +6.4%) with gains two-thirds of the time. Overall, the S&P 500’s performance during DST is an average of more than 5 percentage points better than its performance during Standard time, and on a cumulative basis, the S&P 500 is up more than 154.8% during DST compared to a gain of just 20.0% during Standard time. If that isn’t reason enough to keep Daylight Savings Time permanent, we don’t know what is! Move over ‘Fed Put’ hello Permanent Daylight Savings Time.

Start a two-week trial to Bespoke Premium to read today’s full Morning Lineup.
The Closer — Fed Ahead, PPI Relief, Wheat Inventories, Empire Ouchie — 3/15/22
Log-in here if you’re a member with access to the Closer.
Looking for deeper insight into markets? In tonight’s Closer sent to Bespoke Institutional clients, we start out tonight by taking a look at producer prices. We then move to US inventory data, followed by demand insights. We finish with a look into the rise in inventories compared to the pace of new orders.
See today’s post-market Closer and everything else Bespoke publishes by starting a 14-day trial to Bespoke Institutional today!