Moving Averages Putting Up a Fight
Just as the S&P 500 ran into some resistance yesterday at its 200-day moving average (DMA), we’ve seen the same pattern play out in a number of commodities. Two of the more high-profile ones have been copper and crude oil.
Copper fell out of bed in the late spring and early summer, losing a third of its value. Along with the equity market, copper has seen a late-summer rally, but things came to a screeching halt right at the 50-DMA last Thursday. Copper has been down on two of the last three trading days and hasn’t been able to trade back above that elusive 50-DMA since. Click here to start a two-week trial to Bespoke Premium and receive our paid content in real-time.

Crude oil has been just as weak as copper lately, trading in a well-defined downtrend and breaking below its 200-DMA in early August. There was a little bit of a bounce last week, but resistance came into play at the 200-DMA, and after making another lower high, it has since made another lower low.
When stock, commodity, bond, or any other asset class is in a well-defined downtrend, the first thing they have to do to break out of their funks is clear resistance at key moving averages like the 50 and/or 200-DMA. In the case of copper and crude, they have both recently come up short. The S&P 500, again, is facing some resistance at its 200-DMA, but at least it has managed to clear its 50-DMA which it did in the second half of July.

Bespoke’s Morning Lineup – 8/17/22 – Not Much of a Second Effort
See what’s driving market performance around the world in today’s Morning Lineup. Bespoke’s Morning Lineup is the best way to start your trading day. Read it now by starting a two-week trial to Bespoke Premium. CLICK HERE to learn more and start your trial.
“What started as a temporary measure driven by the pandemic is now our new standard.” – Brian Cornell

Below is a snippet of content from today’s Morning Lineup for Bespoke Premium members. Start a two-week trial to Bespoke Premium now to access the full report.
After Walmart (WMT) capped off the strongest earnings season for US stocks in years, a bit of a hangover appears to have set in for investors this morning. Futures were only modestly negative in the middle of the night, but there has been a steady drift lower throughout the early morning hours to the point where S&P 500 futures have traded down over 75 basis points as we type this. Looking for a culprit, earnings don’t fit as a narrative. The most high-profile report this morning has been Target (TGT) which reported weaker-than-expected results, but the stock is only trading down 2%. Hardly enough to warrant a decline of this magnitude. Trading in Europe may be to blame as major benchmarks in the region are down following a higher-than-expected inflation report in the UK that pushed the y/y rate above 10%. With the FOMC Minutes on tap, maybe investors are fearing some hawkish text in the minutes.
Whatever the cause, after yesterday’s rally screeched to a halt just shy of the 200-day moving average (DMA), the bulls’ second effort looks pretty weak at this point. We’ll see if Retail Sales either add to the misery or put a pep in the market’s step.
Today’s Morning Lineup discusses earnings and market news from Europe and the Americas, overnight economic data, and much more.
Walmart’s (WMT) earnings report after the close yesterday marked what we generally consider to be the unofficial end to earnings season. If you’re a bull, you’re probably sad to see this one come to an end. Through yesterday’s close, the S&P 500 was up over 10% since earnings season began July 8th, and that represents the best earnings season performance for the index since the Q2 reporting period in 2009! Since the start of 2009, the just-completed earnings season also marks the 13th time that the S&P 500 has rallied 5% or more during an earnings season (six weeks from the Friday before the first big banks report numbers).
With strong performance during the reporting period, the natural question for investors is whether the gains we have seen have been borrowed from the future. Looking back at prior strong earnings seasons, that doesn’t appear to be the case. In the 12 prior reporting periods, the S&P 500’s median change from the end of earnings season through quarter-end was a gain of 2.38% with positive returns 75% of the time. That’s actually modestly better than the median gain of 1.75% and positive returns 73% of the time for the remainder of all other quarters.
Instead of borrowing from future gains this earnings season, maybe the S&P 500 was just collecting on its ‘loan’ during the June swoon?

Start a two-week trial to Bespoke Premium to read today’s full Morning Lineup.
Daily Sector Snapshot — 8/16/22
Bespoke Stock Scores — 8/16/22
Biggest Gainers Since 6/16 Low
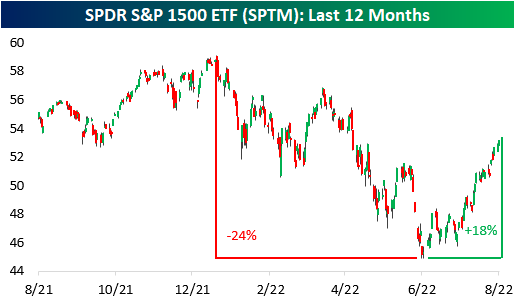
Today marks two months since the mid-June low. At the time, the S&P 1500 had declined 23.5% relative to the January 3rd high. Since then, the index has recovered substantially, gaining 17.7% off of the low. Although the S&P 1500 is still 10.0% off of its closing high, these gains have been well received by investors as the market has shown resilience in the face of rampant inflation, worsening housing data, rate hikes, supply chain constraints, and increased labor costs. This rally comes as oil prices pull back, CPI came in lower than estimated for the month of July, and earnings come in better than expected. The graph below shows the price moves in the SPDR S&P 1500 ETF (SPTM) over the last twelve months. Click here to start a two-week trial to Bespoke Premium and receive our paid content in real-time.
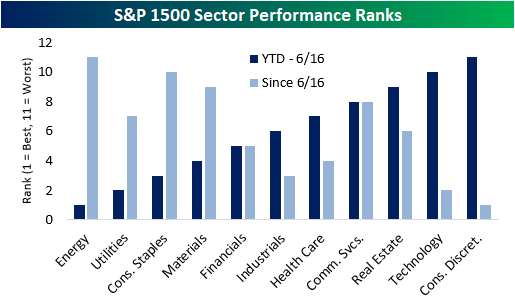
Since the June low, there has been a reversal in performance trends, as the laggards have tended to lead the way higher (on a percentage basis) while the former leaders have generally lagged. Between the start of the year and the 6/16 low, Energy and Utilities were the best performing sectors, while Technology and Consumer Discretionary were the worst. Since then, we have seen the inverse as Technology and Consumer Discretionary have been the top-performing sectors while Energy has been the worst.
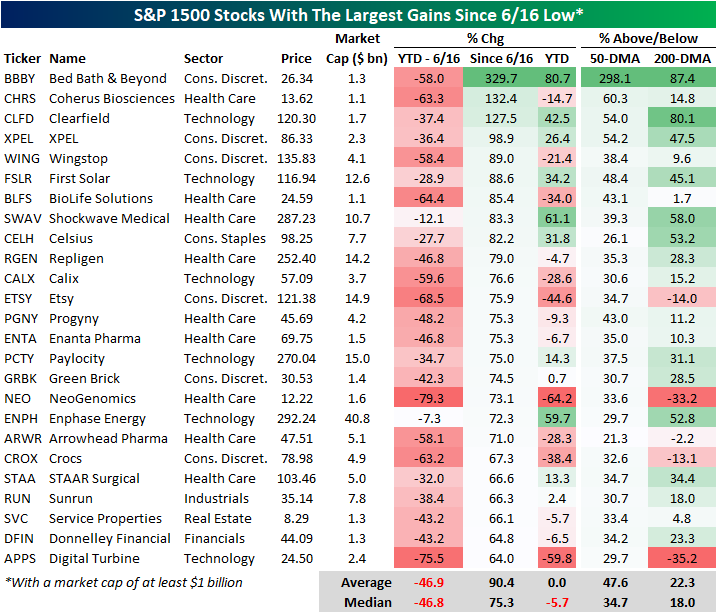
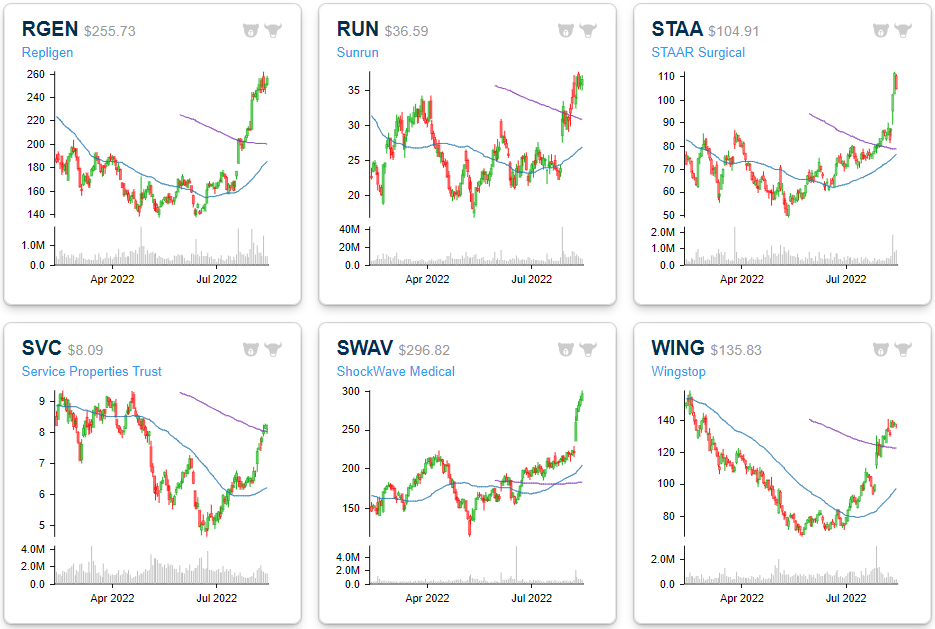
The chart below shows the 25 best-performing S&P 1500 stocks since the 6/16 low. As you can see, these stocks generally underperformed the broader index until the low, trading down by an average of 46.9%. However, since the lows, they are up an average of 90.4%, led by the newest meme stock: Bed Bath & Beyond (BBBY). Due to the drawdowns through 6/16, these stocks are still down YTD on a median basis (and even on an average basis), but they are an average of 47.6% above their 50-DMAs and 22.3% above their 200-DMAs. They’ve come a long way, and shown in the charts below, many have reached some extremely stretched levels, but even after the rallies, they still have a ways to go before coming out of the darkness. Click here to start a two-week trial to Bespoke Premium and receive our paid content in real-time.
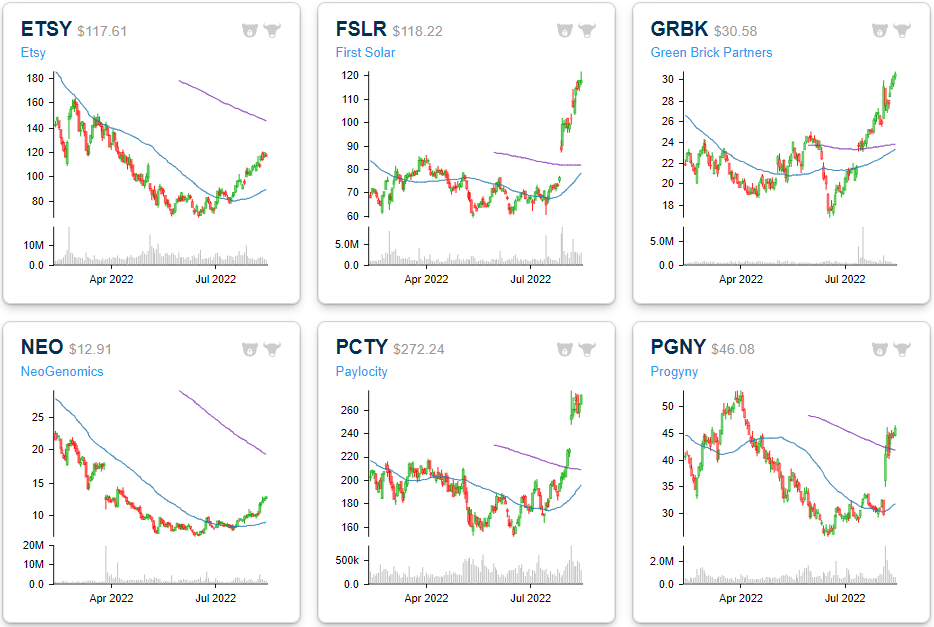
Six-month price charts for each of these stocks are included below. You can track a custom portfolio of these names by clicking here.


Housing Descending
Updates on Building Permits and Housing Starts were mixed relative to expectations for July. While Building Permits exceeded forecasts by 34K, Housing Starts missed forecasts by 81K falling to the lowest annualized rate (1.446 million) since February 2021. Housing represents a large share of the US economy on both a direct and indirect basis, so its health says about the state of the overall economy, Below we have updated our chart of Housing Starts on an average 12-month basis overlaid on top of recessions. Every recession since the late 1960s has been preceded by a rollover in the average rate of Housing Starts, and usually, the rollover starts well in advance of the recession.
For the current period, Housing Starts remain right near their highest levels of the cycle, but if you look real closely, you can see that the level peaked three months ago. Looking out over history, there are plenty of other periods where Starts declined for a few months but didn’t roll over. In other words, based on what we’ve seen so far, Housing Starts have yet to show signals of an imminent recession. Based on this month’s reading and the readings from a year ago, barring a major rebound, the 12-month average is likely to keep declining in the months ahead. Another factor to keep in mind about the historical relationship between Housing Starts and recessions is that in most cases, the recession didn’t usually begin until months after the peak of Housing Starts. Click here to start a two-week trial to Bespoke Premium and receive our paid content in real-time.

Taking a closer look at recent trends, the chart below shows the 12-month average of Building Permits and Housing Starts since the start of 2010. It’s easier here to see the decline in Starts over the last few months. Building Permits, meanwhile, have continued to trend higher.
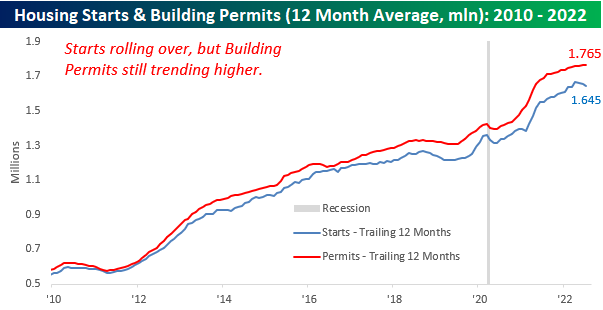
On a single-family basis, though, both Building Permits and Housing Starts have shown signs of rolling over. Single-family Housing Starts have been moving sideways for over a year now and have just recently seen an acceleration in the rate of decline while Building Permits have been trending lower for a full year now.

Finally, the chart below compares the performance of Housing Starts over time to the performance of homebuilder stocks using the iShares US Home Construction ETF (ITB) as a proxy. While the two have tended to track each other over time, over the last couple of months, ITB has rallied while Housing Starts have been dropping. Either the market knows something about future developments in the residential housing market or investors have gotten a little offside in their positioning.
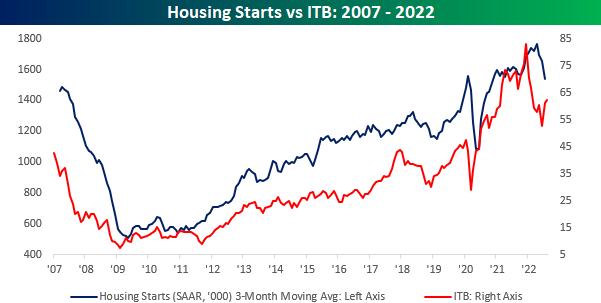
Chart of the Day: 90%+ Stocks Above 50-DMAs
Bespoke’s Morning Lineup – 8/16/22 – Checking in on the Home
See what’s driving market performance around the world in today’s Morning Lineup. Bespoke’s Morning Lineup is the best way to start your trading day. Read it now by starting a two-week trial to Bespoke Premium. CLICK HERE to learn more and start your trial.
“You should always go to other people’s funerals, or they won’t go to yours.” – George Herman Ruth
Below is a snippet of content from today’s Morning Lineup for Bespoke Premium members. Start a two-week trial to Bespoke Premium now to access the full report.
Investors generally expected a weak tone out of this morning’s updates to Building Permits and Housing Starts, and weak homebuilder sentiment provides a clue as to why. Yesterday’s update on homebuilder sentiment from the NAHB for the month of August showed that the US residential housing market is rapidly cooling off. Take the last four months, for example. In three of these four, the headline sentiment reading from the NAHB has missed expectations by at least five points. Historically, the reported reading in this index tends to come in by +/- two points relative to expectations, so misses of five or more aren’t very common. Put another way, before this May there were only ten other months since early 2003 where the headline reading missed expectations by five or more points.

Besides the fact that the last four months have been so weak relative to expectations, it has also now been nine months and running that the headline homebuilder sentiment report has been either in line with or lower than expectations. The last time Homebuilder sentiment was better than expected was back in November! The current streak without a better-than-expected reading now ranks as the second longest since at least 2003. The only streak that was longer came during the early stages of the housing crash in August 2006.

Start a two-week trial to Bespoke Premium to read today’s full Morning Lineup.