Bears Back Above 50%
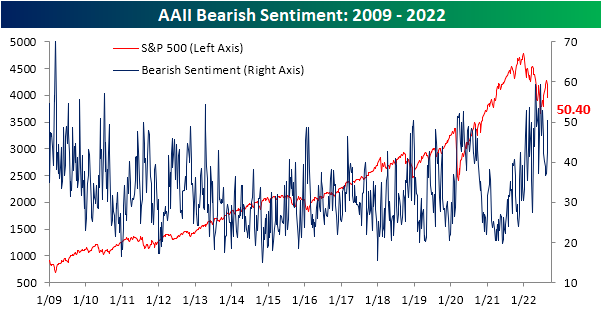
In the wake of Jackson Hole and more hawkish than previously expected Fedspeak, the S&P 500 is on pace for its worst week since June. As a result, recent improvements in investor optimism have been entirely given back. The AAII survey of individual investors saw only 21.9% of respondents report as bullish this week. That is the worst reading in two months as the back-to-back declines over the past two weeks total 11.4 percentage points.

That was matched with a considerable increase in bearish responses. For the first time since early July, over half of respondents reported a pessimistic outlook for equities. Bearish sentiment’s eight percentage point week-over-week increase was the largest since mid-June and the third weekly increase in a row.
The inverse moves of bullish and bearish sentiment resulted in the bull-bear spread to quickly move down to the worst level since the start of July. That follows a string of readings only a couple of weeks ago in which bears outnumbered bulls by only single digits.

Given the reversal in the spread, the streak of negative readings presses on. Now at 22 weeks long, it ties the 1990 streak for the second longest on record.

The AAII survey was not alone in showcasing a much more pessimistic tone of investors. Both the NAAIM Exposure Index and the Investors Intelligence survey also pivoted to more bearish readings. Combining these three results, the average reading on sentiment has fallen back to more than one standard deviation below the historical norm. Although that is not as pessimistic of an aggregate sentiment reading as earlier this year, there have only been a handful of other times going back to the mid-2000s in which the investment community had as negative of an outlook towards the equity market. Click here to learn more about Bespoke’s premium stock market research service.

Bespoke Market Calendar — September 2022
Please click the image below to view our September 2022 market calendar. This calendar includes the S&P 500’s average percentage change and average intraday chart pattern for each trading day during the upcoming month. It also includes market holidays and options expiration dates plus the dates of key economic indicator releases. Click here to view Bespoke’s premium membership options.

Just Another Average Year for Prices At the Pump
Or should we say a below-average year? This summer has been quite an interesting one for American drivers. After a record surge earlier this year, the national average price of a gallon of gas, according to AAA, has retraced much of its increase. During August alone, the national average price declined 9.1%, which was the largest August decline since at least 2005 compared to an average August decline of 0.27%. Even more notable is that with a YTD increase of 16.5%, this year’s increase now ranks below the historical average of 18.0% (median: +14.2%). Before we all start leaving our cars running while running into 7-11 for a Slurpee, we would note that prices are still extremely high. At a national average price of $3.83 per gallon, we haven’t seen prices this high at the end of August since 2012.

The chart below compares the YTD change in the national average price of a gallon of gas this year to the average YTD change since 2005. Could you have ever imagined back in mid-June, when prices were up over 50% YTD, that by the end of August prices would be up less than average?

Earlier, we noted that prices have been trending steadily lower for several weeks now. The current streak of daily declines now ranks as the second longest since at least 2005. Similarly, the chart below shows the number of days by year that average prices increased during the June, July, and August summer months. Since the start of June, there were only 13 days when the national average price increased, and they were all in early June. Since then, prices have been lower every day. The only years with fewer positive days during the summer months were 2007 and 2016. Since July 4th, this was also the first year that prices were down every day from July 4th through the end of August. Click here to learn more about Bespoke’s premium stock market research service.

Chart of the Day: 60/40 Portfolios Fall 14% YTD
Continuing Claims Catching Up
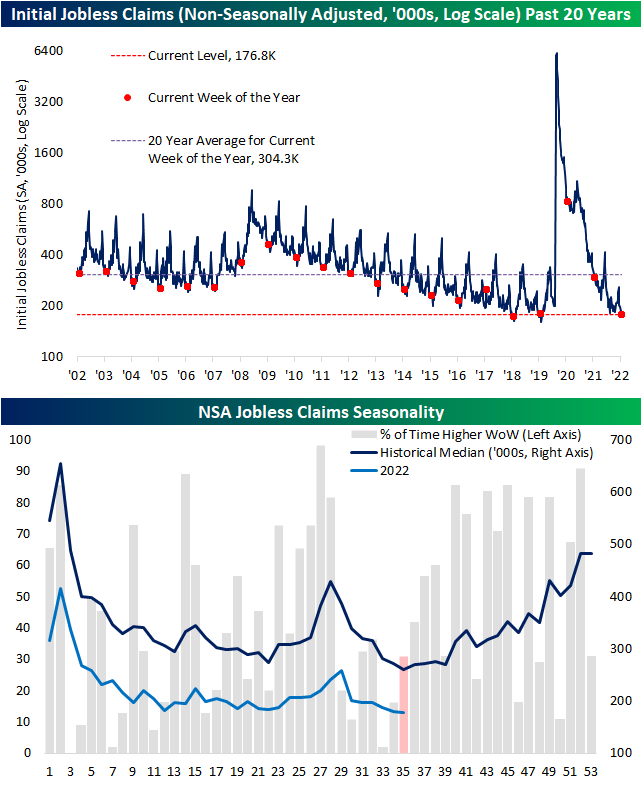
Initial jobless claims had a strong showing this week as the previous reading was revised lower by 6K to 237K. From that revised level, claims fell another 5K down to 232K marking the lowest reading since the last week of June. That was also handily below expectations which were calling for an increase up to 248K. With another week over week decline, claims have now fallen for three weeks in a row; the longest streak of declines since February.

On a non-seasonally adjusted (NSA) basis, the current week of the year has historically marked the annual low. Assuming that is the case this year, 176.8K is in line with the readings from the comparable week of the year in 2018 and 2019. Although further declines are not out of the realm of possibility, assuming normal seasonal patterns, NSA claims will likely rise from here through the end of the year.
Continuing claims are lagged an additional week to initial claims.. While continuing claims remain low having avoided the same degree of upward drift that initial claims have experienced this year, this week’s reading did move up to 1.438 million. That marks the most elevated level since the first week of April.
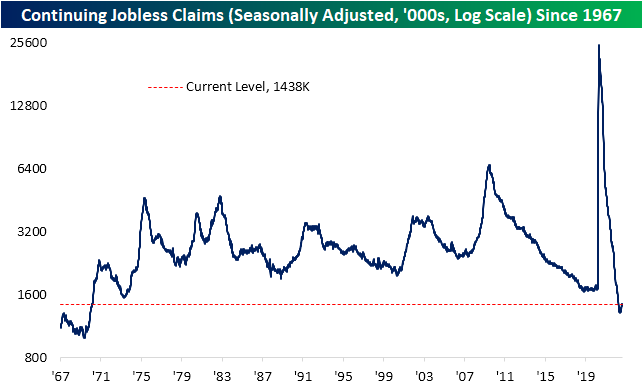
Recently we have been highlighting the ratio of initial claims to continuing claims as a way of showing the disconnect between the two seasonally adjusted readings. In other words, the lack of filter through of initial claims into continuing claims, which can be extrapolated as those filing for unemployment are quickly finding new roles. Although the ratio remains well above the historical norm and especially the range of readings observed since the early 1990s, it has begun to roll over in the past five weeks. As for just how big of a drop it has been, the decline ranks in the bottom 2% of all 5-week moves on record. While that is not to say the overall claims picture (initial claims not turning into continuing claims) has completely turned around, it is a sign that continuing claims have been playing a degree of catch-up. Click here to learn more about Bespoke’s premium stock market research service.

Bespoke’s Morning Lineup – 9/1/22 – Flood of Economic Data
See what’s driving market performance around the world in today’s Morning Lineup. Bespoke’s Morning Lineup is the best way to start your trading day. Read it now by starting a two-week trial to Bespoke Premium. CLICK HERE to learn more and start your trial.
“Someday computers will make us all obsolete.” – Bobby Fischer

Below is a snippet of content from today’s Morning Lineup for Bespoke Premium members. Start a two-week trial to Bespoke Premium now to access the full report.
The new month is kicking off on an even busier than normal note in terms of economic data. At 8:30, we’ll get the usual weekly jobless claims reports which are both expected to rise modestly. They will be joined with Non-Farm Productivity and Unit Labor Costs. Then, since it’s the first day of the month, at 10 AM we’ll get the releases of Construction Spending and ISM Manufacturing. Both reports are expected to show weakness relative to their prior readings, but the Prices Paid component of the ISM report is expected to slow falling from 60.0 down to 55.3.
Futures are lower heading into the opening bell which would put the S&P 500 on a five-day losing streak ever since Powell’s speech last Friday in Jackson Hole. Outside of the US, international markets were also broadly weaker overnight and into this morning on hawkish central bank commentary and slowdown concerns related to another COVID lockdown in China impacting 21 million residents of Chengdu. The 10-year yield is slightly higher trading just shy of 3.2% and oil is lower.
We’ll discuss it in more detail later today, but with the market weakness since last Friday’s Jackson Hole speech, investor sentiment has really weakened. A case in point is the weekly sentiment survey from the American Association of Individual Investors (AAII). In this week’s update, bearish sentiment surged eight percentage points rising from 42.4% to 50.4%. While readings above 50% have been more common this year, in the history of the survey since 1987, less than 4% of weekly readings have been higher than this week’s level of bearish sentiment.

Our Morning Lineup keeps readers on top of earnings data, economic news, global headlines, and market internals. We’re biased (of course!), but we think it’s the best and most helpful pre-market report in existence!
Start a two-week trial to Bespoke Premium to read today’s full Morning Lineup.
Daily Sector Snapshot — 8/31/22
First Day of the Month Trends
Earlier today, we sent out our Chart of the Day highlighting seasonal trends for the month of September. Breaking this down further, below we break down some seasonal trends for the first trading day of September relative to all other months over the last 50 years (since 1972). During this span, the first trading day of September has been weaker than the first trading day of any other month with the S&P 500 averaging a decline of 0.11%. However, the positivity rate is above 50% and the median performance is a gain of 0.05%, and much of the negativity comes after the index posts a gain in August.
Over the last 50 years, September has averaged a loss of 0.32% (median: -0.07%) on the first trading day of September following gains in August, trading lower 54% of the time. On an average basis, September has been the worst first trading day of the month following gains in the prior month, but when it comes to both median and positivity rates, August is worse. On the other hand, when August resulted in losses for the S&P 500, September has averaged a gain of 0.16% on the first trading day of September, posting gains 59% of the time. Click here to learn more about Bespoke’s premium stock market research service.

The chart below is included to help you visualize the comparative performance of the first trading day in September relative to other months. Perhaps one of the more surprising aspects of this chart is that fact that despite being known as a positive month, positivity rates on the first trading day of December have been weak. Along with August, it is the only month where the first trading day of the month has been down more often than it has been up regardless of whether the prior month was up or down.

August Declines All Around the World
The end of August is here and US equities, as measured by the S&P 500 ETF (SPY), have been on a wild ride. At the mid-month high, SPY was sitting on a 4.3% month-to-date gain, but that has more than entirely been erased as it is on pace to finish the month down closer to 3.5%. The country ETF of each other major global economy that we track in our Global Macro Dashboard is a similar story. Across these countries, on average, they had reached a 3.13% gain at their month-to-date highs, but today they are down an average of 3.5% MTD. Overall, developed markets have faired much worse than emerging market countries with average declines of 4.82% versus 1.24%, respectively. In fact, there are only two ETFs—Brazil (EWZ) and India (INDA)—that are currently positive for the month. Meanwhile, China (MCHI) is unchanged. On the other end of the spectrum, Sweden (EWD) has been the worst performer nearing an 11% decline with a number of other European nations following up with the next worst performance.
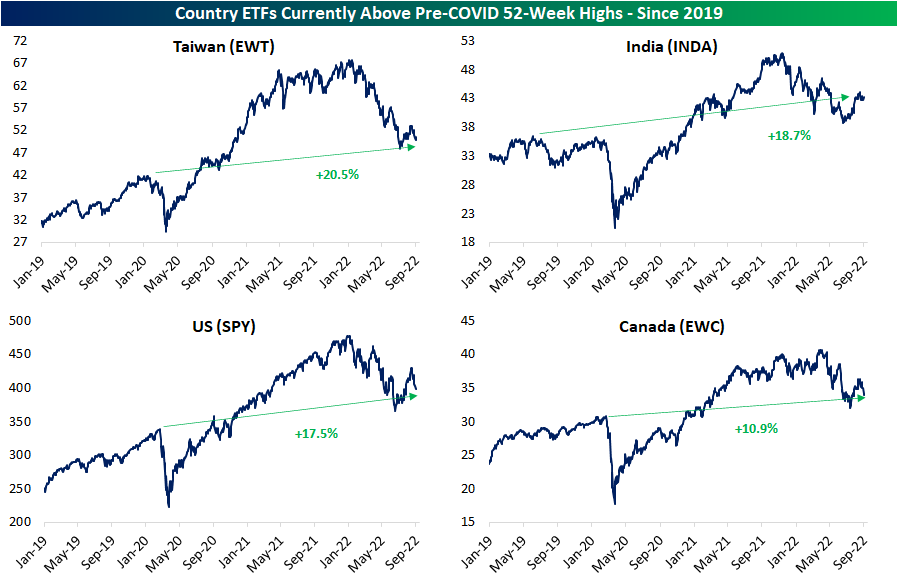
With stock markets around the world giving up the ghost in August, most have moved back below their 50-DMAs or even into oversold territory. There are no country ETFs more than one standard deviation above their moving averages although EWZ and INDA have only moved out of overbought territory in the past week.

As we show in the table above, this year’s declines have resulted in the average country ETF falling 24% below its 52-week high. Those declines bring the vast majority of these countries back below pre-COVID highs as well. At the moment, there are only four countries that remain above pre-COVID 52-week highs: Taiwan (EWT), India (INDA), the United States (SPY), and Canada (EWC). This exclusive group would need to fall substantially further to revert back to those prior highs, and as shown in the chart below, each one would also still have support at lows from earlier this year before pre-COVID highs become a technical level worth eying. Click here to learn more about Bespoke’s premium stock market research service.