Chart of the Day – Rent Disinflation’s Long Runway
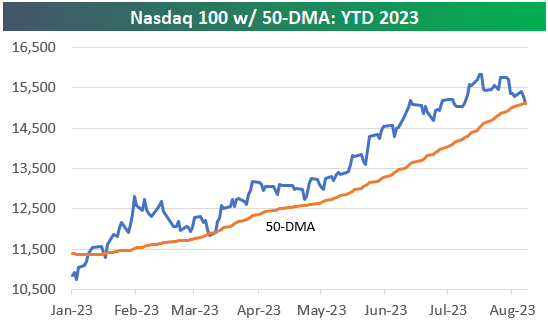
Bespoke’s Morning Lineup — Nasdaq 100 Breaks 50-DMA — 8/10/23
See what’s driving market performance around the world in today’s Morning Lineup. Bespoke’s Morning Lineup is the best way to start your trading day. Read it now by starting a two-week trial to Bespoke Premium. CLICK HERE to learn more and start your trial.
“Everything looks nicer when you win.” – Billy Martin

Below is a snippet of content from today’s Morning Lineup for Bespoke Premium members. Start a two-week trial to Bespoke Premium now to access the full report.
US equity index futures are pointing to a higher open as of 8:10 AM ET as the world awaits US CPI for July due out at 8:30. Weekly Jobless Claims are also due out at the same time. As highlighted yesterday, YoY CPI is set to end a streak of twelve monthly declines in a row.
Yesterday, the Nasdaq 100 closed below its 50-day moving average for the first time in 103 trading days. Going back to 1985 when this index began, there have only been ten other streaks of 100+ trading days of closes above the 50-DMA, with the last occurring in mid-2020.

Start a two-week trial to Bespoke Premium to read today’s full Morning Lineup.
Daily Sector Snapshot — 8/9/23
B.I.G. Tips – CPI Coming Up…Literally
Chart of the Day: Dividend Dread
Bespoke’s Morning Lineup — 8/9/23
See what’s driving market performance around the world in today’s Morning Lineup. Bespoke’s Morning Lineup is the best way to start your trading day. Read it now by starting a two-week trial to Bespoke Premium. CLICK HERE to learn more and start your trial.
“Goodness is the only investment that never fails.” – Henry David Thoreau
Below is a snippet of content from today’s Morning Lineup for Bespoke Premium members. Start a two-week trial to Bespoke Premium now to access the full report.
US equity markets finished in the red yesterday, but the story of the session was the intraday rally seen from lows made around 11 AM ET right through the close. 90 minutes into the trading day, the S&P was down well over 1%, but the index rallied about 75 basis points over the final five hours of the day to close down just over 40 bps.
Heading into today’s session, futures are higher by about 20 bps. That should be enough to get the S&P above the top of the intraday downtrend channel that has formed over the last week, but whether it holds is a different story. We’ll find out in a few hours!

Start a two-week trial to Bespoke Premium to read today’s full Morning Lineup.
Small Businesses Less Concerned With Inflation
In an earlier post, we noted the improvement to small business sentiment per the latest data from the NFIB. The report also includes survey responses as to what small businesses perceive to be their biggest problems. The July report showed that small businesses have begun to take notice of easing inflation. As shown below, throughout 2022 and into portions of 2023, inflation has ranked as the number one problem among small businesses. But in July, Quality of Labor retook the number one spot as it had temporarily back in May. Meanwhile, there has been a rise businesses saying that government requirements and red tape are their number one problem, tying cost of labor for the fourth most pressing issue.

Obviously, as it still occupies the number two spot, inflation remains a major problem. Even though it is a big improvement from 37% exactly one year ago, there continues to be 21% of firms that report inflation as their biggest problem. That is also well above any reading observed pre-pandemic.

On a combined basis, cost and quality of labor are the most commonly reported problem for small businesses at 33% of responses. Unlike inflation which is hitting new lows, that is in the middle of the past few years’ range.

Historically, the NFIB survey has had sensitivities to politics with a bias towards being more optimistic during Republican administrations and vice versa. Since the Biden Presidency began, government related problems have been on the backburner given that inflation has been playing a more pressing role. However, there has been a steadily rising number of responses once again reporting government red tape or taxes as their biggest issues. That has come hand in hand with an increase in the survey’s Economic Policy Uncertainty Index which experienced a pronounced 4 point jump month over month in July.


Finally, we would note very few firms are reporting sales as their biggest problem. That is a significant disconnect from the index on actual sales changes which hit new lows in July.


Daily Sector Snapshot — 8/8/23
Small Business Sentiment Bounces Back
Small business sentiment from the NFIB’s monthly survey rebounded in July with the headline index reading 91.9 versus expectations of it rising only 0.3 points to 91.3. As shown below, small businesses are still reporting much weaker optimism than pre-pandemic or even in the first year of the pandemic, but sentiment has been making steady improvements in recent months.

In the table below, we break down each category of the NFIB’s survey. Again, the headline index remains historically low in the 14th percentile of readings. However, that is up from the 9th percentile last month. Most other categories that contribute to the optimism index also rose month over month, albeit there were multiple that went unchanged. As a result of those moves, most categories remain at the low end of their historical ranges with a couple of exceptions: Plans to Increase Employment and Job Openings Hard to Fill. Each of those readings are in the 76th and 94th percentiles, respectively. However, as we noted in today’s Morning Lineup, overall this survey’s employment metrics have pointed to softening of labor market activity.

While several categories saw stronger readings in July, none rose more than Outlook for General Business conditions which jumped by 10 points month over month. That is the second 10 point increase in a row which makes for the largest two month increase since May 2020. Although that reading showed an increase in optimism which coincides with continued improvement in the number of firms reporting that inflation pressures have eased, readings on small businesses actual operations were less rosy. Even though sales expectations were up, actual sales changes hit a new low of -13, the weakest since the spring of 2020, resulting in earnings changes to also drop.
