The Closer: End of Week Charts — 9/27/19
Looking for deeper insight on global markets and economics? In tonight’s Closer sent to Bespoke clients, we recap weekly price action in major asset classes, update economic surprise index data for major economies, chart the weekly Commitment of Traders report from the CFTC, and provide our normal nightly update on ETF performance, volume and price movers, and the Bespoke Market Timing Model. We also take a look at the trend in various developed market FX markets.

The Closer is one of our most popular reports, and you can sign up for a free trial below to see it!
See tonight’s Closer by starting a two-week free trial to Bespoke Institutional now!
Nektar (NKTR) Leaves the S&P 500
Last month, we highlighted how Nektar Therapeutics (NKTR) has been on a one-way trip lower since its inclusion to the S&P 500 in March 2018. In fact, by the time NKTR officially became a member of the S&P 500, the stock had peaked out at $108.44 only eleven days earlier. Since then, the stock has dropped over 83%. A bad reaction to the last earnings report in August when the stock fell 29.25% in a single day has only added to the pain, but also caused another issue. With the market cap being cut by $1.49 billion that day alone—on top of the $11.74 billion loss since the first day as part of the S&P 500—the company no longer met the minimum market cap requirement for the S&P 500 of $4.1 billion. Additionally, the August report also showed four consecutive quarters with negative EPS which violated the S&P 500 requirement of positive earnings for the previous four quarters. As a result, after the close yesterday, S&P announced that it would be removing NKTR from the S&P 500. Instead, it will move to the S&P 400 Mid-Cap Index with casino company Las Vegas Sands (LVS) taking its place in the S&P 500. Ironically, after falling over 80% from its high, NKTR is trading up 3.13% today in the wake of the news. Perhaps, the S&P 500 and NKTR was a combination that just wasn’t meant to be. Start a two-week free trial to Bespoke Institutional to access our interactive economic indicators monitor and much more.

Bespoke’s Morning Lineup – 9/27/19
See what’s driving market performance around the world in today’s Morning Lineup. Bespoke’s Morning Lineup is the best way to start your trading day. Read it now by starting a two-week free trial to Bespoke Premium. CLICK HERE to learn more and start your free trial.

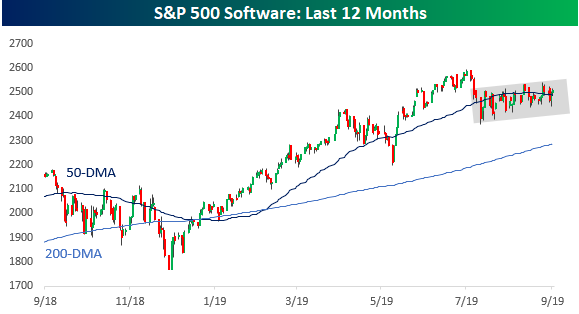
Software Coiling
We’ve discussed the S&P 500’s rangebound trading pattern of the last 20+ months numerous times here and in our client research, but in the short term, we’re seeing what’s an even tighter range for the S&P 500 Software group. As shown in the chart below, ever since the start of August when the group initially sold off, the 50-day moving average (DMA) has been acting as an anchor on the group’s price. To the upside, the group hasn’t traded more than 2% above its 50-DMA, while the maximum downside damage has been limited to less than 4%. In between, the group has had more than 25 crosses of its 50-DMA.
While the Software group is stuck next to its 50-DMA, individual stocks are trading all around the 50-DMA. The chart below is from our Trend Analyzer tool and shows where each of the 12 stocks in the group are trading relative to their 50-DMA along with how they’ve traded YTD. Currently, three stocks in the group are on the verge of being oversold – Cadence Designs (CDNS), Fortinet (FTNT), and Intuit (INTU). At the other end of the spectrum, another three stocks are overbought – ANSYS (ANSS), Synopsys (SNPS), and Microsoft (MSFT). In between, the only three stocks that are hovering right near their 50-DMAs are Autodesk (ADSK), Oracle (ORCL), and salesforce.com (CRM). The net result is that the overbought and oversold stocks essentially cancel each other out, leaving the group where it is now, stuck at the 50-day. Is this consolidation for the group the pause that refreshes or just a last-ditch effort to hang on to the year’s gains? Start a two-week free trial to Bespoke Institutional to access our interactive market tools and much more.

The Closer – PTON Flop, EMFX Review, Data Dump, Impeachment Comfort – 9/26/19
Log-in here if you’re a member with access to the Closer.
Looking for deeper insight on markets? In tonight’s Closer sent to Bespoke Institutional clients, after reviewing the flop in Peloton’s (PTON) IPO, we take a look across emerging market’s FX performance. Turning to economic data, we then cover today’s strong home sales, continuing claims, energy investment, and trade data. We finish with a look at Bloomberg’s weekly Consumer Comfort data, including a breakdown by political party.

See today’s post-market Closer and everything else Bespoke publishes by starting a 14-day free trial to Bespoke Institutional today!
The Bespoke 50 Top Growth Stocks — 9/26/19
Every Thursday, Bespoke publishes its “Bespoke 50” list of top growth stocks in the Russell 3,000. Our “Bespoke 50” portfolio is made up of the 50 stocks that fit a proprietary growth screen that we created a number of years ago. Since inception in early 2012, the “Bespoke 50” has beaten the S&P 500 by 112.4 percentage points. Through today, the “Bespoke 50” is up 228.4% since inception versus the S&P 500’s gain of 116.0%. Always remember, though, that past performance is no guarantee of future returns. To view our “Bespoke 50” list of top growth stocks, please start a two-week free trial to either Bespoke Premium or Bespoke Institutional.

Bespoke’s Sector Snapshot — 9/26/19
Financials Hold on to Broad Gains in September
In spite of the relative weakness we have seen in equities over the last week, US stocks are still poised to finish off September and the entirety of Q3 in the black. While overall breadth among industries was more positive several days ago, there are still four sectors where every industry is still in the black on a month to date basis. As shown in the graphic below, all of the industries within the Energy, Financials, Real Estate, and Utilities sectors remain in the black for the month of September. To be fair, Energy and Real Estate each only have two industries in their respective sectors, so for these two sectors, it isn’t quite as impressive. Within the Financials sector, though, all five are still up on the month while all three industries in the Utilities sector are also up MTD.
In the Energy sector, even with this month’s gains of over 4%, both industries in the sector are poised to finish Q3 with a decline. Utilities have been big winners so far this quarter, but Electric Utilities have been the clear leader with an eye-popping gain of 10.2% this quarter. Start a two-week free trial to Bespoke Institutional to access our interactive market tools and much more.

Sentiment Stagnant While Stocks Have Surged
If you pay attention to the stock market, at some point over the last 5 to 10 years, you’ve likely heard the line that “this is the most unloved bull market in history.” The chart below provides a solid portrayal of that statement as it shows the rolling 52-week average of the weekly AAII Bullish Sentiment reading. This survey is conducted by the American Association of Individual Investors and is meant to gauge individual investor sentiment levels towards the US stock market. During the 1990s, this reading generally trended upwards, but it has actually now trended downward for the last 15 years as a series of lower highs have been made. These lower highs have come as the S&P 500 has consistently made new all-time highs in recent years and doubled the level it was at back in early 2000.
As you can see in the chart, the first 50% decline that the S&P experienced when the Dot Com bubble burst didn’t cause individual investors to completely throw in the towel. While the 52-week moving average of bullish sentiment fell along with the S&P 500 during the bear market from 2000-2002, it spiked to record highs in the early stages of the 2003-2007 bull market. It wasn’t until the second 50% decline for stocks in less than 10 years that individual investors started to totally turn their backs on stocks. Since the Financial Crisis from 2007-2009, the 52-week moving average of bullish sentiment hasn’t come close to reaching levels routinely seen in the mid to late 2000s. Instead, it has faded and faded as the S&P has marched higher and higher.
The previously mentioned two 50%+ drops for stocks in less than ten years has certainly caused permanent scars for an entire generation of investors. Demographics are probably another factor for the long-term downtrend in AAII Bullish Sentiment. Older investors tend to be more cautious, and we have to assume that the age cohort of the respondents to the weekly AAII survey has increased over time. Want more research from Bespoke? Start a two-week free trial to one of Bespoke’s premium research services.

Negative Sentiment Turn
As markets have turned lower in the past week—shying away from their all-time highs—so too has bullish sentiment. Falling from 35.34% last week, 29.37% of investors in the AAII survey are now in the bullish camp. Giving up nearly all the gain from the past couple of weeks, bullish sentiment is now back to where it stood at the start of the month. This week also marked the eighth consecutive week that bullish sentiment has remained below its historical average. This week also was the 30th week (of 38 total) in 2019 that bullish sentiment was below its historical average.

As bullish sentiment fell, bearish sentiment is on the rise. The percentage of bearish investors rose 5.4 percentage points to 33.26% this week. After moving back below its historical average for the first time in six weeks last week, it is now above average, though not to any extreme degree.

While it did not rise as much as bearish sentiment, neutral sentiment also ticked higher this week by about half of one percent. Now at 37.37%, neutral sentiment has rebounded off its early August low and is the most elevated it has been since the first week of August when it was only 0.13 percentage points higher. The change in neutral sentiment over the past several weeks has now brought it back within the range that it has occupied most of this year. This week was also the third week in a row that neutral sentiment took the predominant share of sentiment. Start a two-week free trial to Bespoke Institutional to access our interactive economic indicators monitor and much more.
