Dividend Stock Spotlight: Cola Wars With PepsiCo (PEP) and Coca-Cola (KO)
PepsiCo (PEP) is one of the world’s largest food and beverage corporations. In its long history, PepsiCo has come to offer a much broader range of products than just Pepsi Cola, which was first introduced all the way back in 1893 (when the soda was named “Brad’s Drink”). At the time, the cola was actually being pitched as a healthy, energy drink by pharmacists at drugstores. “Delicious and Healthful” was one of Pepsi’s first big ad promotions in the early 1900s as it was supposed to aid in digestion as well (from Wikipedia).
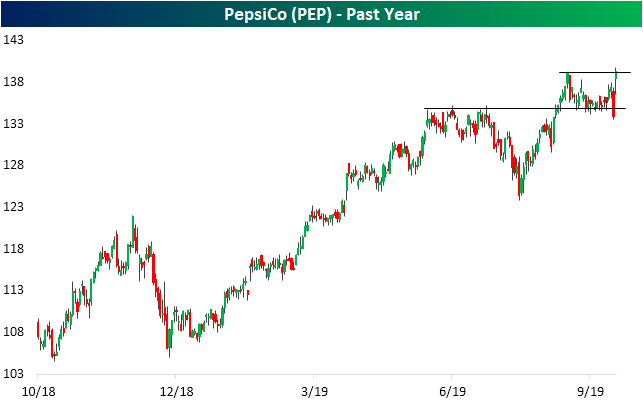
Over 125 years since its first product was created, consumers still are loving PEP’s offerings like Frito Lays and other popular sodas as the beverage giant announced strong third-quarter results this morning. EPS were reported at $1.56 per share, exceeding estimates of $1.51, while revenues came in $254 million above forecasts. This has led the stock price to respond well with a 4% rally today. That is a better than normal reaction as PEP has averaged just a +0.31% full-day change in response to earnings since 2000. In fact, over the last 19 years, this would be PEP’s sixth best one-day reaction to quarterly earnings if the gains hold into the close. From a chart perspective, this has led to a 180 from where things stood at yesterday’s close. Amidst yesterday’s broad market declines, PEP broke below support around $134. This support had been in place over the past month and could be traced back to prior resistance at spring/early summer highs. Today, the stock has reversed and the picture is much more bullish as the stock reached new 52 week highs.
In addition to solid technicals with today’s breakout, PEP also has an attractive dividend. PEP currently yields 2.75%, which is a higher yield than the broader market’s yield just under 2%. PEP is a member of S&P’s “Dividend Aristocrats” index, which is made up of stocks that have increased their dividends for at least 25 consecutive years. For Pepsi, the company has now increased its dividend for 46 consecutive years with the most recent increase being to the dividend paid in June. While the payout ratio for PEP is at the higher end among other dividend aristocrats, at 63.89%, the ratio is not overly concerning as the company has some cushion to continue to payout this dividend. Among other stocks in the Food, Beverage, and Tobacco industry, though, PEP’s dividend comes up just short of the group’s 3% average yield.
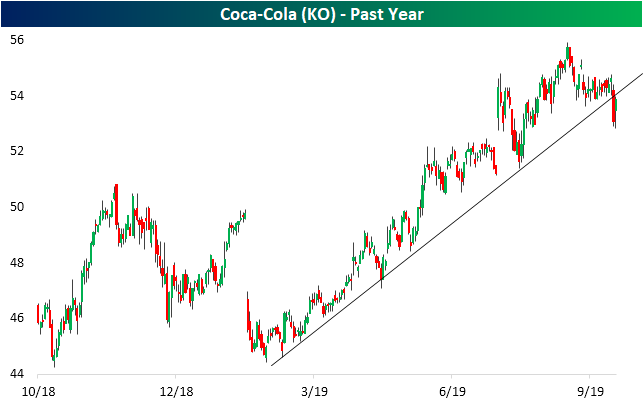
PepsiCo (PEP) stacks up closely with one of its oldest and largest competitors, Coca-Cola (KO). Like the broader industry group, Coca-Cola possesses a higher yield than that of PEP, but only slightly so at 2.97%. But KO also has a less attractive dividend payout ratio of 65.5%. Both stocks have P/E ratios right around 25. While KO is moving higher by 1.5% today on the back of PEP’s strong earnings, KO’s steep declines yesterday violated the past several months’ uptrend line from which it has not yet recovered, unlike PEP. Start a two-week free trial to Bespoke Premium for more dividend stock insights!
B.I.G. Tips -September Employment Report Preview
Recession fears continue to rise, and as potential cracks in the economy’s armor start to add up, weakness in Friday’s Non-Farm Payrolls report would definitely hurt sentiment. That’s especially the case after Thursday’s weaker than expected ISM Services report showed Employment at its weakest level in over five years. In terms of the market reaction, prior to this morning, one would have expected a weaker than expected report to be met with selling, but after today’s weaker than expected ISM Services report and the market’s subsequent positive reaction, who knows at this point!
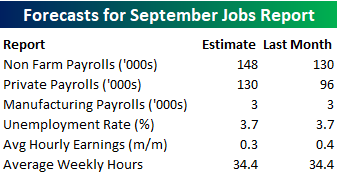
Heading into tomorrow’s Non-Farm Payrolls report, economists are expecting an increase in payrolls of 148K, which would be a slight increase from August’s disappointing reading of 130K. In the private sector, economists are expecting an increase to 130K from August’s reading of 96K. Job growth in the Manufacturing sector is expected to remain at an anemic pace of just 3K. The unemployment rate is expected to remain unchanged at 3.7%, average hourly earnings growth is expected to slow to 0.3% from 0.4%, and average weekly hours are expected to remain unchanged at 34.4.
Ahead of the report, we just published our eleven-page preview of the September jobs report. This report contains a ton of analysis related to how the equity market has historically reacted to the monthly jobs report, as well as how secondary employment-related indicators we track looked in September. We also include a breakdown of how the initial reading for September typically comes in relative to expectations and how that ranks versus other months.
For anyone with more than a passing interest in how equities are impacted by economic data, this September employment report preview is a must-read. To see the report, sign up for a monthly Bespoke Premium membership now!
ISM Services Sinks
In what could have been the most anticipated economic indicator of the week after Tuesday’s stinker ISM Manufacturing report, the ISM Services report for September was a pretty big disappointment relative to expectations. While economists were expecting the headline reading for the index to come in at 55.0, which would have been down 1.4 points relative to August, the actual reading came in at 52.6. That 3.8 point decline was the largest m/m decline since August 2016, which is also the last time the headline index was as low as it is now and the second largest one month decline of the entire expansion. Similarly, on a combined basis and accounting for each sector’s share of the overall economy, the Composite ISM report for September fell to 52.1 from 55.6. That’s also the lowest level since August 2016.

Breadth in this month’s report was mixed depending on how you look at it. On a month/month basis, half of the index’s sub-indices actually increased with the biggest gains coming from Backlog Orders and Inventory Sentiment. On the downside, New Orders and Business Activity both plunged. While m/m readings were a bit mixed, y/y readings were weak across the board with every component lower now than they were at this point last year.

In terms of the individual sub-indices, three we wanted to highlight are New Orders, Employment, and Prices Paid. First, New Orders saw the largest decline of any component this month falling to 53.7 and taking that index to its lowest level since August 2016. With tomorrow’s Non-Farm Payrolls report on deck, the Employment component of today’s ISM Services report wasn’t very encouraging as it dropped from 53.1 down to 50.4. That’s the lowest level and also the largest two-month decline for the index since February 2014. Finally, one area of the ISM Services report that had been bucking the trend lately is Prices Paid, which has now increased on a m/m basis in three of the last four months. That’s one area where we don’t want to be seeing steady increases in a sea of red everywhere else. Start a two-week free trial to Bespoke Institutional to access our interactive economic indicators monitor and much more.


Chart of the Day: Bulls Drop, But Should They Be Faded?
Sentiment Tanks
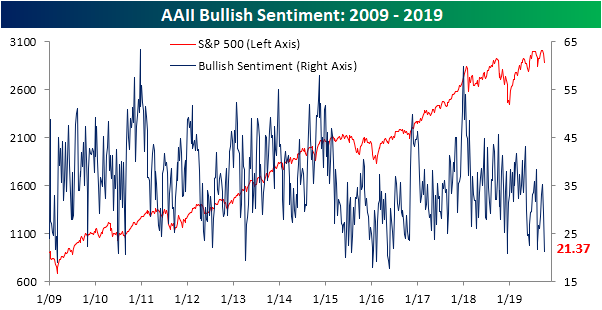
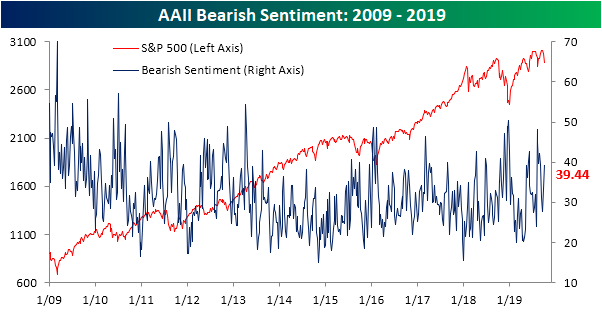
As weak economic data over the past week has sparked selling in equity markets, the S&P 500 has experienced its worst first two days to a Q4 since 2009 with the index falling just a hair under 3% so far in October. As a result, bullish sentiment has also taken a fairly dramatic negative turn. AAII‘s survey of investor sentiment only saw 21.37% of respondents report as bulls this week. That is an eight percentage point decline from one week ago. While the first couple of weeks of August saw a much sharper decline of 16.78 percentage points, this most recent drop brings bullish sentiment to its second-lowest reading of the past year. In fact, last December’s 20.9% was the only lower reading for bullish sentiment going back to 2016. Bullish sentiment is also now over one standard deviation below its historical average.
Pessimistic sentiment, rather than neutral, took the lion’s share of these losses as bearish sentiment rose to 39.44%. That is up 6.2 percentage points from last week’s 33.26% reading. While bullish sentiment has come in lower only a few times in recent memory, bearish sentiment is now back to similar levels as August. The bull-bear spread is the widest (in favor of bears) since August as well.
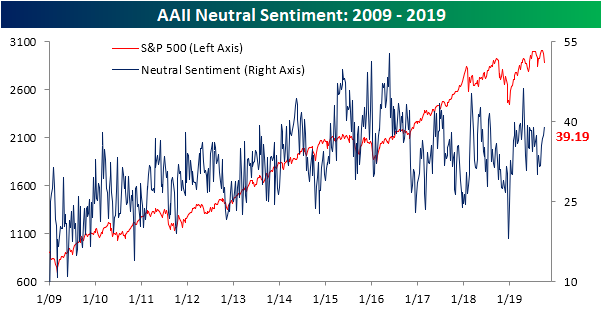
Although the largest share of losses to bulls did not go to the neutral camp, neutral sentiment nonetheless rose to 39.19%. As with bearish sentiment, this increase does not bring sentiment to any sort of historical high, but it is the highest level since late May. Additionally, neutral sentiment is back to more elevated levels that had been observed throughout the first half of this year. Start a two-week free trial to Bespoke Institutional to access our interactive economic indicators monitor and much more.
Jobless Claims Flat
Just a month ago, initial jobless claims fell to one of their lowest levels since April’s multi-decade lows. Since then claims have risen for three straight weeks, to 219K today. That is the longest such streak of consecutive increases since the back half of May and early June. Forecasts were expecting a print of 215K, which would have been unchanged from last week’s revised number. Jobless claims are now back to where they stood at the last week of August and are just 1K higher from where they stood a year ago.

With the last week of August’s datapoint of 219K being replaced by an equivalent reading this week, the four-week moving average was unchanged from last week. Interestingly, there was no change year-over-year as well. Since 2000, the only other times this has happened (no change both WoW and YoY) was on August 23rd of this year, and in August of 2007. Although claims remain at very healthy levels relative to the past, this lack of change is just another example of the deceleration in improvements that we have highlighted in the past.

Coming in at 172K, NSA claims fell 3.4K this week. Similar to the seasonally adjusted data, non-seasonally adjusted claims are right near where they stood one year ago. This week’s reading was just 0.2K lower than the current week of the year in 2018. In regards to seasonal patterns, this year’s low has most likely been put in place by now, and claims will trend higher into the end of the year. Start a two-week free trial to Bespoke Institutional to access our interactive economic indicators monitor and much more.

Bespoke’s Consumer Pulse Report — October 2019
Bespoke’s Consumer Pulse Report is an analysis of a huge consumer survey that we run each month. Our goal with this survey is to track trends across the economic and financial landscape in the US. Using the results from our proprietary monthly survey, we dissect and analyze all of the data and publish the Consumer Pulse Report, which we sell access to on a subscription basis. Sign up for a 30-day free trial to our Bespoke Consumer Pulse subscription service. With a trial, you’ll get coverage of consumer electronics, social media, streaming media, retail, autos, and much more. The report also has numerous proprietary US economic data points that are extremely timely and useful for investors.
We’ve just released our most recent monthly report to Pulse subscribers, and it’s definitely worth the read if you’re curious about the health of the consumer in the current market environment. Start a 30-day free trial for a full breakdown of all of our proprietary Pulse economic indicators.

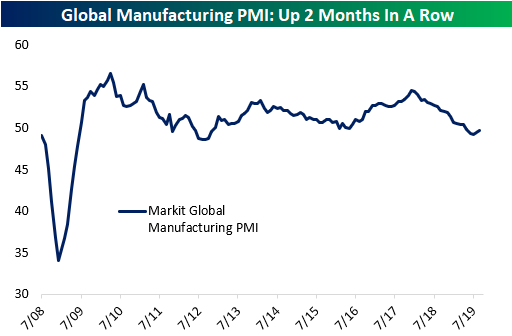
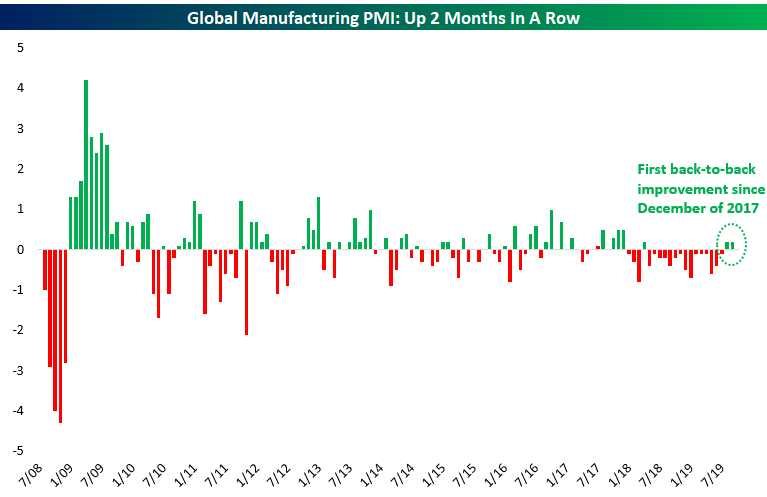
Two Months of Gains for Global Manufacturing PMI
The weak US ISM Manufacturing reading earlier this week has sent the US equity market sharply lower over the last two days. At the same time, though, we’re starting to see a pick-up in the Global Manufacturing PMI reading from Markit. Weak global manufacturing has been one of the best bear cases over the last year. But last month this reading ended a 15-month streak of MoM declines, and now it’s up two months in a row. While it’s still below the 50 level that marks the dividing line between growth and contraction, the recent strength is not to be overlooked. Start a two-week free trial to Bespoke Institutional for full access to our research and market analysis.
US Equity Indices Back to Oversold
The S&P 500 is down 2.99% over the first two days of October, which is the index’s worst start to Q4 since 2009. In 2009 the S&P fell 3.01% over the first two days of October on concerns related to an unexpected decline in manufacturing and falling auto sales (sound familiar?). After that two-day drop, though, it went on to rally 8.77% from that point through the end of the year. Investors would certainly love a repeat of that action at this point. Below is a quick look at the S&P 500’s price chart. The recent highs made in mid-September represent a pretty significant double top at this point, and yesterday’s break below the 50-day moving average was a negative as well. Heading into today, it will be important for the S&P to hold the bottom of the multi-month uptrend channel that’s currently in place, but it’s not looking great in early trading as futures are down pre-market.

Below is a look at the selloff through our Trend Analyzer tool. As you can see, US index ETFs have really tanked over the last week, falling 3-5% across the board. Last week every one of the index ETFs we track were solidly above their 50-day moving averages, and now they’re all below their 50-DMAs and either near or at oversold levels.

Looking at sectors, only the three defensives (Consumer Staples, Real Estate, Utilities) remain above their 50-day moving averages, but even they have fallen within their ranges over the last week. Materials, Communication Services, Energy, and Health Care are the sectors that have already moved into oversold territory, with Health Care the most oversold at more than two standard deviations below its 50-DMA. Start a two-week free trial to Bespoke Premium to access our Trend Analyzer tool and our popular equity market research.

Bespoke’s Morning Lineup – 10/3/19
See what’s driving market performance around the world in today’s Morning Lineup. Bespoke’s Morning Lineup is the best way to start your trading day. Read it now by starting a two-week free trial to Bespoke Premium. CLICK HERE to learn more and start your free trial.
