
JOLTS Jolted
The December Job Openings and Labor Turnover Survey (JOLTS) from the BLS showed a sharp drop in the number of available jobs in the US economy. While economists were expecting total job openings of 6.925 million, the actual level of available jobs was just 6.423 million. That’s an enormous miss! Since economist forecasts for this report are available (~2012), the latest report was the biggest shortfall relative to expectations in the history of the survey. Not only that but December’s miss followed November’s report which was also much weaker than expected (6.80 mln vs 7.25 mln forecast), ranking as the third worst report relative to expectations in the history of the survey.
With back to back weak reports, the JOLTS has now seen its largest two-month decline on record (since 2001), and it’s not even close. Behind the current two-month decline of over 900K available jobs, the next largest was in September 2015 when the two-month decline was 697K. While there was no recession in 2015, there was major weakness in the Energy sector. Furthermore, the only three other times the JOLTS fell more than 500K in a two-month span all occurred during recessions. The most notable aspect of the weakness in the JOLTS report over the last two months, though, is how disconnected it is from just about every other employment-related report we have seen recently.

While there’s been a collapse in the number of available jobs in the US economy, we would note that there are still more available jobs than there are people looking for them. The chart below compares the monthly number of job openings to the number of US Americans who are unemployed and looking for work. Prior to 2018, there was never a time in the history of the JOLTS report when there were more job openings than there were unemployed Americans. That changed in January 2018 and has been the same ever since. While the spread has narrowed substantially from more than 1.5 million two months ago, there’s still a historic amount of tightness in the labor market even if the number of job openings has suddenly started to shrink. Start a two-week free trial to Bespoke Institutional for full access to our highly sought market analysis and interactive investment tools.

Explaining Bespoke’s Custom Portfolios
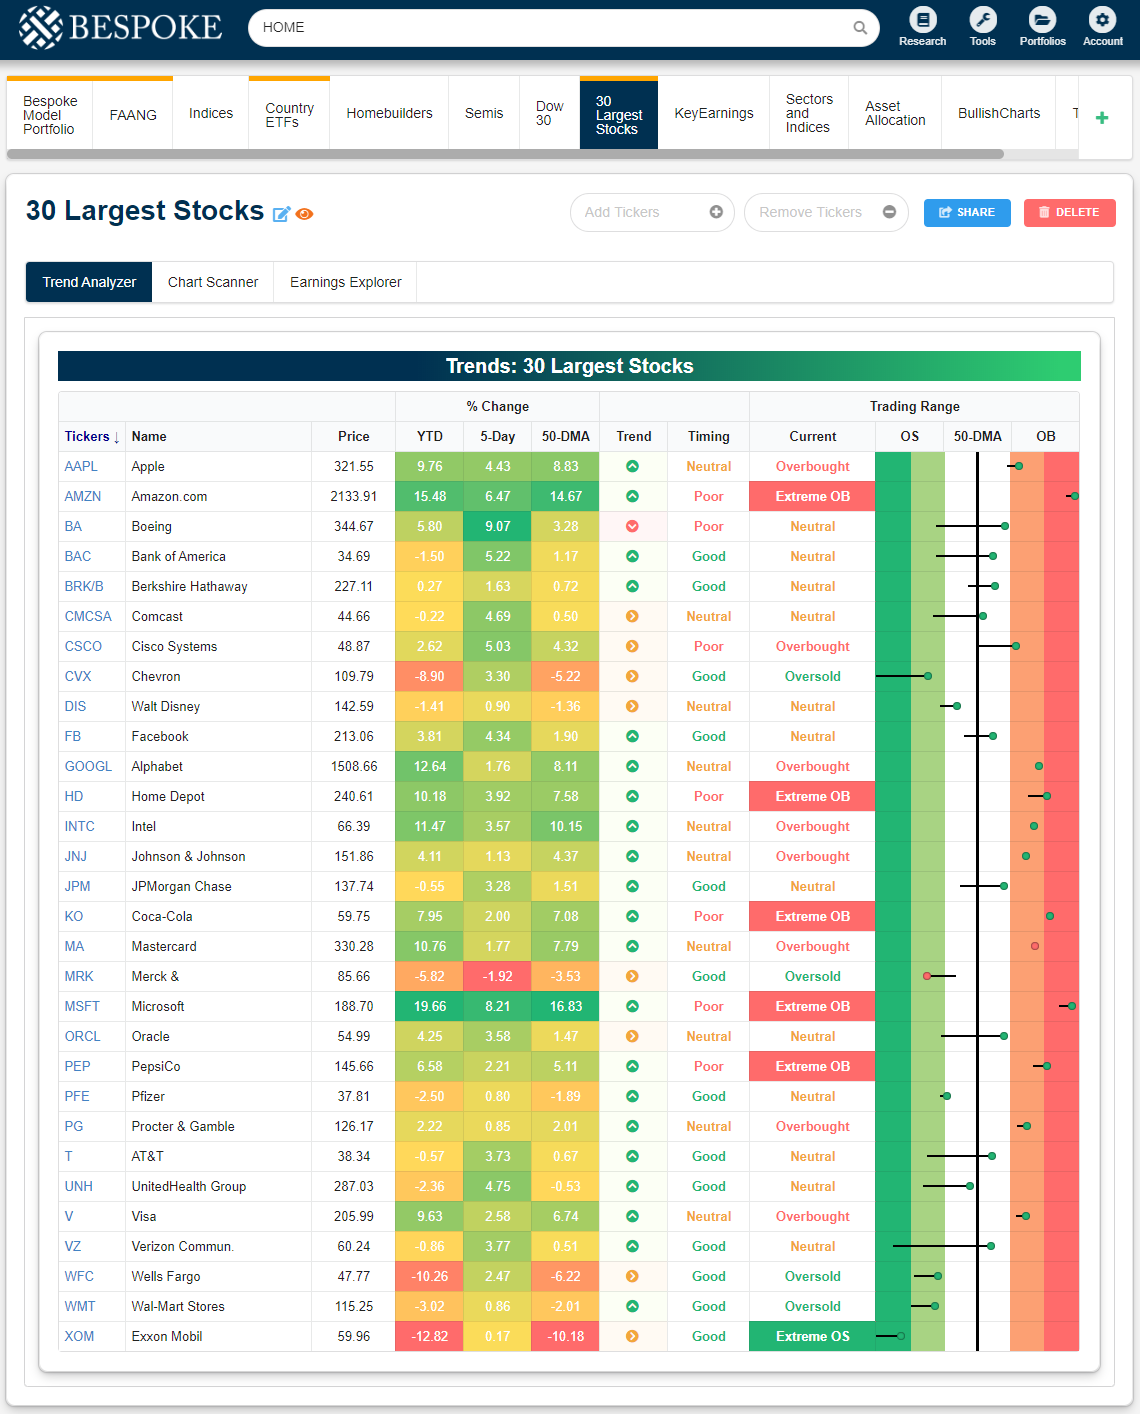
Last Friday we wrote an article outlining and explaining the many investor tools that Bespoke clients have access to. Today we want to highlight another feature available to members — our Custom Portfolios. The Custom Portfolios feature lets you monitor the specific stocks and ETFs you’re most interested in. You can build as many portfolios as you’d like, whether it’s based on your own portfolio, your watch list, or other strategies that you’d like to monitor closely or simply keep an eye on. Below is a snapshot of multiple custom portfolios that we’ve set up as displayed on the website when we’re logged in as a member. The custom portfolio we’re highlighting below is made up of the 30 largest stocks in the S&P 500.
It’s super easy to create a new custom portfolio and just as easy to add or edit tickers within each portfolio. Our Trend Analyzer tool lets you see how stocks or ETFs in your custom portfolios are trading relative to their historical trading range. This lets you know which areas of your portfolio are currently overbought or oversold and which currently have attractive (or unattractive) trend and timing scores. Simply checking this page each morning ahead of the open or after the close allows you quickly find anything that stands out or needs attention.
If you click the “Chart Scanner” tab for your custom portfolio, it immediately brings up price charts for each individual ticker. This lets you quickly scan all of the stocks and ETFs you care about most to identify anything that’s trading at key support or resistance or breaking out or breaking down. This is the quickest and easiest way we’ve found to monitor price charts for a large number of tickers.

Finally, the Earnings Explorer tab at our Custom Portfolios page keeps you updated on upcoming earnings reports for stocks you own or are following. With this feature, you’ll always know when a stock has an earnings release and also how that stock typically reacts to earnings reports. You’ll never be blindsided by an unexpected earnings report again.

One of the most helpful features of our Custom Portfolios tool is the daily email you can receive with notifications regarding your stocks or ETFs. Next to the name of each portfolio, there’s an “eye” icon that you can click to turn on the daily email notification. Each weekday, you’ll receive an email at 7 PM ET that includes any important information about the tickers in your portfolio. Below we show you where the “eye” icon is so that you can turn it on for your own custom portfolios if you’d like.

In the daily email, we let you know about any upcoming earnings reports in the next week, any big price trend changes that occur, any stocks or ETFs that made a new 52-week high or low that day, or any stocks or ETFs that experienced a price change of more than 5% (up or down) that day. Below is a snapshot of a recent email we received for our own custom portfolios.
We can’t recommend the use of our Custom Portfolios tool enough given how much we use it ourselves! If you’d like to try it out for yourself, you can start a two-week free trial to either Bespoke Premium or Bespoke Institutional now! CLICK HERE to start your free trial now!

Chart of the Day: Small Business Confidence Picks Up
Bespoke’s Morning Lineup – 2/11/20 – Simmering Confidence
See what’s driving market performance around the world in today’s Morning Lineup. Bespoke’s Morning Lineup is the best way to start your trading day. Read it now by starting a two-week free trial to Bespoke Premium. CLICK HERE to learn more and start your free trial.
For a recap of the latest on the coronavirus, trading in Asian and European markets, and a recap of the latest earnings and economic data out of Europe check out today’s Morning Lineup.

Futures are higher this morning heading into what is generally an already overbought market. The majority of index ETFs in our Trend Analyzer are all at overbought levels, but a number of small and mid-cap ETFs are still at neutral levels and have ‘Good’ timing scores.

The Closer – Reversal in Stocks & Polls, Tech Weight, Capesize Cost – 2/10/20
Log-in here if you’re a member with access to the Closer.
Looking for deeper insight on markets? In tonight’s Closer sent to Bespoke Institutional clients, we show SPY’s outside day reversal which was the first that left the ETF at an all-time high. Next, we get an update on the standings of Biden, Sanders, and Bloomberg in the Democratic primary. We then take a look at the Tech sector’s weighting in the S&P 500 relative to history. Turning to FX, we show how emerging market currencies have been impacted by the 2019-nCov saga. We finish tonight by shedding some light on the Baltic Exchange Dry Index and Capesize Index which has reached a record low.
See today’s post-market Closer and everything else Bespoke publishes by starting a 14-day free trial to Bespoke Institutional today!
Another Increase in Investor Sentiment
While a number of investor sentiment surveys ask investors for their views on the market, one less widely followed index from TD Ameritrade seeks to gauge sentiment by what investors are actually doing. According to TD Ameritrade, the Investor Movement Index (IMX):
The Investor Movement Index, or the IMX, is a proprietary, behavior-based index created by TD Ameritrade designed to indicate the sentiment of individual investors’ portfolios. It measures what investors are actually doing, and how they are actually positioned in the markets. The IMX does this by using data including holdings/positions, trading activity, and other data from a sample of our 11 million funded client accounts.
The latest update to the IMX index for January was released earlier and showed that investor sentiment improved as investors increased equity market exposure for the fourth straight month, which is tied for the longest streak of monthly improvement since early 2014. The improved readings in the IMX index over the last four months have also taken the level of the index to its highest since October 2018.
In looking at longer-term trends for the IMX index, it’s interesting to note that while sentiment has really ticked higher in the last four months, it is still nowhere near levels it was at in late 2017/early 2018 just before equities peaked and saw an 18-month consolidation period. This reinforces a broader trend we have seen in other sentiment readings recently. Namely, investor sentiment has clearly improved, but investors still have one eye warily looking over their shoulders. Start a two-week free trial to Bespoke Institutional for full access to our highly sought market analysis and interactive investment tools.

Chart of the Day: Big Spread Between Energy and Technology
President’s Day Seasonality
As seen in the snapshot from our Seasonality Tool below, the current week of the year (February 10th through February 17th) has been one of the strongest of the past decade. The 1.85% median gain ranks in the 99th percentile of all seven-day periods throughout the calendar year.

This year, that time frame (2/10 through 2/17) will bring us right into the President’s Day holiday next Monday (2/17). Since the Federal Holiday’s Act of 1971 set the holiday as the third Monday of February, the S&P 500 has experienced a median gain of 1.45% in the week leading up to President’s Day. Prior to 1971, President’s Day was observed on George Washington’s birthday on February 22nd. Taking a look at each individual day the week before President’s Day, Wednesday has experienced the strongest and most consistent positive performance. Tuesday is similarly strong with a median gain of 0.28% and a higher close 61.2% of the time. The second half of the week though is weaker with median declines on Thursday and Friday and a higher close less than half of the time.

As for the week of President’s Day itself, the shortened week sees more mixed performance for the S&P 500 with a median gain of 0.17% from the Friday before to the first Friday after. Of that week, Wednesday and Thursday have typically been the weakest days with median declines of 10 and 11 bps, respectively. Neither day has experienced a gain more than half of the time. Friday is by far the strongest day with a median gain of 0.15%. Start a two-week free trial to Bespoke Institutional to access our Seasonality Tool and other interactive tools.

This Week’s Economic Indicators – 2/10/20
On top of a busy week of earnings, last week also saw 32 economic releases scattered throughout the week, a majority of which came in stronger than expected or stronger than the prior period’s reading. January Markit and ISM gauges on the manufacturing sector led things off on Monday with both improving from December and exceeding estimates. Service counterparts later in the week showed similar improvements and beat expectations. Hard manufacturing data on Tuesday confirmed these results with the December readings on factory orders, durable goods, and capital goods all exceeding or matching expectations, albeit capital goods and durable goods excluding transportation continue to decline month-over-month. Employment data was the highlight of the week with ADP’s reading on Wednesday showing the strongest print since May of 2015 and the biggest beat relative to expectations since December 2011. That was followed by Initial Jobless Claims which came in at their lowest reading since April’s multi-decade low, and finally, Friday’s all-around solid NFP report.

This week, the economic calendar lightens up a bit with a total of 22 data points on the docket. The calendar is back-end loaded with 18 of those 22 data points coming out on Thursday and Friday. As such, there are no releases today so small business optimism from the NFIB kicks things off tomorrow morning. Optimism among small businesses is expected to tick up to 103.5 from 102.7 which would leave it in the middle of the past year’s range. The December Job Openings and Labor Turnover Survey (JOLTS) is the only other release scheduled for Tuesday which is expected to show 6,925,000 job openings in December. Wednesday will likewise be a fairly quiet day with weekly mortgage applications and the budget statement for the month of January the only releases to note.
Again, things will pick up on Thursday and Friday. In addition to the usual weekly releases (jobless claims and Bloomberg Consumer Comfort), on Thursday we will also get hourly earnings and CPI data for January. CPI is expected to be stronger on the headline level but core measures are expected to slow to a 2.2% YoY rate from 2.3% last month. Export and import price indices are out Friday morning alongside the retail sales report for January. Although there is no change expected from December’s data, core measures on sales across the board are forecast to come in weaker. Industrial and manufacturing production are also scheduled to release that morning in addition to preliminary readings for February for the University of Michigan’s Consumer Sentiment index. Start a two-week free trial to Bespoke Institutional to access our interactive economic indicators monitor and much more.

Someone Give the Nasdaq a Mint
With three of the four trillion dollar stocks (Microsoft, Amazon.com, and Alphabet) in the Nasdaq trading at all-time highs today, it’s no surprise that both the Nasdaq 100 and broader Nasdaq Composite are at record highs this morning. From a breadth perspective, though, neither index is as strong.
For starters, even though the Nasdaq 100 is at new highs, the cumulative A/D (advance/decline) line is marginally lower than its high last week. It’s far from a major divergence but does illustrate the fact that some of the largest stocks are carrying the weight of everyone else.
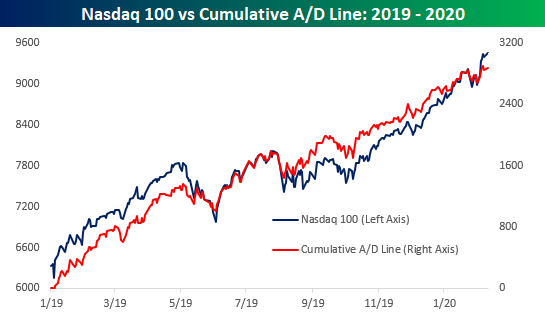
The divergence between the Nasdaq 100’s price and cumulative A/D line is hardly wide enough to get worked up over at this point, but for the broader Nasdaq Composite itself, which includes a much larger universe of smaller companies, the divergence is much more noticeable. In this instance, the Nasdaq’s cumulative A/D line saw a much larger decline than price during the most recent pullback, and the magnitude of the bounce last week and into today has been relatively anemic. This is a much more notable divergence, and one that will become a concerning trend if it continues to drag on. Start a two-week free trial to Bespoke Institutional to access our full suite of research and interactive tools.
