STOXX 50 Breaking Out
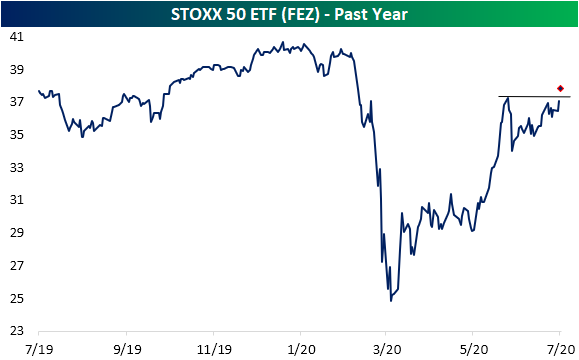
While there has been a great focus on the run-up of the largest American equities, the biggest European stocks have also been on the rise in recent weeks. The STOXX 50 (FEZ) is made up of some of the largest companies by market capitalization in the broader Euro STOXX index. In May and the first week of June, FEZ ripped higher before stalling out around 8.5% away from the January 1st 52-week high at $37.24. After sitting below that June high for the rest of June and first half of July, FEZ is finally looking to make a new high today. It is trading up over 2% pre-market which would send it over 1.5% above that June 8th high.
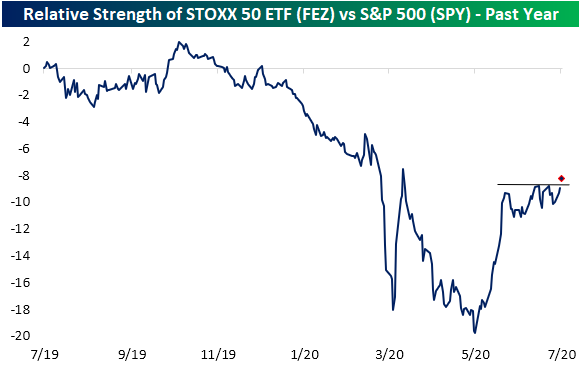
The STOXX 50 is also breaking out in terms of relative strength versus the US—S&P 500 (SPY)—based on where FEZ and SPY are trading pre-market. For most of the past year, FEZ has underperformed SPY as shown in the relative strength chart below. That reversed sharply in May but the dynamic hit the pause button in June as the line trended sideways. With FEZ up over 3% this morning and SPY up 1.35% pre-market, the relative strength line is looking to finally make a new high.
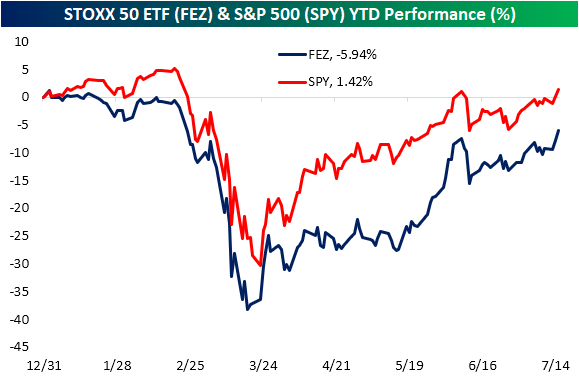
While FEZ has been outperforming a bit recently, on a year to date basis the US remains the better performer of the two. In the first quarter SPY never fell as much as FEZ and the subsequent rally currently leaves SPY up on the year while FEZ is down just under 6%. The only day that FEZ had better performance YTD than SPY was on January 2nd. Click here to view Bespoke’s premium membership options for our best research available.
Bespoke CNBC Appearance (7/15/20)
Bespoke’s Paul Hickey appeared on CNBC’s Worldwide Exchange this morning to discuss the latest news driving markets higher. To view the segment, please click on the image below. Like what you see? Click here to view Bespoke’s premium membership options for our best research available.
Tax Day Cometh. Wait. What Month is This?
It may be July but due to the government shutdowns this Spring, the Federal deadline for filing taxes was delayed by three months. With that in mind, the table below summarizes the performance of the S&P 500 in the weeks leading up to and after the Federal tax deadline over the last twenty years. Obviously, the major caveat is that the performance numbers shown from prior years are for the month of April, while this year is the only time the deadline has been in July.
Historically speaking, the S&P 500’s performance in the weeks leading up to the Federal tax deadline have been positive but hardly anything worth writing home about. In the two weeks leading up to the tax deadline, the S&P 500 averaged a gain of 0.05% but with gains less than half of the time (9 out of 20). In the week leading up to the tax deadline, the results were nearly identical at +0.06% with gains exactly half of the time. With the backdrop of those historical results, the S&P 500’s performance leading up to tax day this year has been better than average with a gain of 1.87% over the last two weeks and 0.14% over the last week.
While returns leading up to the tax deadline haven’t been anything special, returns one and two weeks after the tax deadline have been much stronger than average. One week after the Federal tax deadline, the S&P 500 has averaged a gain of 0.87%, and two weeks later the average gain has been 1.50%. The market has also been pretty consistent to the upside in the days after tax day as the S&P 500 has been up three-quarters of the time. Americans were reportedly quick to put their stimulus checks into the market back in the Spring, so will they double-down with their refund checks? Like what you see? Click here to view Bespoke’s premium membership options for our best research available.

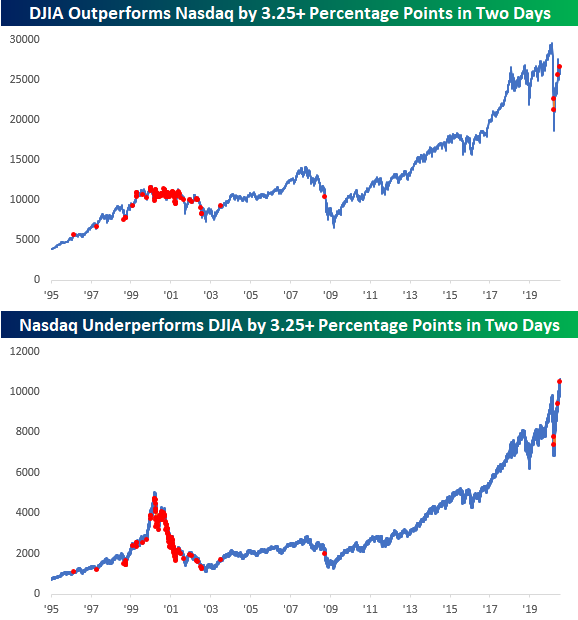
A Dow in Nasdaq’s Clothing
The last two trading days have certainly been out of the ordinary in terms of relative performance between the Nasdaq and the Dow. Since Friday’s close, the Nasdaq is down 1.2% while the Dow is up 2.2%. That performance spread of 3.4 percentage points in the last two trading days is the widest gap between the two indices (in the Dow’s favor) since May and then in March. While there have been two prior occurrences in the last three and a half months, if you take a longer view, this type of short-term outperformance by the Dow has been uncommon. Before the occurrences in March and May, you have to go all the way back to September 2008 to find the last occurrence and then before that July 2003.
Before 2002 and going back to the late 1990s, there were a number of occurrences on both the way up and even more so on the way down. Given the market’s performance following the last time we saw a high frequency of periods with similar performance gaps, let’s hope the performance disparity of the last two days doesn’t become a trend. Like what you see? Click here to view Bespoke’s premium membership options for our best research available.
Big Winners Driving The Market In 2020
So far this year, the US equity market has been a story of big winners…and then the other 99% of the market.
Seven S&P 500 stocks stand out in terms of contribution, with the “Big Five” tech or tech adjacent names (AAPL, AMZN, FB, GOOG, MSFT) and two others that get a bit less discussion (NFLX, NVDA) each accounting for at least a +0.3 percentage point impact on the overall index performance this year. On average, these top seven are up 45% YTD, versus an 11% decline for the rest of the index. That’s why the equal-weighted S&P 500 is underperforming so badly: the majority of stocks are way, way behind a furious rally in some of the biggest names.
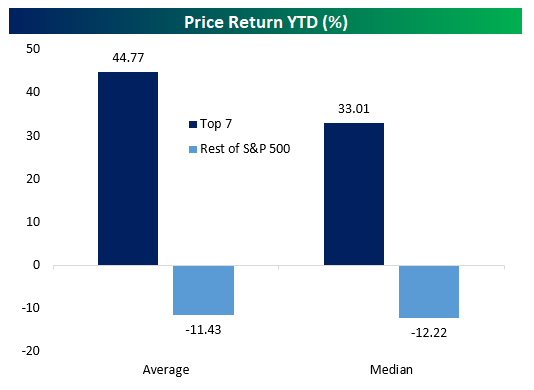
Currently, the top seven stocks by contribution have added 6.7% to the index in 2020, which itself is still down a bit over 1% on the year. That means that the rest of the stocks in the index have cost the S&P 500 over 8% in 2020. We went into further detail on contribution to total earnings as well as YTD gains in last night’s Closer report, which is available to Bespoke Institutional members. Click here to start a two-week free trial.

US Citi Surprise Index Continues to Surge
Just about a month ago, we noted how the Citi Economic Surprise Index for the United States reached a new record high as economic data broadly rebounded. In the time since then, the US surprise index has left that record in the dust. Since the first new record high on June 15th, the US index has not just continued to rise but has more than doubled with 19 of the past 22 days marking a fresh record high!
Likely helped by the US strength at least in part, the index for the entire globe has also entirely recovered. The global index is at its highest level since March of 2017 and in the 98th percentile of all readings since the start of the index in 2003. Meanwhile, that strength has not been echoed in the indices for the Eurozone and Emerging Markets. The Eurozone index fell sharply in the first half of the year. Although it has staged a rapid recovery since mid-June, it is still negative meaning reports are generally missing forecasts. Although it never fell as sharply as other areas of the globe, the index for emerging markets likewise remains in negative territory and in the bottom 13% of all readings. Click here to view Bespoke’s premium membership options for our best research available.

Chart of the Day: Nasdaq Bearish Engulfings
Chart of the Day – Sectors With Extreme Positive Earnings Revisions Spreads
Tesla Would Top a Number of S&P 500 Lists If It Was Added to the Index
We’ve tweeted a number of times in the last several days noting where Tesla (TSLA) would rank in terms of market capitalization if it were added to the S&P 500. As of Monday morning with the stock up over 10%, TSLA’s $325 billion market cap would rank it as the 10th largest company in the S&P 500. Besides market cap, though, there are also a number of other lists that TSLA would find itself near the top of. For starters, on lists of YTD performance and P/E ratios, you would find TSLA either at or near the top of the list. Another list TSLA would be near the top of is short interest.
The table below lists the 30 stocks in the S&P 500 with the highest levels of short interest as a percentage of float. At TSLA’s current level, it would rank as the 31st highest short interest as a percent of float. Looking through the list, there are a number of troubled companies or those whose businesses have been severely impacted by COVID. For starters, there are a number of cruise lines operators, including Carnival (CCL), Norwegian (NCLH), and Royal Caribbean (RCL). Concert promoter Live Nation (LYV) has also seen its short interest levels soar since COVID with just over 10% of its float sold short. While not quite as high as LYV, with 9.47% of its float sold short, TSLA would find itself just outside the list of S&P 500 stocks with the highest short interest as a percentage of float if it was in the index.

What makes TSLA’s high short interest as a percentage of float notable is that it is accompanied by such a large market cap. Normally stocks with such large market caps don’t have high levels of short interest. There are two reasons for this. First, high levels of short interest are typically due to a problem with the company in question, and therefore the market wouldn’t allow a troubled company’s market cap to get so high in the first place. Second, the amount of capital dedicated to short selling is relatively small, and therefore it’s hard to build up multi-billion dollar short positions in a single stock. Looking at the list above, though, TSLA has been a major exception as its market cap is more than 21 times the market cap of the largest stock listed above (Campbell Soup – CPB) and 38 times the average market cap of the 30 stocks listed.
Looking at this another way, the table below lists the 25 largest stocks in the S&P 500 along with where TSLA would rank if it was in the index. Of the 25 stocks listed, the average short interest as a percentage of float is 1.02% and the highest short interest is Netflix (NFLX) at 2.55%. TSLA’s short interest is nine times greater than the average of the largest 25 stocks and more than 3.7 times the level of Netflix! It’s not often that you see a situation where a company reaches the point where it has one of the largest market capitalizations of any company in the world and gets there with such high levels of skepticism. A lot of investors have made a ton of money on the back of TSLA in the last several weeks, but a lot have been taken to the cleaners too. Like what you see? Click here to view Bespoke’s premium membership options for our best research available.

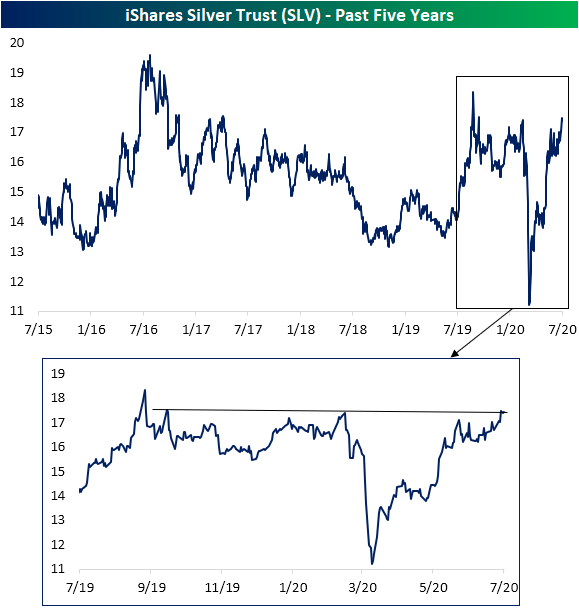
Silver At New Highs
As we noted in an earlier post, one of the best-performing commodities in 2020 has been silver (SLV). Although it has lagged its yellow metal cousin on a year-to-date basis, SLV has seen strong performance over the past few months and has more recently even begun to break out to new highs. During the market turmoil of February and March, SLV had fallen over 35.5% from its February 24th high to its March 18th low compared to a 9.86% decline for gold (GLD) over that same period. Since that low on March 18th when SLV was at its lowest level since January of 2009, the ETF has rallied 59.23% through today compared to gold’s gain of 20.6%. As shown below, with that rally continuing over the past few sessions, SLV has risen above resistance between $17.40-$17.50 that traces back to the highs in February of this year and September of last year. That leaves the next area to watch around the early September high of $18.34. Click here to view Bespoke’s premium membership options for our best research available.