Gun Background Checks Return to More Normal Range
In a sign that overall levels of anxiety across the United States may be receding, the pace of background checks for the purchase of firearms has come crashing down from record-high levels. From a peak of 4.69 million in March, background checks fell to 2.72 million in August. That level is still the second-highest total for the month of August on record, but after a steady surge with the onset of COVID and the riots across the country last summer, there has been a sharp decline in total checks over the last few months.

On a y/y basis, background checks have really swung from one extreme to the other. From last July to this June, total background checks experienced a 100 percentage point peak to trough swing falling from 79.2% down to a decline of 22.3%. Over the last two months, the rate of decline has gotten less bad, but it is still at negative 12.8%.

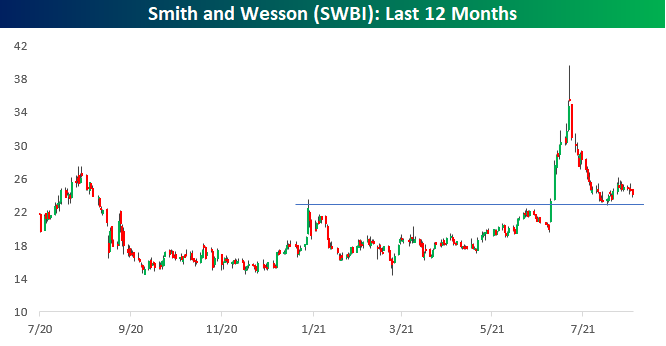
You might surmise that such a large decline in background checks wouldn’t be good for the stocks of gun manufacturers, and you’d be partly right. Below we show one-year charts of Sturm Ruger (RGR) and Smith and Wesson (SWBI). While both stocks are down significantly from their 52-week highs, they’re also far from 52-week lows. In the case of RGR, stock has pulled back from its 52-week high back in July, but for the time being it has generally held above the top end of its prior trading range from earlier this year. In the case of SWBI, the stock really surged back in late June following a strong earnings report but has been quick to give back all of its gains. Despite the large drop, though, it is still trading at higher levels now than it was in the first quarter of the year when levels of background checks were at record highs. Click here to view Bespoke’s premium membership options.

Bullish Sentiment Finally Rises in Back to Back Weeks
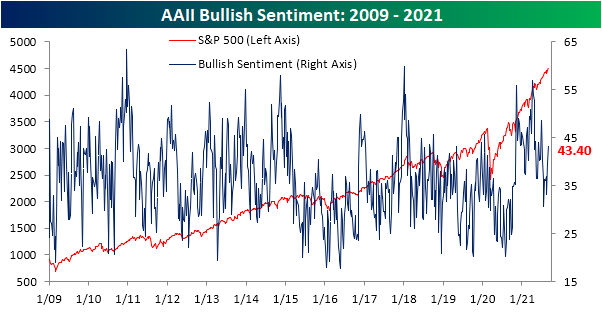
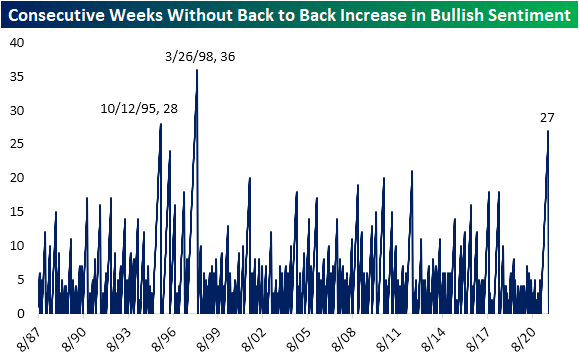
The S&P 500 has continued to press higher resulting in a coincident rise in sentiment. The AAII‘s weekly reading on bullish sentiment rose back above 40% for the first time since the week of July 8th. While 43.4% is not a particularly elevated reading on sentiment (72nd percentile of all periods), the move higher is particularly notable in that it was the first time bullish sentiment has risen in back-to-back weeks since February. That is especially surprising given the fact that bullish sentiment was very elevated at points between now and then, such as back in the spring when it eclipsed 50%. That is also a historically long stretch of time without back-to-back increases in bullish sentiment. As shown in the second chart below, at just over half of a year-long, the only two similar streaks on record were in 1995 and from 1997 to 1998.
Negative sentiment has broadly picked up over the past couple of months. In the AAII survey, bearish sentiment was slightly higher at 33.3% versus 33% last week. While below the peak from only a couple of weeks ago, that is still elevated versus readings from earlier this year.

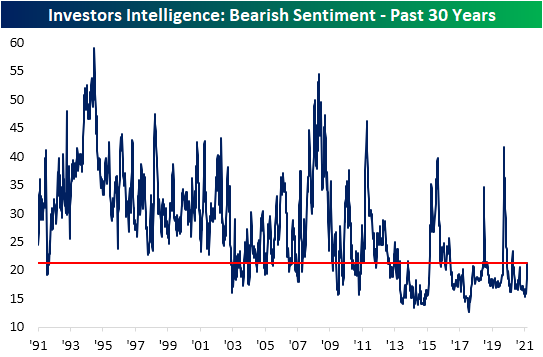
Similarly, the Investors Intelligence survey of newsletter writers has also seen bearish sentiment on the rise throughout the summer. This week, it topped 20% for the first time since March 10th. At 21.3%, bearish sentiment in this survey is at the highest level since last October. With that said, the current reading is also well below the 20 year average of 24.19%.
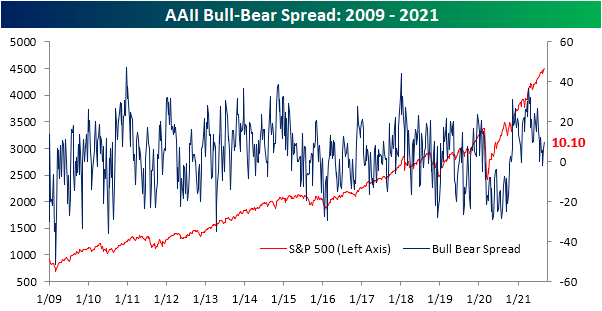
As a result of the larger gains to bullish versus bearish sentiment, optimism remains the favored response in the AAII survey. The bull-bear spread rose back into positive double digits this week for the first time since the last week of July.
Given both bullish and bearish sentiments were higher, neutral sentiment has continued to unwind. That reading fell 4.3 percentage points this week to a new low of 23.2%. That was the fourth decline in the past five weeks as neutral sentiment came in at the lowest level since mid-April. Click here to view Bespoke’s premium membership options.

Chart of the Day: Sub-Mach-E (For Now)
End of Pandemic Programs Loom
Ahead of tomorrow’s nonfarm payrolls report, this week’s initial jobless claims release came in at 340K; 5K below expectations. That was a 14K decrease from last week’s level which was revised higher by 1K. Additionally, this week’s decline entirely erased the move higher last week. With yet another drop in jobless claims, the indicator has made another pandemic low and is within 84K of the last sub-1 million print (256K on March 13, 2020) prior to the parabolic spike last spring.

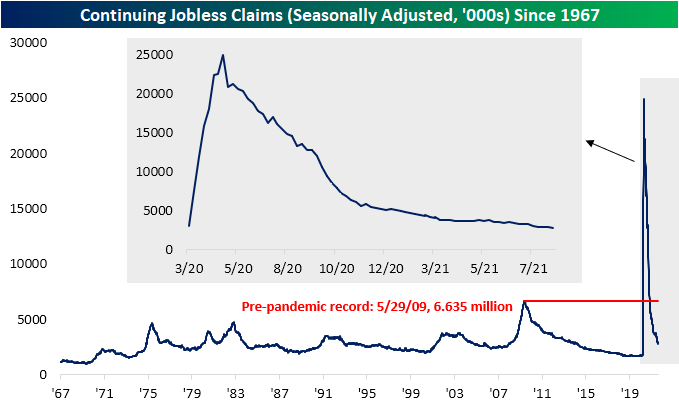
As for on an unadjusted basis, claims fell further below 300K to 287.8K this week. This time of year typically sees seasonal tailwinds for claims, but this week did mark the sixth consecutive decline. That made for another pandemic low as claims by this measure are just 35.9K away from the March 2020 levels. Granted, the seasonal strength from the past few weeks is likely to wane until the end of the year. As shown in the second chart below, September (approximately week numbers 37 through 40) historically marks the time of year that week over week increases in the unadjusted number become more frequent, and as a result, claims begin to consistently tick higher. While seasonal headwinds are on the way for regular state claims, overall claim counts will begin to see drops due to the expiration of pandemic era programs. This includes the additional $300 per week payments and programs like PUA and PEUC. In the most recent week, PUA claims came in above 100K for a fourth week in a row.


As for continuing claims, the headline number for regular state programs remains strong with claims hitting another pandemic low of 2.748 million, down from 2.908 million last week. That 160K decline was the largest since a 316K decline in the second to last week of July.
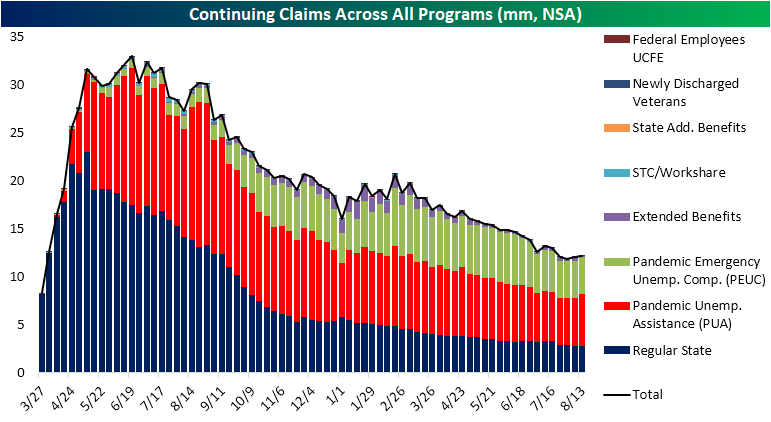
Factoring in all programs adds an additional lag to the data meaning the most recent reading is through the week of August 13th. In that week, total claims rose to 12.2 million from 12.02 million in the prior week. In spite of only having a couple of weeks until the end of the programs, that increase was driven by PUA claims which rose by over 400K and marked the largest one-week increase for the program since April 23rd (420.6K). That brings the total count of pandemic era programs (PUA and PEUC claims) a couple of weeks before their expiration to 9.2 million.
As for the other programs, regular state claims and PEUC claims were little changed at 1.6K higher and 6.04K higher, respectively. Meanwhile, the extended benefits programs saw a significant decline of 237.07K down to 114.4K, although, that program has been particularly volatile over the past several weeks, so we would caution again reading too deep into that move. Click here to view Bespoke’s premium membership options.

India (INDA) Ignites
Looking across the various ETFs tracking the stock markets of the 23 countries tracked in our Global Macro Dashboard, by far the best performer in the month of August was India (INDA) which rallied 8.75%. A large portion of those gains occurred in the final days of the month as well. As shown in the matrix below, over the past five days alone INDA has gained 4.74% which brings it almost 3 standard deviations above its 50-DMA. INDA is also currently at a 52-week high alongside the US (SPY) and Russia (RSX).
INDA is not alone in having become deeply overbought after big moves in recent days. Japan (EWJ), Russia (RSX), Malaysia (EWM), and Mexico (EWW) are also trading over 2 standard deviations above their 50-DMAs. The latter two were also the runners-up in terms of strongest performers in August. In the case of the former two, just last week they were actually in neutral territory as is the case with a number of other country ETFs. No country has seen as dramatic of a move within its trading range than South Africa (EZA), though. One week ago, it was oversold. After rallying 5.79% in the past five days, it has not only taken out its 50-DMA but is now 1.6 standard deviations above it. Looking across the aforementioned countries, and as we mentioned yesterday, one common theme in August was the outperformance of emerging market countries. Tose countries gained an average of 2.21% last month versus a 0.85% gain for developed markets.

Looking at G7 countries, the US has stood out as a notably solid performer. As shown below, the US (SPY) has been in a consistent uptrend over the past year whereas other G7 members have been sideways at best since the spring. With that said, there have been improvements more recently for some countries. The most concrete example is Japan. EWJ has been consolidating over the past few months, but it broke out of its 2021 downtrend this week. Gaining 1.74% today alone, EWJ is at the highest level since early June. France (EWQ) is also having a big day with a 2.2% gain, bringing it right up to the highs from mid-August and early June.

Like France, there are a handful of emerging market countries that have also broken out recently or are nearing a breakout. Mexico (EWW) and Russia (RSX) both took out their highs from the spring and earlier this summer in the past couple of sessions. While it has not put in a new 52-week high just yet, Taiwan (EWT) is likewise attempting to take out prior highs. Meanwhile, we also wanted to highlight the chart of INDA. As previously mentioned, INDA posted big gains over the past month, and as such, the chart is looking quite elevated. Click here to view Bespoke’s premium membership options.

Bespoke’s Consumer Pulse Report – September 2021
Bespoke Market Calendar — September 2021
Please click the image below to view our September 2021 market calendar. This calendar includes the S&P 500’s average percentage change and average intraday chart pattern for each trading day during the upcoming month. It also includes market holidays and options expiration dates plus the dates of key economic indicator releases. Start a two-week free trial to one of Bespoke’s three research levels.

Chart of the Day: One Year Anniversary of the Peak in Technology
Chart of the Day: September 2021 Seasonality
Emerging Markets Leave China Behind
In last night’s Closer, we noted the record underperformance of Chinese equities relative to the US over the past six months. As a result of the weakness in Chinese equities, the MSCI Emerging Market ETF (EEM)—which has roughly a 37% weight in Hong Kong and Chinese stocks—is well off of its highs and has been trending lower over the past several months. Today, EEM is up a healthy 1.37%, but that brings it just short of its 50-DMA which recently fell below its 200-DMA. That is also at similar levels to the lower high from the start of this month.

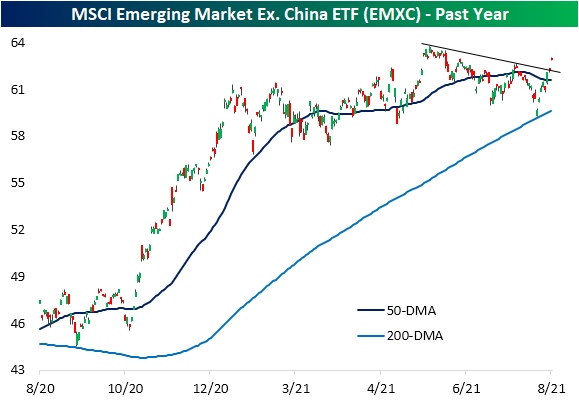
When factoring out China, emerging markets look much better. Again, the MSCI Emerging Market ETF that excludes China (EMXC) is currently 1.13% below its 52-week high, but the downtrend that has been in place since the early June highs has been on the ropes over the past couple of sessions. Yesterday saw the ETF trade and close right at that downtrend line, but the 1.15% gain today has smashed through it. That leaves EMXC at the highest level since June 15th. The ETF is also at some of the most overbought levels (1.8 standard deviations from its 50-DMA) since then.
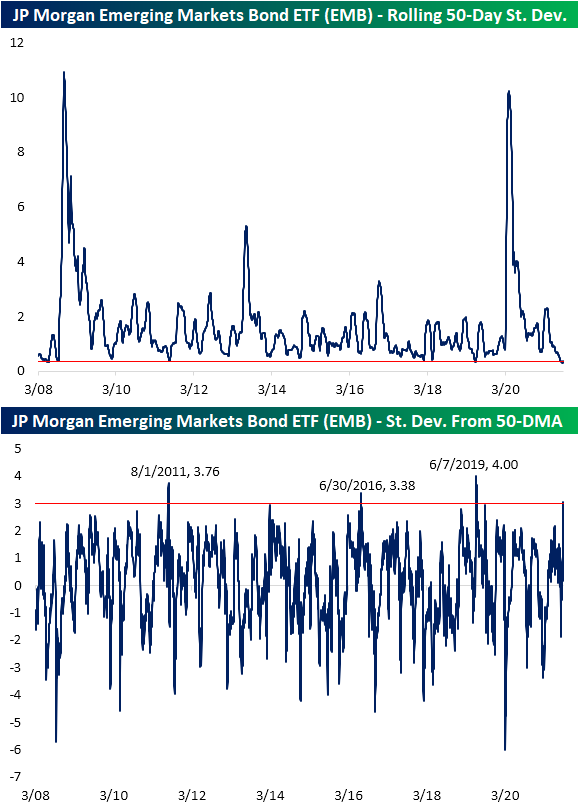
Pivoting over to bonds, looking at the Fixed Income screen of our Trend Analyzer, the best performer over the past five days is also in the EM space. The USD Emerging Markets Bond ETF (EMB) had been mostly flat throughout the summer trending right alongside its sideways 50- and 200-DMAs. Significant gains last Friday and yesterday led EMB to break out of that range as it reaches some of the highest levels since February today.

As previously mentioned, EMB has not ventured far from its 50-DMA recently. In fact, the rolling 50-day standard deviation has been right around some of the lowest levels on record since EMB began trading in 2008. Given that lack of volatility, the rip higher this week has resulted in the ETF moving well beyond the upper end of its narrow trading range. In fact, yesterday the ETF closed over 3 standard deviations above its 50-DMA. That joins only 14 other days where the ETF closed at least 3 standard deviations above its 50-DMA with the most recent of those back in June 2019 when it reached as high as 4 standard deviations above its moving average. Click here to view Bespoke’s premium membership options.