The Closer — Fed Ahead, PPI Relief, Wheat Inventories, Empire Ouchie — 3/15/22
Log-in here if you’re a member with access to the Closer.
Looking for deeper insight into markets? In tonight’s Closer sent to Bespoke Institutional clients, we start out tonight by taking a look at producer prices. We then move to US inventory data, followed by demand insights. We finish with a look into the rise in inventories compared to the pace of new orders.
See today’s post-market Closer and everything else Bespoke publishes by starting a 14-day trial to Bespoke Institutional today!
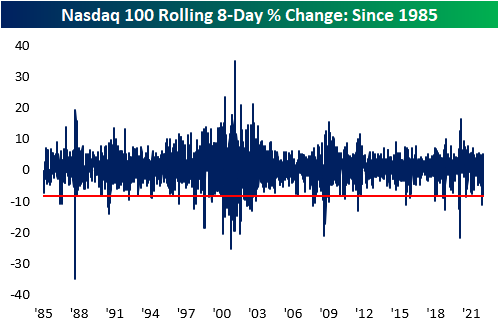
Nasdaq 100 Down Over 1% In Six of Eight Sessions
With volatility becoming an aspect of daily life for investors, the Nasdaq 100 has traded down by over one percent in six of the eight last sessions, resulting in a total drawdown of 8.4% during that span. Although the index is in the green for today (at least for now), the pattern of continuous selling is notable. The last time there were six 1%+ declines in the span of eight trading days (with no other occurrences in the last month) was on January 25th of this year. As you can see from the chart below, a large percentage of the prior occurrences since the index was launched (1985) are clustered between the years 2000 and 2002 (8 occurrences). Overall, these events tend to occur during periods of drawdowns (2000 to 2002 was a long drawdown) but occasionally mark a bottom as the sellers become washed out.

Forward performance following these occurrences is generally mixed, but the period of time with the largest cluster of occurrences (2000 – 2002) also experienced consistent continued weakness. Overall, forward returns were greater than that of all periods for almost every period we looked at (apart from three months),. However, positivity rates are lower across the board compared to normal trading environments, apart from the next week. In 72.2% of occurrences, the market turned higher the following week, resulting in a median return that is eight times higher than the median of all periods.

As you can see from the chart below, we have experienced far worse 8-day drawdowns than the current period, but it is worth noting that this 8-day drawdown is in the 98th percentile of all periods since 1985.Click here to try out Bespoke’s premium research service.
Past performance is no guarantee of future results.
Chart of the Day: The Ides of March
Harder and Harder to Keep Up
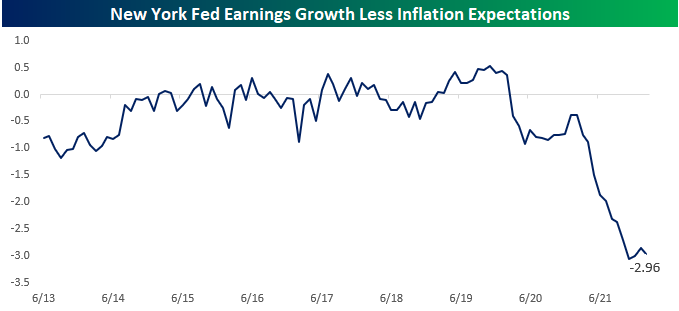
You don’t need us to tell you how confusing this market and economy have been. On Friday, the March preliminary read on sentiment from the University of Michigan showed lower levels of optimism than at the depths of the COVID crash. Despite the pessimism, though, on Monday, the New York Fed’s monthly Survey of Consumer Expectations showed that wage growth expectations for the next year broke out to 3.04% which is the highest level in the history of the survey.

If consumers are expecting wages to grow at the fastest pace in at least a year, why are they so negative? Doesn’t seem to make sense, does it? The reason for the disconnect can be summed up in one word. Inflation. In that same monthly survey of consumer expectations from the NY Fed, inflation expectations for the next year came in at a record high of 6.0%.

You don’t need a calculator or a chart to figure out that earnings growth of 3% isn’t enough to offset the impact of 6% inflation, but we’ll show you anyway. Below, we show the spread between the monthly readings of year ahead wage growth expectations versus inflation expectations. From the start of the New York Fed’s consumer survey in 2013 right up to before COVID, the spread between the two oscillated in a band of -1.25 to +0.5 percentage points. Once the initial phases of the COVID lockdowns passed and the economy started to reopen, though, all hell broke loose. For the last year, inflation expectations have been rising much faster than earnings growth expectations, resulting in the widest gap in the history of the survey. American consumers have found it hard enough over the years to climb the income ladder in normal times, but with inflation surging over the last year, even moderate levels of wage growth haven’t been enough for consumers to no longer feel as though they’re running up the down escalator. Click here to try out Bespoke’s premium research service.
Bespoke’s Morning Lineup – 3/15/22 – Round Trip
See what’s driving market performance around the world in today’s Morning Lineup. Bespoke’s Morning Lineup is the best way to start your trading day. Read it now by starting a two-week trial to Bespoke Premium. CLICK HERE to learn more and start your trial.
“In times of rapid change, experience could be your worst enemy.” – J. Paul Getty
Equity prices are recovering off early lows as commodity prices, especially oil, plummet. The cause of the decline could be attributed to either concern over weaker demand as the latest COVID wave washes ashore in China, or optimism over the war in Ukraine and the potential for a ceasefire. Those are two very different catalysts and would both have very different implications for the market and global economy as well.
In economic data, February PPI was just released and it came in weaker than expected at both the headline and core levels. Core PPI came in at just 0.2% which was tied for the lowest reading since the end of 2020. While inflation data was weaker than expected, Empire Manufacturing was a disappointment falling 11.8 versus expectations for a level of 6.8. That March reading for Empire Manufacturing was the weakest since May 2020.
Read today’s Morning Lineup for a recap of all the major market news and events from around the world, including the latest US and international COVID trends.
What a month it has been for crude oil. After finishing off February at a level of $95.72, WTI rallied nearly 30% on a closing basis and over 35% on an intraday basis in the span of just over a week. After hitting that multi-year high just a week ago, crude oil has practically round-tripped its entire early March gain, falling more than 22%. If these levels hold through the end of the day, it would rank as the largest decline from a 52-week high in the span of a week or less for WTI on record! Now, if prices at the pump would only reverse that quickly.

Start a two-week trial to Bespoke Premium to read today’s full Morning Lineup.
The Closer – Bonds and Stocks at the Lows, Recession Signals, China COVID, EM – 3/14/22
Log-in here if you’re a member with access to the Closer.
Looking for deeper insight into markets? In tonight’s Closer sent to Bespoke Institutional clients, we start out tonight by taking a look at prior instances of both stocks and bonds hitting six months lows, followed by a look into recession odds based on the recent action in equity and credit markets. We then take a look into the effects of China’s COVID-zero policy, and finish with an analysis on emerging markets.
See today’s post-market Closer and everything else Bespoke publishes by starting a 14-day trial to Bespoke Institutional today!
Chart of the Day – S&P 500 ‘death’ Cross
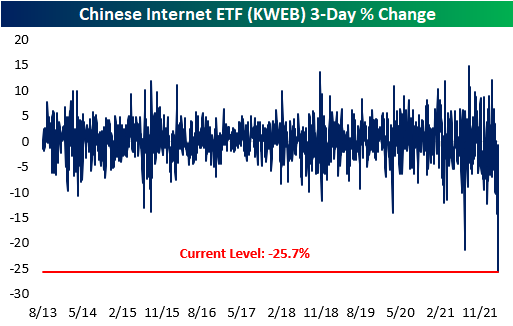
Record Decline in Chinese Internet Stocks
As we mentioned in our Morning Lineup today, Chinese equities have been hurt over the last few trading sessions due to a few reasons. First of all, Omicron is just now penetrating the country, and their COVID-zero policy has resulted in the temporary shutdown of ports, lockdowns in cities, and highly restrictive rules for businesses. In addition, US and Chinese regulators alike have been vocalizing the risk for the delisting of many Chinese equities on US exchanges due to concerns over audit standards. To top all of this off, the international community is uncertain regarding whose side of the Ukrainian conflict China stands, and Russia allegedly asked the Chinese for military equipment over the weekend. If China were to oblige to Russia’s request, it would only further escalate the icy relationship between the US and China.
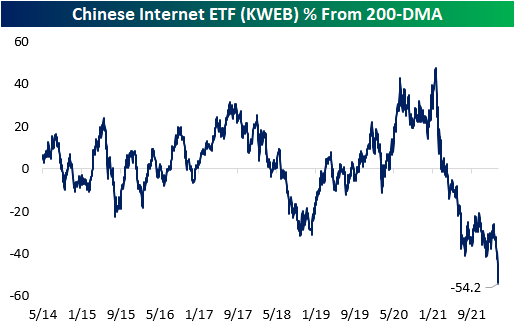
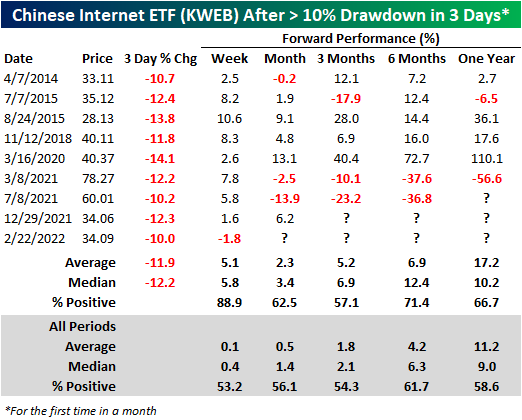
Over the last three trading sessions, the KraneShares Chinese Internet ETF (KWEB) has lost 25.7% of its value, the largest three-day decline in the history of the ETF. To put this into perspective, the worst three-day drawdown for KWEB during the COVID crash was ‘only’ 14.1%. After bottoming during the beginning of the pandemic, the ETF performed strongly until February of 2021, gaining 152.2% from trough to peak. Since then, the ETF has shed 78.4% of its value and is currently trading more than 50% below the COVID bottom.

There’s no questioning that this has been a painful trade for anyone invested in this ETF or the securities it holds. The decline has been consistent, but the ETF is currently the furthest below its 200-DMA it has been since it was launched in 2013. Just to get back to the current level of the 200-DMA, KWEB would need to more than double from here.
So, is this a buying opportunity? Historically speaking, when KWEB trades down 10% or more in three trading days (with no prior occurrences in the last month), the median forward performance has been greater than the median of all periods through every time period that we looked at. However, the current period is ripe with unique geopolitical headwinds, so finding fair comparable periods can be a daunting task. Chinese equities have been selling off consistently for quite some time now, but February 22nd was the first time KWEB saw a 10% three-day drawdown since December 29th, 2021. Notably, this occurrence is the only time in which the ETF traded down in the following week. Click here to try out Bespoke’s premium research service.
AAPL Streaks Above 200 DMA
Shares of Apple (AAPL) have come perilously close to breaking below the 200-day moving average (DMA) – a level it hasn’t closed below in 195 trading days (6/3/21). The chart below doesn’t include today’s trading so far, but as we type this now, the stock is trading below its 200-DMA of $153.27.

In the post iPod era (October 2001), the current streak ranks as the 8th longest of consecutive closes above the 200-DMA. Ironically, the current streak just moved into 8th place last week after it eclipsed the 193 trading day streak that ended two years ago yesterday at 193 trading days. The chart below shows historical streaks where AAPL traded above its 200-DMA since the launch of the iPod. Again, while 195 trading days may sound long, the current streak ranks nowhere close in length to the three-year streak that ended in May 2008, and the two-plus year streak that ended in 2011.

So how has AAPL stock performed after prior extended streaks of closes above its 200-DMA came to an end? The table below lists each of the prior nine times that AAPL first closed below its 200-DMA and shows how the stock performed going forward. For each period, we show AAPL’s performance in the six months leading up to the end of the streak, and then how the stock performed over the following week, month, three months, six months, and one year.
Of the prior streaks shown, AAPL’s median performance in the last six months of the prior streaks was a gain of over 11% with only one period of negative returns. With a gain of 2.7% over the last six months, if AAPL closes below its 200-DMA in the near future, its performance during this period will rank as the second weakest of the streaks shown. Once AAPL ends the streak, its short-term performance was weak with median declines of 5.0% and 0.2% over the next week and month, respectively. In each case, the stock was also down more than half of the time. For a stock like AAPL which has performed incredibly well over the last 20 years, these short-term returns are well below the historical average of 0.8% and 3.0%, respectively.
Although short-term returns for AAPL after breaking below its 200-DMA were weak, over the following three months, the stock generally got back on track with a median gain of 17.1% and gains more than three-quarters of the time. That compares to a median gain of 9.3% for all periods since October 2001. Six-month returns were also slightly better than average on a median basis (19.5% vs 18.5%) although the consistency of positive returns was lower. Finally, looking out over the next year, shares of AAPL experienced a median gain of 24.0% with positive returns just over 60% of the time. While 24% is nothing to sneeze at, it’s actually weak when you consider the fact that AAPL’s median one-year return for all periods since 2001 has been a gain of over 40%. As the individual periods indicate, AAPL’s performance following prior breaks of the 200-DMA has varied widely, but in aggregate, the stock has tended to underperform its historical average in the short term but then show some improvement over the following three to six months. Click here to try out Bespoke’s premium research service.

As always, investors should use any names listed as a starting point for further research. None of the information in this report or any opinions expressed constitutes a solicitation of the purchase or sale of any securities or commodities. This is not personalized advice. Investors should do their own research and/or work with an investment professional when making portfolio decisions. Past performance of any investment is not a guarantee of future results. Bespoke representatives or clients may have positions in securities discussed or mentioned in its published content.
The Dow Curse
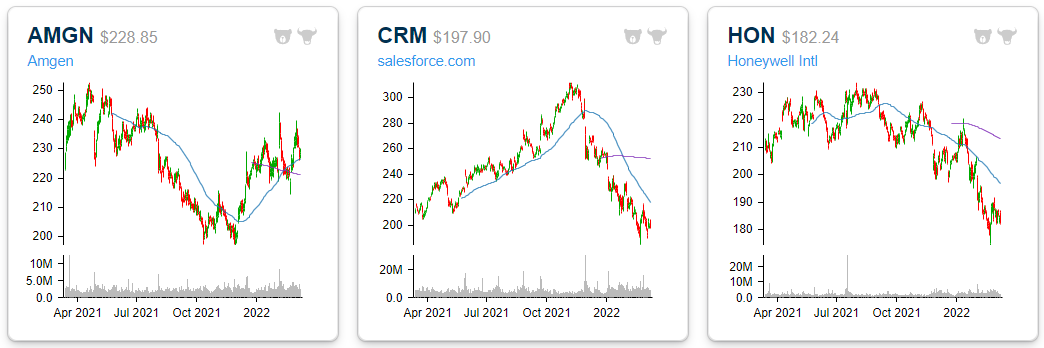
At the end of August 2020, the price-weighted Dow Jones Industrial Average changed up 10% of its index members by replacing Pfizer (PFE), Raytheon (RTX), and Exxon Mobil (XOM) with Amgen (AMGN), salesforce.com (CRM), and Honeywell (HON). Below are one-year price charts of the three stocks added to the Dow. AMGN has bounced back a bit over the last six months, but it’s roughly flat YoY. CRM was up significantly at its highs last November, but it’s currently in a 36% drawdown now. Finally, HON has been in a downtrend since last summer.
The three stocks removed from the Dow in August 2020 look completely different from the three stocks that were added. All three are in uptrends at a time when the broad market is in correction mode and trending lower.

Stocks usually get removed from indices because of poor performance and/or shifting economic trends. Conversely, stocks that get added to indices have usually performed well leading up to inclusion.
It has been 386 trading days since the last Dow changes were made at the end of August 2020. Below we show how the stocks added and removed performed in the 386 trading days leading up to the index change. CRM, AMGN, HON — gained 38% leading up to inclusion in the Dow, with a big final jump between the time the changes were announced and when they went into effect. RTX, PFE, XOM — the three stocks removed – were down an average of 25.7% over the same time frame.
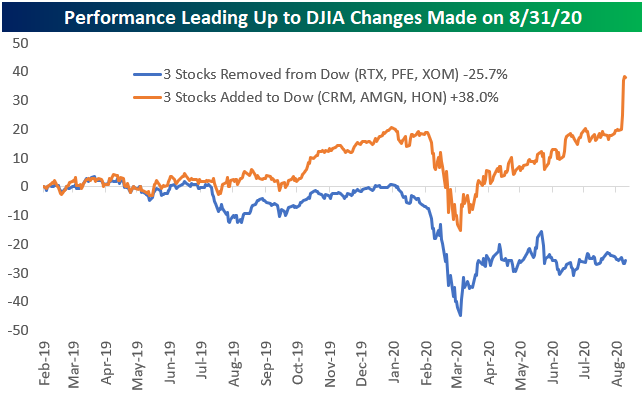
Below we show how the three Dow additions and removals have performed since the index changes occurred on 8/31/20. The three stocks added to the Dow have acted as a drag on the index with an average decline of 9.5% since inclusion. On the other hand, the three stocks removed from the Dow have gone bonkers, gaining 68.1%. Click here to try out Bespoke’s premium research product. Be sure to also check out Bespoke Crypto as well.
