Bespoke Brunch Reads: 3/8/20
Welcome to Bespoke Brunch Reads — a linkfest of the favorite things we read over the past week. The links are mostly market related, but there are some other interesting subjects covered as well. We hope you enjoy the food for thought as a supplement to the research we provide you during the week.
While you’re here, join Bespoke Premium for 3 months for just $95 with our 2020 Annual Outlook special offer.
Tech Wreck
Before Clearview Became a Police Tool, It Was a Secret Plaything of the Rich by Kashmir Hill (NYT)
The facial recognition application has driven concerns that law enforcement may misuse technology, but a bigger concern may be some of its most elite non-police customers. [Link; soft paywall]
Twitter is about to become an even bigger weapon of disinformation by Mark Wilson (Fast Company)
The social networking site is testing a feature that brings ephemerality to microblogging, echoing the sort of disappearing posts common to Snapchat or Instagram’s Stories. [Link]
Ebola
Democratic Republic of the Congo discharges last Ebola patient after 14 days without confirmed cases by Morgan Winsor (ABC)
While the Covid-19 pandemic is gripping attention, it would be easy to overlook the amazing news that the Democratic Republic of the Congo appears to have completely eliminated Ebola, with the last confirmed case discharged from hospital this week. [Link; auto-playing video]
Covid-19 Contingencies
I Lived Through SARS and Reported on Ebola. These Are the Questions We Should Be Asking About Coronavirus. by Caroline Chen (ProPublica)
A long Q&A about best practices and interpretation of data and advisories related to Covid-19, with detailed background and explanation. [Link]
Washington State risks seeing explosion in coronavirus cases without dramatic action, new analysis says by Helen Branswell (Stat News)
An analysis of viral genomes suggests that Covid-19 has been circulating in Washington State since January, and that the recent uptick in cases is about to surge dramatically. [Link]
Community Ties
In a disaster that calls for isolation, your community will help you survive by Alissa Walker (Curbed)
Under quarantine or just disrupted by social distancing, infectious disease outbreaks force vulnerable people to rely on their communities to support them. [Link]
How Working-Class Life Is Killing Americans, in Charts by David Leonhardt and Stuart A. Thompson (NYT)
Nobel Prize winners Anne Case and Angus Deaton detail the “deaths of despair” that are destroying communities across the US. [Link; soft paywall]
Covid Tech
Tim Cook and Apple Bet Everything on China. Then Coronavirus Hit. by Tripp Mickle and Yoko Kubota (WSJ)
Apple’s production of the world’s most popular tech products is dangerously reliant on China, with the company’s facilities and the companies that support them hyper-concentrated in the country. [Link; paywall]
The Coronavirus Is Forcing Techies To Work From Home. Some May Never Go Back To The Office. by Alex Kantrowitz (BuzzFeed)
A long-discussed shift towards remote work among tech workers may get a permanent nudge courtesy of widespread office closures designed to prevent spread of the virus. [Link]
Virus Quarantines in China Spur Tencent, NetEase Gaming Surge by Kamaron Leach and Sydney Maki (Bloomberg)
Daily average user counts have surged as Chinese consumers stay home but look for something to do, driving huge outperformance for gaming stocks in recent weeks. [Link; soft paywall, auto-playing video]
Quixotic Quests
The Miracle of Moving a Piano in New York City by Sophie Haigney (NYT)
A sort of strange New York story that makes the city what it is: incredibly challenging but filled with a can-do attitude that refuses to quit. [Link; soft paywall]
Market Mayhem
Stressed stock market may need to retest its lows before finding its footing in the coronavirus crisis by Michael Santoli (CNBC)
Equities and interest rates of plunged in response to the coronavirus, but what next for a tape that can’t seem to find a consistent bottom amidst heavy volatility? [Link]
Read Bespoke’s most actionable market research by joining Bespoke Premium today! Get started here.
Have a great weekend!
The Closer: End of Week Charts — 3/6/20
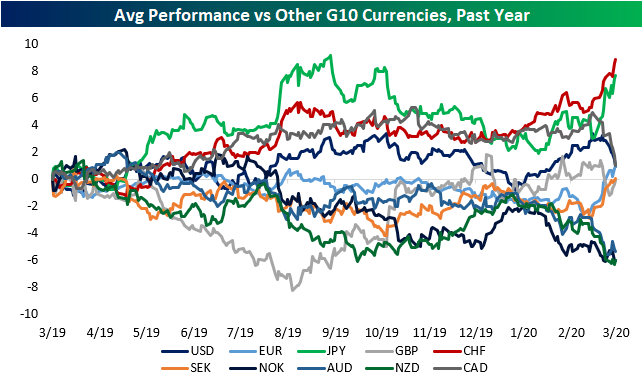
Looking for deeper insight on global markets and economics? In tonight’s Closer sent to Bespoke clients, we recap weekly price action in major asset classes, update economic surprise index data for major economies, chart the weekly Commitment of Traders report from the CFTC, and provide our normal nightly update on ETF performance, volume and price movers, and the Bespoke Market Timing Model. We also take a look at the trend in various developed market FX markets.
The Closer is one of our most popular reports, and you can sign up for a free trial below to see it!
See tonight’s Closer by starting a two-week free trial to Bespoke Institutional now!
It Doesn’t Get Much Worse Than This For Crude Oil
Crude oil prices are down close to 10% today in what is shaping up to be the worst day for crude oil since late 2014. That’s more than five years.

Today’s decline is pretty much a continuation of what has been a one-way trade for the commodity ever since the US drone strike on Iranian general Soleimani. The last time prices were this low was around Christmas 2018.

With today’s decline, crude oil is now off to its worst start to a year in a generation falling 32%. Since 1984, the only other year that was worse was 1986 when the year started out with a decline of 50% through March 6th. If you’re looking for a bright spot, in 1986, prices rose 36% over the remainder of the year. The only other year where crude oil kicked off the year with a 30% decline was in 1991 after the first Iraq war. Over the remainder of that year, prices rose a more modest 5%. Start a two-week free trial to Bespoke Institutional to access all of our research an interactive research tools.

A “Run of the Mill” Drawdown
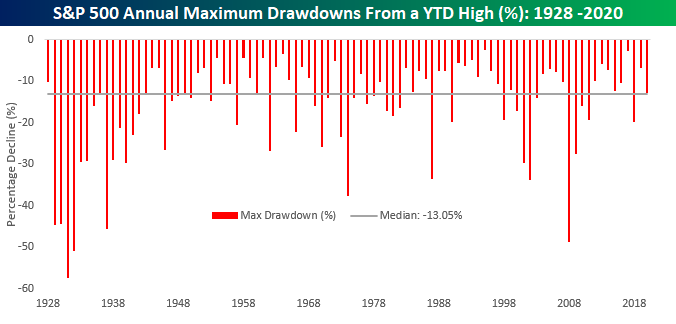
If you’re like us, you’ve heard a lot of people reference the recent equity declines as a sign that the market is pricing in some sort of Armageddon in the US economy. While comments like that make for great soundbites, a little perspective is in order. Since the S&P 500’s high on February 19th, the S&P 500 is down 12.8%. In the chart below, we show the S&P 500’s annual maximum drawdown by year going back to 1928. In the entire history of the index, the median maximum drawdown from a YTD high is 13.05%. In other words, this year’s decline is actually less than normal. Perhaps due to the fact that we have only seen one larger-than-average drawdown in the last eight years is why this one feels so bad.
The fact that the current decline has only been inline with the historical norm raises a number of questions. For example, if the market has already priced in the worst-case scenario, going out and adding some equity exposure would be a no brainer. However, if we’re only in the midst of a ‘normal’ drawdown in the equity market as the coronavirus outbreak threatens to put the economy into a recession, one could argue that things for the stock market could get worse before they get better, especially when we know that the market can be prone to over-reaction in both directions. The fact is that nobody knows right now how this entire outbreak will play out. If it really is a black swan, the market definitely has further to fall and now would present a great opportunity to sell more equities. However, if it proves to be temporary and after a quarter or two resolves itself and the economy gets back on the path it was on at the start of the year, then the magnitude of the current decline is probably appropriate. As they say, that’s what makes a market! Start a two-week free trial to Bespoke Institutional to access all of our research an interactive research tools.
Long-Term Treasuries Go Haywire
Take a good luck at today’s moves in long-term US Treasury yields, because chances are you won’t see moves of this magnitude again soon. Let’s start with the yield on the 30-year US Treasury. Today’s decline of 29 basis points in the yield will go down as the largest one-day decline in the yield on the 30-year since 2009. For some perspective, there have only been 25 other days since 1977 where the yield saw a larger one day decline.
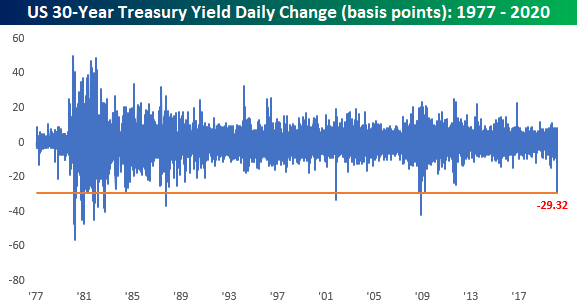
That doesn’t even tell the whole story, though. As shown in the chart below, every other time the yield saw a sharper one-day decline, the actual yield of the 30-year was much higher, and in most other cases it was much, much higher.

To show this another way, the percentage change in the yield on the 30-year has never been seen before, and it’s not even close. Now, before the chart crime police come calling, we realize showing a percentage change of a percentage is not the most accurate representation, but we wanted to show this for illustrative purposes only.
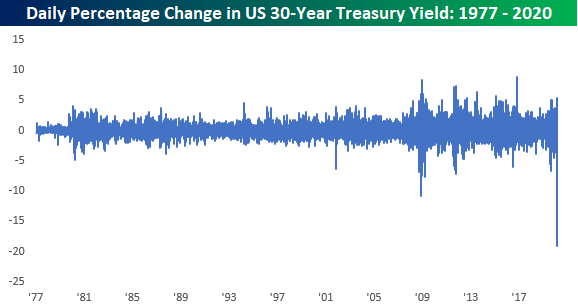
Finally, with long-term interest rates plummetting we wanted to provide an update on the performance of the Austrian 100-year bond. That’s now back at record highs, begging the question, why is the US not flooding the market with long-term debt? Start a two-week free trial to Bespoke Institutional for full access to our research and interactive tools.

Bespoke’s Morning Lineup – 3/6/20 – Corona Friday
See what’s driving market performance around the world in today’s Morning Lineup. Bespoke’s Morning Lineup is the best way to start your trading day. Read it now by starting a two-week free trial to Bespoke Premium. CLICK HERE to learn more and start your free trial.
With headlines likely to get worse before they get any better, investors are once again in no mood to buy equities heading into a weekend. Equity futures are down over 2% and getting worse as treasury yields sink like a stone. After breaking below 1% for the first time ever earlier this week, the yield on the 10-year is now at 0.72%.
Today’s Non-Farm Payrolls report for February came in extremely strong with headline payrolls coming in at 273K versus expectations for a gain of 175K. Unfortunately, all of this data is from early February, so no one is likely going to care.
Read today’s Bespoke Morning Lineup for the latest stock-specific news of note, updates on the coronavirus, and a recap of economic data coming out of Europe.

The price chart of Europe’s STOXX 600 is really something to behold. Less than a month after hitting 52-week highs, the index is now knocking on the door of 52-week lows. It’s rare enough to see this type of a reversal in an individual stock, but for a benchmark equity index of an entire continent, it’s nuts. With a decline of over 3% today, the STOXX 600 is now less than 2% from hitting that level. As we discussed in the Morning Lineup, this is just a further illustration of how before the coronavirus breakout started, the global economy was starting to accelerate.

The Closer – Plunging Rates, Glittering Gold – 3/5/20
Log-in here if you’re a member with access to the Closer.
Looking for deeper insight on markets? In tonight’s Closer sent to Bespoke Institutional clients, we review the continued decline in small caps relative to the S&P 500 and outperformance of momentum stocks relative to value stocks. Next, we review the rapid changes in financial stress indices from the St. Louis Fed and Goldman Sachs. We also show the gold market’s reaction. Turning to economic data, we review today’s manufacturing data and Bloomberg Consumer Comfort.

See today’s post-market Closer and everything else Bespoke publishes by starting a 14-day free trial to Bespoke Institutional today!
Newsletter Writers Turning Bearish
In an earlier post, we detailed how AAII’s weekly sentiment survey has shown respondents have become increasingly polarized taking bullish and bearish stances. Another sentiment survey of newsletter writers from Investors Intelligence, on the other hand, leans more distinctively bearish. This survey’s reading on bullish sentiment fell to 41.7% in the latest week which is the lowest reading since January of last year. Granted, at that time bullish sentiment reached much lower levels bottoming at 29.9%.

Meanwhile, bearish sentiment is at its highest level since March of last year. Like bullish sentiment, while it is at one of its highest levels in some time, it also topped out at much higher levels just over a year ago. Bearish sentiment peaked at 34.6% in the first week of January of 2019, 14.2 percentage points higher than current levels.

While the Investors Intelligence survey does not have a reading on neutral sentiment like AAII does, it does survey respondents for those “looking for a correction”. With the S&P 500 having fallen 12.76% from the February 19th closing high to Friday’s closing low, price action has met the definition of a correction and as such the number of respondents reporting that they are looking for a correction has surged to 37.9%. That is the highest reading since June of last year when it reached 38.8% and in the 93rd percentile of the past decade’s readings. Overall, bearish sentiment has generally taken over now which is positive from a contrarian’s position, but as recently as the past year, there is a precedent of it being even higher. Start a two-week free trial to Bespoke Institutional to access our interactive economic indicators monitor and much more.

Investors Polarized
Despite continued volatility for equity markets over the past week, bullish sentiment has picked back up this week, rising to 38.74% from 30.43%. Last week’s reading marked the lowest level for AAII’s reading on bullish sentiment since October, but this week’s 8.31 percentage point jump brings it right back into the middle of the past few years’ range and within one percentage point of the historical average of 38.08%.

While bullish sentiment is not at any sort of high or low, bearish sentiment has risen to a nearly equal reading of 39.64% which is the highest level since October when it was several percentage points higher in the mid-40s. This leaves bearish sentiment fairly elevated with regards to its historical average of 30.35% but not quite to any extreme degree (over one standard deviation above that average).

The same cannot necessarily be said for neutral sentiment which has now fallen over one standard deviation below its historical average. Neutral sentiment cratered 8.81 percentage points this week down to 21.62%. That is the lowest level, the biggest one week decline, and the first time it has fallen one standard deviation below its historical average since late December of 2018. If the choppy price action over the past week wasn’t enough confirmation, this sentiment data points to investors being increasingly polarized along the bullish and bearish lines.

Looking at past times that sentiment became similarly polarized, the bulls have tended to be on the right side of history. The table below shows past times since the beginning of the AAII survey that neutral sentiment was one standard deviation or more below its historical average while bullish and bearish sentiment were within normal ranges. As depicted, this is the first time that this has occurred since November of 2012 when each sentiment reading was within just a few tenths of a percentage point of current levels. Again, the performance of the S&P 500 following these sentiment readings has had a positive bias. Other than one week later which sees performance more inline with other periods, the S&P 500 has typically outperformed and has consistently traded higher. Start a two-week free trial to Bespoke Institutional to access our interactive economic indicators monitor and much more.

Jobless Claims Unfazed By Covid-19
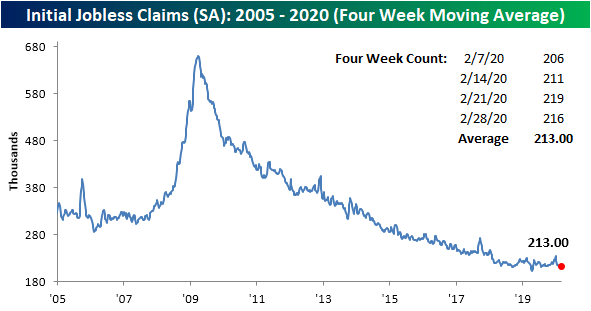
While schools are closing and events are being canceled as precautions to stem the spread of the coronavirus, initial jobless claims have yet to show any negative impact. Claims actually fell slightly this week down to 216K from 219K last week. That is about in line with expectations of a 215K print. Overall, claims still point to a healthy US labor market that has not seen any significant impacts from the coronavirus.

The recent multi-month low of 203K rolled off the four-week moving average this week, replaced by the higher 216K reading and caused the average to reach 213K. That is the highest level for the four week average since the week ending January 24th when it stood at 214.75K. That is also still well below the highs from late last year in the low 230K’s.
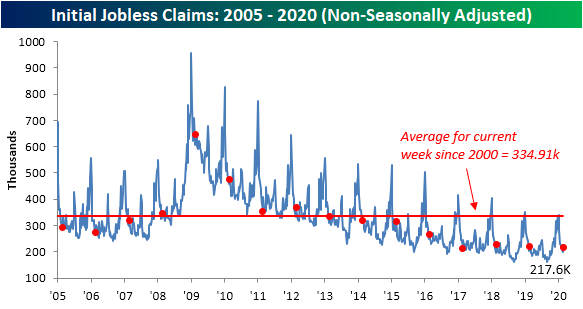
Non-seasonally adjusted (NSA) claims ticked higher by 18.3K this week to 217.6K. That leaves jobless claims slightly lower year-over-year and still far below the average for the current week of the year since 2000 as shown in the first chart below. Additionally, while the week to week fluctuations in the NSA number should not typically be given too much weight, we wanted to highlight that the week-over-week uptick in unadjusted claims was just about what could be expected for the current week of the year. As shown in the second chart below, the ninth week of the year has averaged an increase of 17.6K; similar to the actual change of 18.3K observed this week. In other words, before seasonal adjustment, this week’s increase likely has more to do with seasonality than any coronavirus effects.

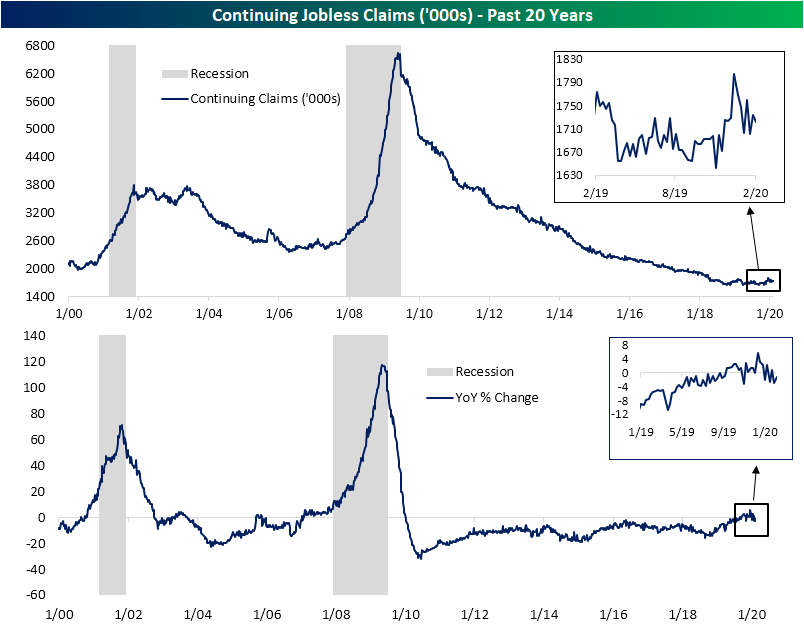
While less timely given they are released at a one week lag to initial claims, continuing claims are also not showing any signs of stress from the coronavirus. It is quite the opposite actually. After showing frequent year-over-year increases over the past few months for the first time of the current economic cycle, this week marked the first back-to-back YoY declines since early September. While two weeks do not make a trend, that is a welcome improvement after the past few months. Start a two-week free trial to Bespoke Institutional to access our interactive economic indicators monitor and much more.