Netflix (NFLX) Back to Outperforming
In an earlier post, we highlighted Netflix (NFLX) as one of the stocks benefiting from the COVID-19 economy. Yesterday, it managed to reach a new 52 week high and today was up nearly 5% at the intraday high. That brings the stock to a new all time high, surpassing the previous record closing high from July 9th, 2018. That is while the broader market, the S&P 500, is down well over 2% on the day. That type of outperformance has not necessarily been the norm over the past two years. As shown in the second chart below, while NFLX tended to outperform the rest of the market (a rising line indicates NFLX outperforming the S&P 500 and vice versa) in the first half of the past five years, after its July 2018 peak, that outperformance began to subside.

Another way of showing this is performance over the last two years. At the time of the S&P 500’s high on 2/19, the performance of NFLX and the S&P 500 since mid April of 2018 were basically dead even at 25.5% and 26.5% respectively. After both saw those gains erased, NFLX’s recent surge leaves it up nearly 40% over the past two years while the S&P 500 is only up 3.5%. Start a two-week free trial to Bespoke Institutional to access our full range of research and interactive tools.

Homebuilder Destruction
This morning, the NAHB updated their monthly reading on homebuilder sentiment, and like most other recent economic data, the results were not good. Homebuilder sentiment fell below 50 for the first time since June of 2014 (readings below 50 are considered contractionary). The index plummeted to its lowest reading since June of 2012 falling from 72 in March down to 30 in April.

As shown in the table below, that 42 point decline in just one month was the largest ever recorded in the data going back to 1985. The same can also be said for every one of the sub-indices as well which are now at multi-year lows. That stands in stark contrast to where things were just one month ago. In March, the headline index, as well as several other sub-indices, were in the 95th percentile or better of all readings. In other words, before the COVID-19 pandemic homebuilders’ outlook was historically optimistic.
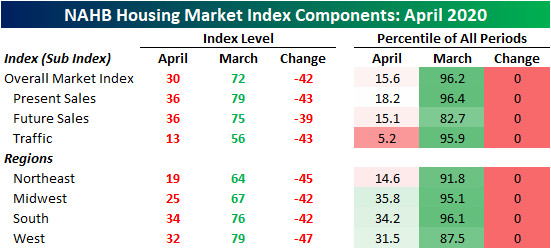
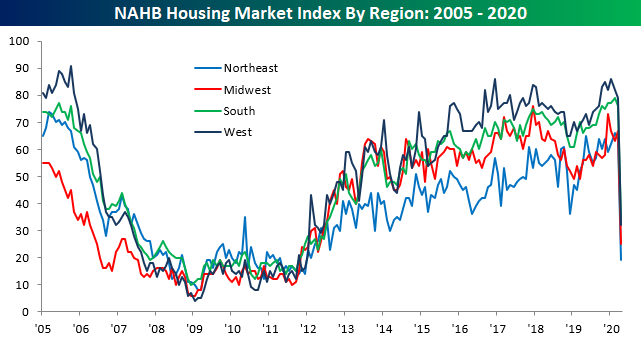
One interesting thing to note in this month’s survey was the declines in homebuilder sentiment were broad across geographic regions but the areas of the country most affected by the virus saw larger declines and are now at lower levels. Namely, sentiment in the Northeast is the lowest of the four regions at 19 compared to the next lowest, 25, in the Midwest. That is as the bulk of US COVID-19 cases can be found in the Northeast, particularly in the tri-state area. Start a two-week free trial to Bespoke Institutional to access our interactive economic indicators monitor and much more.
Crumbling Empire
Last month, the New York Fed’s monthly manufacturing index fell to its weakest level since March of 2009. Fast forward one month and the headline reading has collapsed even further and more dramatically for the US region hit hardest by COVID-19. The April reading was forecasted to come in at -35 which would have been the lowest level ever recorded. Instead, it surpassed that by more than two fold coming in at -78.2 and experiencing its largest monthly decline on record in the process. While a net of over three-quarters of the region’s businesses reported declining current conditions, the outlook picked up slightly from last month. Conditions six months out rose to 7 from 1.2 last month.

With expectations and current conditions heading in opposite directions and the index for current conditions reaching such an extreme low, the spread between the two is now at its highest level ever.

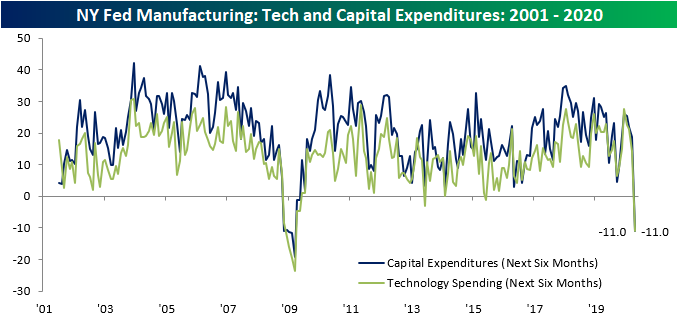
Given the massive decline in the headline number, many of the individual categories of the report were equally as bad. In addition to the headline number, New Orders, Shipments, Number of Employees, and Average Workweek all are at record lows and experienced their largest m/m declines on record. While there were no record lows for the categories on expectations, most of those same ones are around the 1st or 2nd percentile. Additionally, plans for Capital Expenditure and Technology Spending fell by their largest amounts ever.
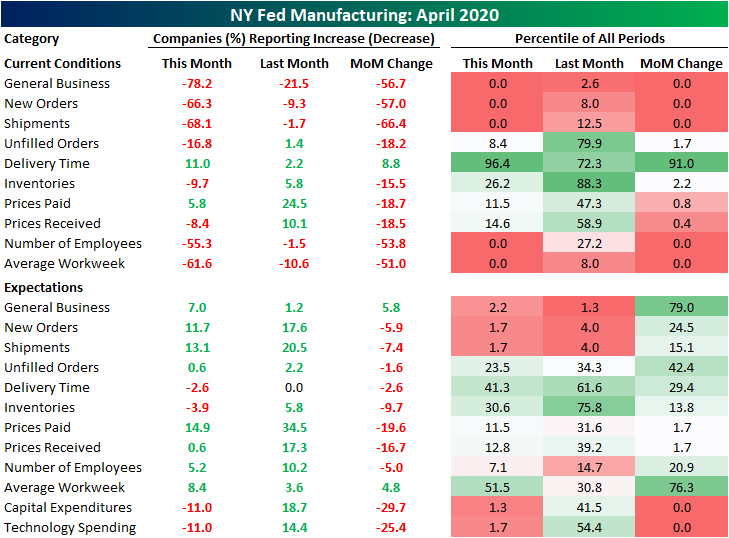
Demand has been in absolute free fall. The indices for both New Orders and Shipments have experienced record declines to record lows; surpassing even those from the last recession. More than half of responding businesses have reported that New Orders and Shipments are weaker. Businesses do not appear to see much light at the end of the tunnel yet either. While not at absolute lows, the readings for New Orders and Shipments six months out are both in the bottom 2nd percentile of all readings and at their lowest levels since the financial crisis.


With business grinding to a halt, it appears focus has shifted from investment to simply staying afloat and cutting costs as the indices for capital expenditure, technology spending, and all tanked. For the first time since June of 2013 for Technology Spending and May of 2009 for Capital Expenditures, the NY Fed indices have tipped negative. Both now stand at -11 indicating fewer companies are looking to expand on capital expenditures or technologies that would benefit operations.
Looking purely at recent jobless claims numbers, the employment side of this month’s Empire Fed report could not be expected to show much strength. This month’s report showed 58.6% of responding employers reporting smaller workforces while only 3.3% saw an increase in employees. Additionally, 64.7% of companies reported lower employee workweeks compared to 3.1% with longer workweeks. Those readings for Number of Employees and Average Workweeks at -55.3 and -61.6, respectively, are both record lows for current conditions. As for expectations six months out, employers do not appear overly optimistic either. Although the reading on average workweek rose to 8.4, which is in the middle of the past few years’ range, expectations for number of employees fell to 5.2 which is its lowest level since August of 2016. Start a two-week free trial to Bespoke Institutional to access our interactive economic indicators monitor and much more.

Handful of New 52-Week Highs
With the S&P 500’s rally off of the 3/23 low continuing yesterday, a handful of stocks in the index actually made new 52 week highs! Other than yesterday’s new highs, there are only 19 stocks in the index that have reached a 52 week high at some point since the beginning of March. Regeneron (REGN) was one of the few stocks that rallied in that time frame on hopes that the company would develop a treatment for COVID-19. Other than REGN, stocks in this group seem to be plays on the COVID economy including consumer staples retailers like Walmart (WMT) and Dollar General (DG) as well as plays on Americans staying at home like Netflix (NFLX) and Amazon (AMZN).
With that outperformance during the worst of the sell-off and solid gains since the March 23rd low, most of these stocks are currently mid to high single digits above their February 19th levels except for Regeneron (REGN) and Newmont (NEM) which are 30.94% and 29.72% above, respectively.

As shown in the table above, which can also be seen in the charts from our Chart Scanner below, the COVID collapse that lasted from February into March only resulted in Amazon (AMZN) reaching a 52-week low. AMZN’s 52 week low occurred on March 16th; one week before the rest of the market’s bottom. Every other stock of those that made a new 52-high yesterday saw its 52-week low at some point in 2019.
As shown below, several of these stocks reaching 52-week highs means that they have cleared some form of significant resistance. Dollar General (DG) and Netflix (NFLX), for example, unsuccessfully tested resistance multiple times within the past year before these most recent breakouts. As for trends, each one is currently in a rough uptrend over the past six months to a year putting aside some disruption from the volatility of the recent sell-off. Start a two-week free trial to Bespoke Institutional to access our Chart Scanner and much more.

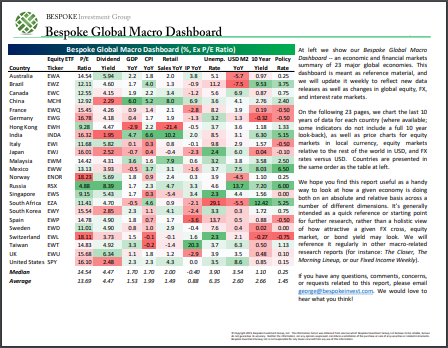
Bespoke’s Global Macro Dashboard — 4/15/20
Bespoke’s Global Macro Dashboard is a high-level summary of 22 major economies from around the world. For each country, we provide charts of local equity market prices, relative performance versus global equities, price to earnings ratios, dividend yields, economic growth, unemployment, retail sales and industrial production growth, inflation, money supply, spot FX performance versus the dollar, policy rate, and ten year local government bond yield interest rates. The report is intended as a tool for both reference and idea generation. It’s clients’ first stop for basic background info on how a given economy is performing, and what issues are driving the narrative for that economy. The dashboard helps you get up to speed on and keep track of the basics for the most important economies around the world, informing starting points for further research and risk management. It’s published weekly every Wednesday at the Bespoke Institutional membership level.
You can access our Global Macro Dashboard by starting a 14-day free trial to Bespoke Institutional now!
The Closer – Tech Rules As Markets Roar Higher Into Recession – 4/14/20
Log-in here if you’re a member with access to the Closer.
Looking for deeper insight on markets? In tonight’s Closer sent to Bespoke Institutional clients, we show how stocks are richly valued relative to next year’s earnings estimates. We then take a look at how forecasters are now certain of an imminent recession. We close out tonight by showing Tech’s strength in leading the market higher while grossly outperforming banks which are seeing an uptick in bad debt charges..

See today’s post-market Closer and everything else Bespoke publishes by starting a 14-day free trial to Bespoke Institutional today!
S&P 500 Sector Performance Numbers
Below is an updated look at the performance of the S&P 500 and its eleven sectors over various time periods. From the S&P 500’s last all time high on February 19th, no sector has been hit as hard as Energy. From those highs for the broader index, the sector had been more than cut in half by the time the S&P 500 found a bottom on March 23rd. In the time since then, Energy has been the best performing sector having risen 44.9%. Meanwhile, some of the best performing sectors over the past few years like Technology and Consumer Discretionary have performed essentially inline with the S&P during this rally. Despite Energy’s outperformance off the 3/23 lows, the sector is still down 36.3% since the S&P 500’s February 19th high and is down even more YTD. Over the past year, two year, and three year period, Energy has also been roughly cut in half.
After the huge rally we’ve seen since March 23rd, there are now four sectors that are back up on a year-over-year basis — Utilities, Health Care, Technology, and Consumer Staples. On a two-year basis, seven of eleven sectors are now back in the green, while only three sectors are now down on a three-year basis (Energy, Industrials, and Communication Services).
The S&P 500 as a whole is now down just 2.53% year-over-year, while it’s up 6.6% over the last two years and up 21.6% over the last three years.
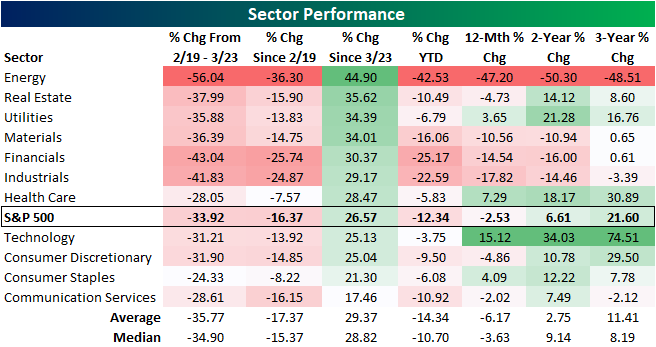
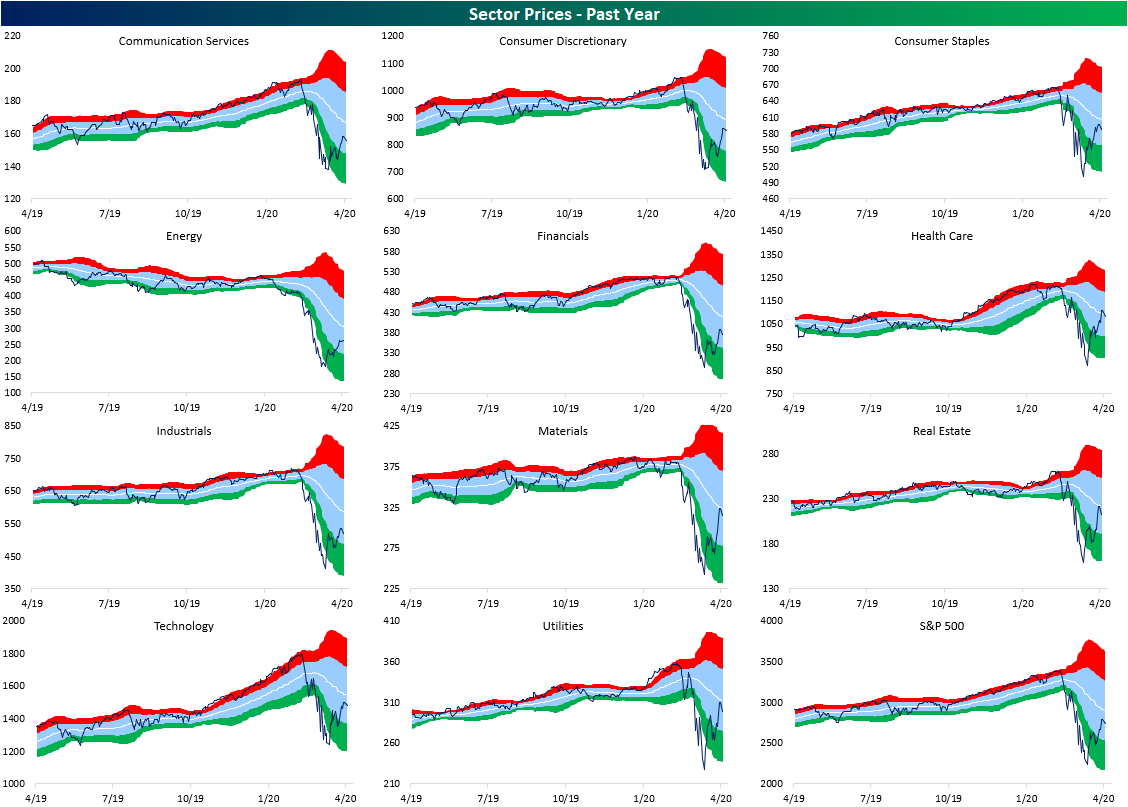
The Covid crash brought most sectors to some form of a multi-year low. But with the significant bounce since 3/23 across sectors, a significant mean reversion has taken place and several sectors are now sitting more in the middle of the past few year’s range as shown in the charts below. Meanwhile, others like Energy, Financials, Industrials, and Materials remain at the lower end of those ranges.
Even on a shorter time frame equities are simply in the middle of their ranges. Last week, the Health Care sector finally crossed back above its 50-DMA; the first sector to do so since the Utilities sector in the first week of March. Today, the Consumer Discretionary, Consumer Staples, Health Care, Materials, and Technology sectors have all done the same but are still within 1% of their 50-DMAs except for Health Care which is 2.5% above.
The S&P 500, Communication Services, Real Estate, and Utilities are only around 2.5 or fewer percentage points away from their 50-DMAs. But for Financials and Industrials, they are still over 8% away. Energy still has the furthest to go currently 13.5% below its 50-DMA. Start a two-week free trial to Bespoke Institutional to access our Sector Snapshot and much more.

The Closer – Statecrafting, Retracing Prices, Credit Premiums – 4/13/20
Log-in here if you’re a member with access to the Closer.
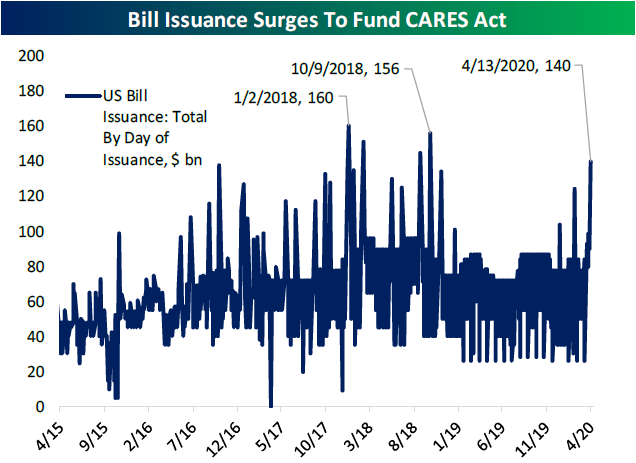
Looking for deeper insight on markets? In tonight’s Closer sent to Bespoke Institutional clients, we begin with the news that several states are beginning to strategize on how to reopen their economies. Next, we turn to several technical developments across the equities space before taking a look at today’s $140 billion of bill issuance. We finish with a look at the massive premiums in the high yield ETF space.
See today’s post-market Closer and everything else Bespoke publishes by starting a 14-day free trial to Bespoke Institutional today!
Earnings on Deck
Although there is only one company reporting earnings today, the earnings calendar ramps up this week with a total of 75 other reports through Friday. This upcoming earnings season will be closely watched for how individual companies have been impacted by the COVID-19 pandemic. As shown in the charts from our Earnings Explorer below, although some of the period pre-dates the outbreak and recently the number of companies reporting have been low, 3-month rolling beat rates over the past few months have generally remained positive and above their historical averages. On the other hand, more companies have been lowering than raising guidance. In fact, the guidance spread has been gradually approaching its lowest levels since early 2019.
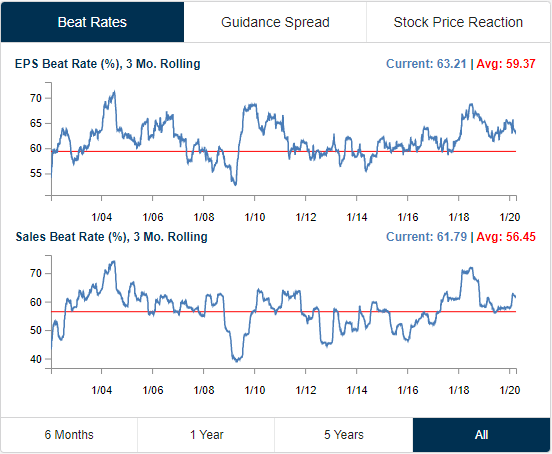
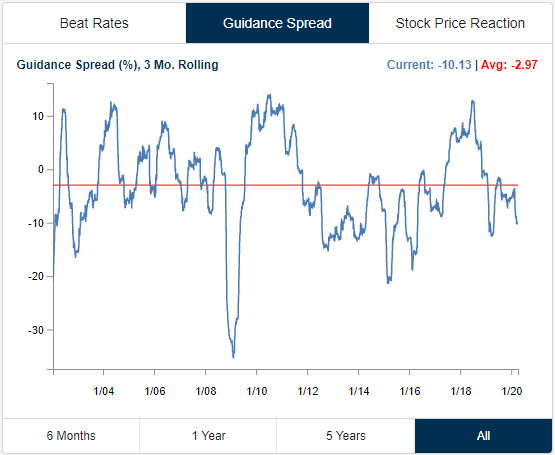
In terms of stock price reactions, companies have been getting crushed on their earnings reaction days (first trading session after their report). In March, the rolling 3 month 1 day median percent change hit its lowest level since 2012. Granted, part of the reason for that is the sharp declines in February and March regardless of whether or not a company had reported.

In the table below, we show the 30 largest (by market cap) companies scheduled to report earnings through the end of the month. For each stock, we also show their EPS and revenue beat rates, the percentage of time they raise guidance, and then their average one-day performance in reaction to earnings and historical volatility. For volatility, we are simply measuring the average percentage move (up or down) on the day of each earnings report. Johnson and Johnson (JNJ) and Lockheed Martin (LMT) have the strongest EPS beat rates of these companies and Facebook (FB) has topped sales estimates the most consistently. Conversely, Wells Fargo (WFC) has missed EPS the most and NextEra Energy (NEE) has missed sales estimates the most. In terms of stock price reaction, the FANG names—Facebook (FB), Amazon (AMZN), Netflix (NFLX), and Google (GOOG)—have tended to be the most volatile on earnings with NFLX being the most volatile of these averaging a full-day move of 12.5%. While it has been the most volatile, NFLX has not averaged the best performance on earnings. FB holds that title with an average earnings reaction day gain of 2.7%. Bank of America (BAC) on the other hand has averaged the worst performance with a decline of -0.93%. Start a two-week free trial to Bespoke Institutional to access our interactive Earnings Explorer and much more.

Sectors Failing at their 50-Day
In last week’s Sector Snapshot, we noted that each of the eleven sectors as well as the S&P 500 had finally exited oversold territory as shown in the charts below. Even with the major indices down around 2% today, they have held up in neutral territory so far. One interesting thing to note of today’s decline is some sectors are turning lower right as they come within reach of their 50-DMAs.
Over the course of this recent market downturn, Health Care has been the only sector to recently close above its 50-DMA which happened last Wednesday and Thursday. Before that, you would have to go all the way back to March 5th to find a sector above its 50-DMA (Utilities). While Health Care pressed above this average last week, it has failed to hold there with today’s declines bringing it 0.79% below its 50-DMA. Health Care is not alone in failing at its 50-DMA though. Despite having never taken out these levels, the Materials and Real Estate sectors both came within 1% of their averages as of Friday’s close before turning lower today. While they did not get as close, Consumer Staples and Utilities have also failed to press higher after closing within 2% of their 50-DMAs on Friday. That gives evidence that the 50-DMA could be the next technical roadblock for the other sectors as well as the broader S&P 500. Start a two-week free trial to Bespoke Institutional to access our Sector Snapshot and much more.
