The Closer – Europe Rejections, Construction Cruising, Manufacturing Divergence – 10/17/19
Log-in here if you’re a member with access to the Closer.
Looking for deeper insight on markets? In tonight’s Closer sent to Bespoke Institutional clients, beginning with a technical note, we show the resistance European markets have run into and the breakdown in the dollar. Moving onto economic data, we show the pause in September home construction data. We then provide an update to our Five Fed Manufacturing Composite, including the massive divergence between the Empire and Philly Fed’s indices with ISM. We finish with a look at today’s EIA data.

See today’s post-market Closer and everything else Bespoke publishes by starting a 14-day free trial to Bespoke Institutional today!
Rangebound on Both Sides of the Atlantic
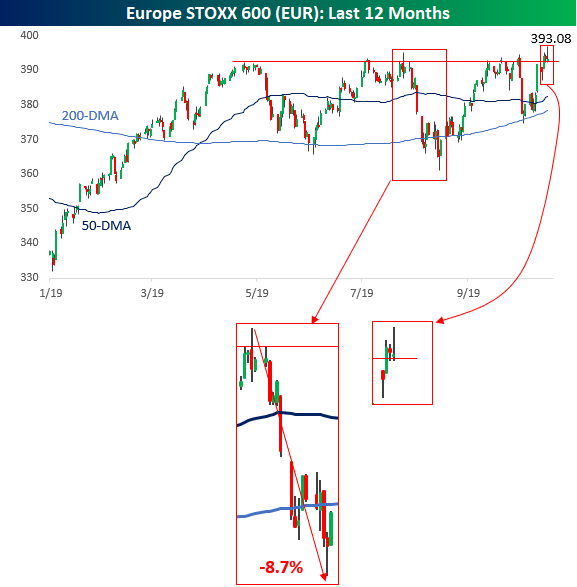
Everyone here is well aware of the fact that equities have been stuck in what seems like an endless trading range where the S&P 500 has failed to break out meaningfully to new highs. What some investors may not be of cognizant of is the fact that over in Europe, the benchmark STOXX 600 has also been stuck in a trading range of its own. While the index peaked at higher levels in 2015, it subsequently fell over 25% during the global sell-off in late 2015/early 2016. From those lows, the STOXX rallied more than 30% for the next 15 months. Since May 2017, though, the index has been stuck in a range and unable to meaningfully break out to new highs.
This year’s performance for the STOXX 600 has been a continuation of the holding pattern that the index has been stuck in since 2017. Earlier today, it looked as though we were getting close to a breakout as the index hit a 52-week high, but late in the European session equities sold-off nearly 1% from the intraday highs finishing near the lows of the day. Oh well. Maybe tomorrow.
What bulls in Europe are hoping is that today’s late-day sell-off isn’t a repeat of what happened on July 25th. Back then, we saw a similar-looking breakout, but like today, the gains didn’t hold and the STOXX 600 reversed over 1% and finished near the lows of the day. From the high on the day of that failed breakout in late July to the August lows, the STOXX 600 went on to fall nearly 9%. Start a two-week free trial to Bespoke Institutional to access our actionable research and interactive investment tools.
Positive Sentiment Surge
With the S&P 500 fighting to retake the 3000 level this week, bullish sentiment has rebounded after dropping to the lowest level since May of 2016 last week. AAII’s percentage of bullish investors rose from 20.31% last week to 33.62%. This brings the sentiment level back within its normal range of the past few years although it is still below the historical average of 38.08%.

This 13.31 percentage point increase was the largest since July 12th of last year when bullish sentiment rose 15.2 percentage points. This week was also the only time since then (66 weeks) that bullish sentiment has even risen by double digits in a single week. While there is plenty of precedence for weeks where bullish sentiment jumped 10 percentage points or more (163 past occurrences since the beginning of the survey in 1987), there has been only one other time that it happened without having done so for at least one year. That was in March of 2013 when bullish sentiment rose 14.36 percentage points, snapping a 116 week-long streak.
Granted it’s just one week, but the S&P 500 performance following that period was generally positive. The next week saw a decline of over 1%, but over the next month, 3 months, 6 months, and year the S&P 500 saw stronger than average returns. On the contrary, average S&P 500 performance following all 163 weeks with increases of 10 percentage points or more has not been as strong as it has actually led to underperformance for all time periods other than one week later.

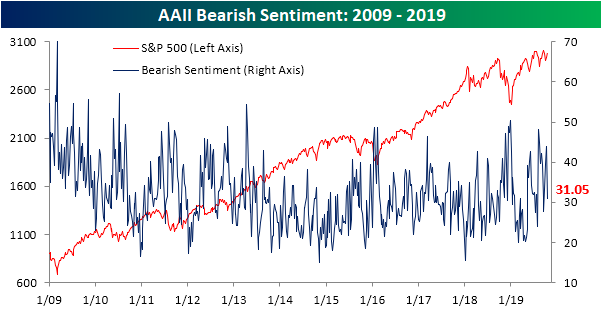
Given the sharp rise in bullish sentiment, bearish sentiment took a nosedive falling to 31.05% from 43.96% last week. While still slightly above the historical average, this drop brought it back down to Earth from its elevated levels. As with bullish sentiment, these sorts of large moves in a single week have not been a common occurrence; perhaps even more so for bearish sentiment. Since the beginning of the survey, there have been 141 weeks including the current week, or 8% of all weeks, where bearish sentiment has seen a double-digit percentage drop. This week’s 12.91 percentage point decline was the largest decline since the 13.4 percentage point move in the second week of this year in the wake of the 2018 sell-off. So unlike bullish sentiment, it has not been quite as long since we last have seen a similar decline but overall there have been fewer weeks with such a decline.
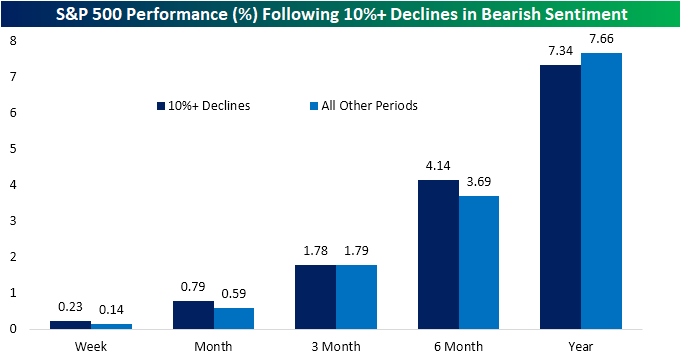
In terms of the S&P 500’s performance following similar declines, the average performance in the following months has been much more in line with the average for all other periods. There has been slight outperformance in the week, month, and 6-month time frames, but slight underperformance 3 months and one year later as shown in the chart below.
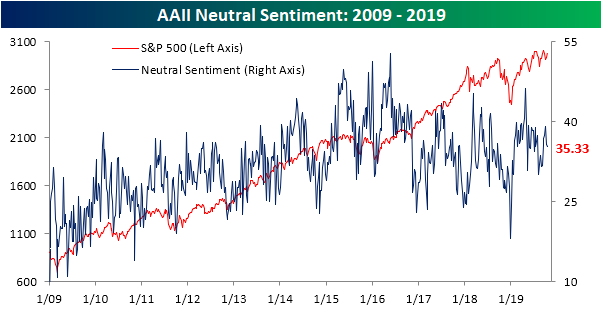
While most of the gain in bullish sentiment came from bears, a small portion also came from those formerly reporting as neutral. The reading on neutral sentiment fell 0.4 percentage points to 35.33% this week. Neutral sentiment is now off of its high from the start of October, but it also remains above its historical average of 31.54%. Start a two-week free trial to Bespoke Institutional to access our interactive economic indicators monitor and much more.
S&P 500 Sector Valuations
The S&P 500’s trailing 12-month P/E ratio has ticked up to 19.62 recently, which is close to its highest level of the past year. For valuations to stop expanding on any breakout higher for the S&P, we’ll need to see earnings (the “E” in P/E) keep up with price. That’s going to be a tough ask for corporate America this quarter, so we may be heading into 2020 with valuations at more concerning levels.
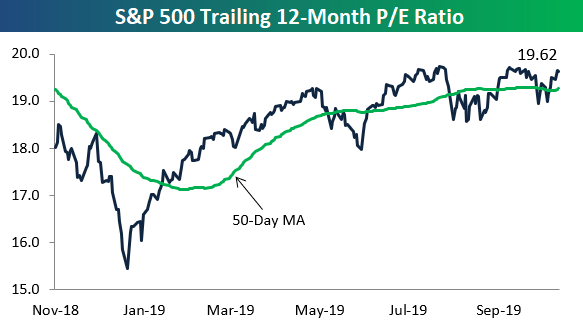
Below are one-year charts of P/E ratios for ten S&P 500 sectors. These charts are included in our weekly Sector Snapshot report sent to Bespoke Premium members. Consumer Discretionary has the highest P/E ratio at 24.15 followed by Technology at 23.38. Tech’s P/E has really jumped a lot recently to new 52-week highs. The Financial sector has the lowest P/E of the major sectors at just 13.27. Start a two-week free trial to Bespoke Premium to sample our actionable research. If you use this checkout link, you’ll receive a 10% discount on an annual membership if you stick with it past your trial period.


Initial Jobless Claims Slightly Higher
After falling to 210,000 last week, initial jobless claims were forecast to see an increase to 215K. Instead, claims rose less than expected only rising to 214K. Jobless claims also remain flat over the past year as this week’s reading was only 1K lower than the same week last year. Regardless of the sideways range, jobless claims remain at very healthy levels having been at or below 300K for a record 241 weeks and at or below 250K for a record 106 weeks.

With this week’s increase in the seasonally adjusted data, the four-week moving average has ticked slightly higher. This was a result of a lower reading of 210K from mid-September rolling off of the average to be replaced by this week’s 214K. This was the third consecutive week with an increase in the average, albeit those increases have been small at 1K or less each week. While the moving average has been moving higher over the past month, it has by no means been by a concerning degree.

Turning to the non-seasonally adjusted data (NSA), claims rose to 197.8K. Through the end of the year, we are likely to see many more weeks with an uptick in the NSA number due to seasonal factors. Year-over-year on the other hand, which provides a better look at NSA data, claims rose by 7.3K. That is the largest YoY increase since July and the first time for the current week of the year that there has been a YoY increase since 2012. But, as with the other data, the level claims sit at are still very healthy. This week’s reading was far below the average of 323.25K for the current week of the year since 2000. Start a two-week free trial to Bespoke Institutional to access our interactive economic indicators monitor and much more.

Housing Starts Retreat, But Still Healthy
Both Housing Starts and Building Permits pulled back in September from their extremely strong August levels. In both cases, the pullback was expected, although in the case of Housing Starts, the decline was larger than expected (1.256 mln vs 1.320 mln estimate). Looking at the charts of both series below, September’s levels remain near their highs of the cycle.


The table below breaks down this month’s report by single and multi-family units as well as regions. While both starts and permits were down this month, all of the declines were in multi-family units (which was a driver of last month’s gains). In fact, in the case of both starts and permits, single-family units were up both on a m/m and y/y basis.

In a post on homebuilder sentiment yesterday, we noted that it would be hard to imagine that the economy is on the cusp of a recession with homebuilder sentiment being so high. Similarly, when we look at the 12-month average of Housing Starts and Building Permits over time, current trends are not suggestive of a broader economic downturn. As shown in the top chart below, every prior US economic recession has historically been preceded by a downturn in the 12-month average of Housing Starts. In some cases, the peak in starts came well before the recession started and in others, it was within a year. Looking closely at the chart, while the 12-month average most recently peaked back in September 2018, it hasn’t yet shown signs of rolling over as it did leading up to prior recessions.

In fact, if we take a closer look at both Housing Starts and Building Permits, the 12-month average has actually started to tick higher again. That’s an important trend because going back to the mid-1960s, there has never been a period where we saw rising levels of starts heading into a recession. Start a two-week free trial to Bespoke Institutional to access our actionable research and interactive tools.

Bespoke Morning Lineup – 10/17/19
See what’s driving market performance around the world in today’s Morning Lineup. Bespoke’s Morning Lineup is the best way to start your trading day. Read it now by starting a two-week free trial to Bespoke Premium. CLICK HERE to learn more and start your free trial.

The Closer – Weekly Fund Flows Update, Nordic Nosedive, Beige Book – 10/16/19
Log-in here if you’re a member with access to the Closer.
Looking for deeper insight on markets? In tonight’s Closer sent to Bespoke Institutional clients, we show the record level in EURNOK and reversal in the past couple of years build up in UST long positioning. We also show what precedent the largest banks have set for earnings given their results so far. We also take a more quantitative look at the Fed’s Beige Book with our Beige Book Index. We finish with our weekly recap of fund flows.
See today’s post-market Closer and everything else Bespoke publishes by starting a 14-day free trial to Bespoke Institutional today!
Netflix (NFLX) Earnings On Deck
The charts of the FAANG stocks have left something to be desired over the past several months. Streaming giant Netflix (NFLX) is a prime example. The stock managed to recover nearly all of its late 2018 losses in the first half of 2019, but it gave up the ghost in the wake of July’s earnings report when the company missed subscriber estimates. NFLX has remained in a downtrend in the months since with a recent lower low around support near last November’s lows. Granted, this recent low was still 8.9% above the 52-week low from Christmas Eve of last year. Now at the top of this downtrend, NFLX reports earnings once again tonight after the close and given its historical volatility around earnings, the stock has an opportunity to either break out or break down.

Although the 10.27% one-day decline in response to the last quarter’s report that preceded NFLX’s recent downtrend may sound bad, the move was basically par for the course. Netflix is one of the most volatile stocks on earnings with shares averaging an absolute move the day after earnings of 12.78% across all quarters since 2002. So last quarter’s decline was actually smaller than the average! As shown in the table from our Earnings Explorer tool below, that was the worst full-day decline in reaction to earnings since Q2 2016, but there was actually a larger gap down at the open just one year prior in July of 2018; although most of that decline was regained intraday. Headed into tomorrow, it should come as no surprise to investors if the stock swings wildly regardless of what the results of the quarter are. EPS is estimated to come in at $1.05 and sales are expected to grow to $5,247.5 million.

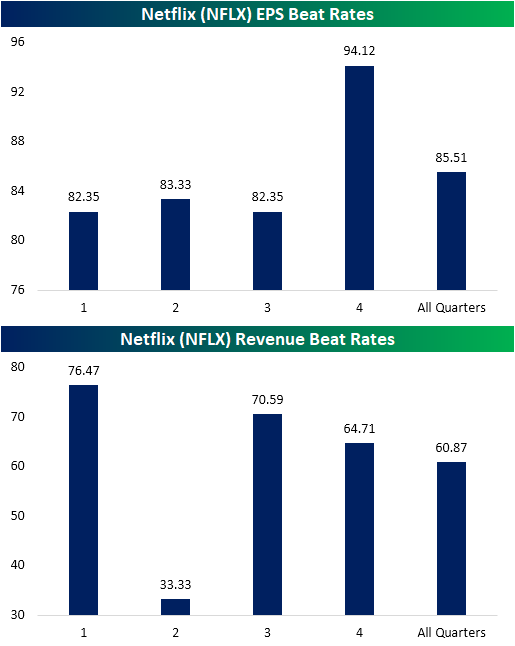
Looking at the historical trends of NFLX’s beat rates, last quarter’s revenue miss could have been expected. NFLX has only exceeded Q2 revenue estimates 33% of the time. The other three quarters have much stronger beat rates. As for today, the third quarter’s revenue beat rate is the second strongest at 70.59%, only behind the first quarter’s 76.47% beat rate. When Netflix has beaten revenue estimates in the third quarter, it has averaged a one-day share price gain of 2.74% with the stock positive two-thirds of the time. On the other hand, when there is a revenue miss in the third quarter, the stock has always declined, averaging -12.3%.
With regards to EPS beat rates, Netflix most consistently exceeds expectations in the fourth quarter having done so 94.12% of the time. Other quarters are a bit weaker in the low-80% range. For the third quarter, as with the first quarter, NFLX has beaten EPS 82.35% of the time.
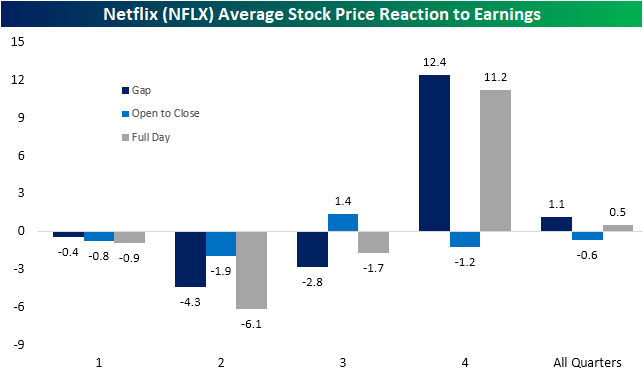
Looking at the average stock price reaction to earnings, last quarter’s decline again could have been expected as the second quarter has averaged the largest gap down, decline from open to close, and full-day decline of any quarter. Third-quarter results have only been slightly better as NFLX averages a gap down of 2.8% and a full day decline of 1.17%. One silver lining, though, is that the third quarter is the only quarter that has seen the stock rise on average (1.4%) from the open to the close after its initial opening gap. Meanwhile, the fourth quarter has typically seen the strongest overall performance with an average gap up of 12.4% and full-day gain of 11.2%. Start a two-week free trial to Bespoke Institutional to access our interactive Earnings Explorer and much more.
Fixed Income Weekly – 10/16/19
Searching for ways to better understand the fixed income space or looking for actionable ideas in this asset class? Bespoke’s Fixed Income Weekly provides an update on rates and credit every Wednesday. We start off with a fresh piece of analysis driven by what’s in the headlines or driving the market in a given week. We then provide charts of how US Treasury futures and rates are trading, before moving on to a summary of recent fixed income ETF performance, short-term interest rates including money market funds, and a trade idea. We summarize changes and recent developments for a variety of yield curves (UST, bund, Eurodollar, US breakeven inflation and Bespoke’s Global Yield Curve) before finishing with a review of recent UST yield curve changes, spread changes for major credit products and international bonds, and 1 year return profiles for a cross section of the fixed income world.
In this week’s report we review which parts of the Treasury curve did not invert this cycle.

Our Fixed Income Weekly helps investors stay on top of fixed income markets and gain new perspective on the developments in interest rates. You can sign up for a Bespoke research trial below to see this week’s report and everything else Bespoke publishes free for the next two weeks!
Click here and start a 14-day free trial to Bespoke Institutional to see our newest Fixed Income Weekly now!