Bespoke’s Morning Lineup – 10/22/19
See what’s driving market performance around the world in today’s Morning Lineup. Bespoke’s Morning Lineup is the best way to start your trading day. Read it now by starting a two-week free trial to Bespoke Premium. CLICK HERE to learn more and start your free trial.

Biogen (BIIB) Set to Gap up 40% on Earnings/Drug News
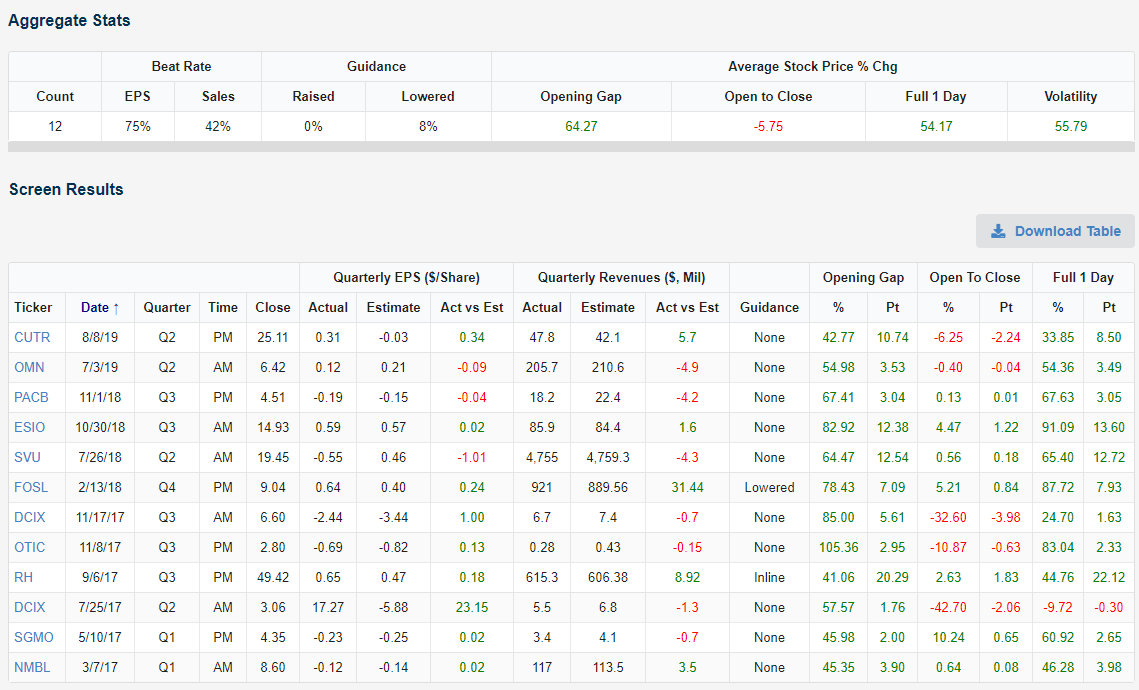
Biogen (BIIB) shares are currently set to gap higher by 41% this morning due to earnings and positive news for its Alzheimer’s drug. A 40%+ gap on earnings is extremely rare, but we can find historical occurrences very easily using our Earnings Explorer tool. Seeing how prior stocks performed following big gaps up or down on earnings is one of the many useful ways to use our Earnings Explorer. Below are the results from a quick screen we ran that found all stocks reporting earnings since the start of 2017 that opened higher by at least 40% on the day. As shown, there have only been 12 occurrences, and the average gap up at the open for these 12 names was +65.27%.
After their initial massive gap higher, these 12 stocks averaged a decline of 5.75% from the open to the close of trading, so it appears that traders look to book some profits. However, the average is actually skewed by DCIX, which shows up twice on the list with back-to-back gaps up of 50%+ back in 2017. In July 2017, DCIX opened higher by 57% only to trade down 42% from the open to the close for a full-day decline of 9%. In November 2017, DCIX opened up 85% only to fall 32% from the open to the close. On its November 2017 report, at least DCIX still managed to close higher by 25% for the full day.
All in all, 7 of the 12 stocks that have gapped up 40%+ on earnings since 2017 have continued higher from the open to the close. One thing for sure is that BIIB would be the highest priced stock to gap up 40%+ on earnings since at least 2001 when our database begins. No stock above $200/share has gapped up even 30%+ following an earnings report. The only $100+ stocks to gap up 30%+ since 2001 are Netflix (NFLX) and First Solar (FSLR). Netflix opened higher by 39% following its January 2013 report (when it had closed at $103/share the prior day) and it gained another 2% from the open to the close that day. FSLR closed at $167/share on 11/7/07 and then gapped up 32% the next morning following earnings. That day FSLR continued higher by 1.5% from the open to the close to finish the day up 34.3%. Biogen (BIIB) closed yesterday at $223.51 and is currently trading between $305-$320 in the pre-market. Start using our Earnings Explorer tool now with a Bespoke Institutional membership. Click here to join and get your first 14 days free.
The Closer – EMFX, Dollar Positioning, Building Reversals, Banks, Canada Votes – 10/21/19
Log-in here if you’re a member with access to the Closer.
Looking for deeper insight on markets? In tonight’s Closer sent to Bespoke Institutional clients, we go over multiple FX currencies including KRW, the Taiwanese dollar, Chinese yuan, and Chilean peso. We also look at how speculators are positioned on the US dollar and reasons to expect further dollar weakness. We then review banks’ breakout before turning to a primer on the Canadian election.

See today’s post-market Closer and everything else Bespoke publishes by starting a 14-day free trial to Bespoke Institutional today!
Can Cadence (CDNS) Keep Its Streak?
Cadence Design (CDNS), an electronic design supplier and engineering services firm, reports earnings after the close tonight. The company is expected to report EPS of $0.51 and sales of $576.3 million compared to EPS of $0.49 and revenues of $532.5 million one year ago. Over the past couple of years, CDNS has been notable in the stock’s price reaction on earnings days has been consistently positive. Headed into tonight’s report, the stock is on a streak of six consecutive quarters with a positive full-day reaction. That is the longest such streak for CDNS since a six quarter long streak that came to an end in January of 2013. The company has also frequently reported earnings triple plays (EPS and sales beat in addition to raised guidance) in the past couple of years with half of the last ten quarters experiencing a triple play.

Given the company’s business is tied with that of semiconductors (SMH), while not wholely a semiconductor company itself, CDNS has generally followed the trends of the industry over the past few years. But there has been a few divergences in the past year. Whereas the two had been in steady uptrends earlier in the cycle, then trending sideways together for most of 2018, the Q4 2018 sell-off hit SMH much harder. Since the sell-off, both have rocketed higher in 2019; CDNS even more so than SMH. More recently though, since shortly after CDNS’s last earnings report in July, it has underperformed as shown in the relative strength chart in the second chart below. As CDNS sits in a downtrend, SMH has managed to reach new highs. While the two have not necessarily perfectly tracked each other, the move higher in the semis would have suggested CDNS to move higher.
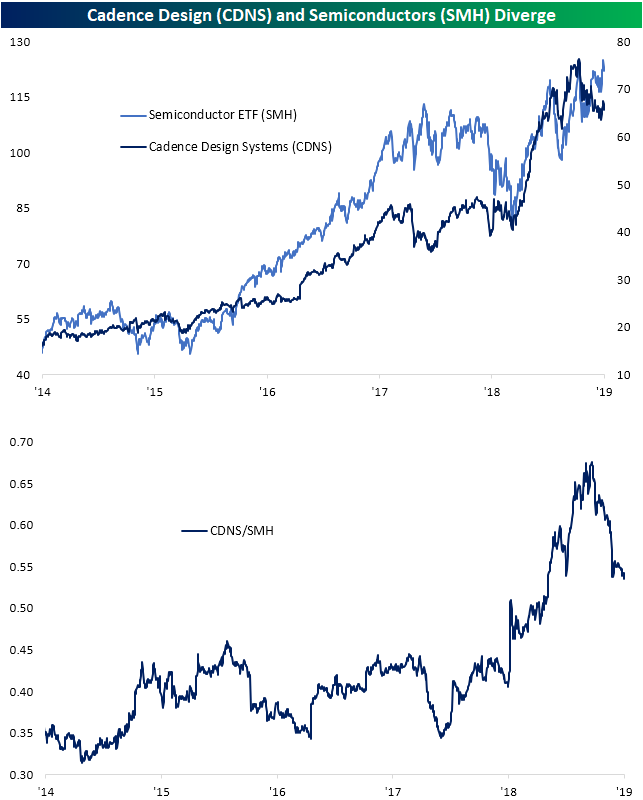
Headed into this quarter’s earnings, the chart of CDNS has actually begun to reverse this downtrend. After finding support around prior lows at ~$63, the stock broke out of its downtrend but failed to hold above its 50-DMA. If the past six quarters’ trend of positive reactions to earnings continues—in addition to the broader support of related semiconductor stocks—it could be the catalyst needed for the stock to continue to break its downtrend. Start a two-week free trial to Bespoke Institutional to access our Earnings Explorer and much more.

Leading Indicators Decline
We didn’t mention it Friday, but among the multitude of weaker than expected economic indicators last week, the index of Leading Economic Indicators for September was one of them. While the consensus forecast was for the index to remain unchanged from August’s level, it actually declined 0.1%. At times in the past, we have highlighted how sharp downturns in the ratio between Leading and Coincident indicators have often preceded recessions.
In the current cycle, it has now been twelve months since the ratio peaked last September, and while that raises the risk of a recession, we would note that the current downturn in this ratio has been much more gradual than the steep downturns that we saw leading up to prior recessions. Additionally, in both the 1960s and 1990s, we saw instances where the ratio saw much steeper declines without a recession.
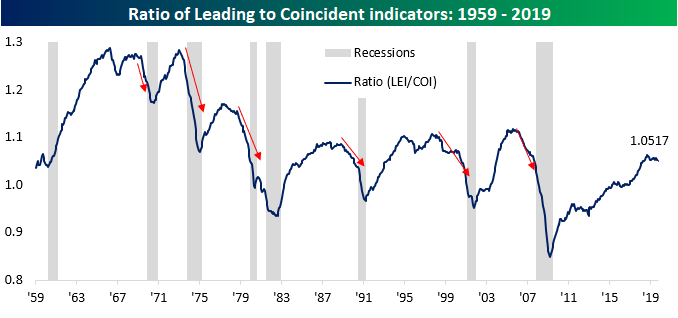
The recent downturn in the ratio between Leading and Coincident Indicators isn’t even the first time during this cycle that we have seen the ratio lose momentum and show similar declines. From mid-2011 through late 2013, the ratio went 27 months without hitting a new cycle high, and then again from the second half of 2015 through the end of 2016, there was an 18-month stretch without a new high. In the current period, it has only been 12 months without a new high.
While the current lull in the Leading vs Coincident Indicator ratio hasn’t been long yet, it is still declining. Therefore, it’s nowhere near close to snapping the streak of months without a high. Just looking at the last two periods, for example, from the time the ratio bottomed, it took nine months in 2013 and 11 months in 2016 before the ratio fully rebounded and hit a new high for the cycle. In other words, if the ratio doesn’t start rebounding soon, this period will go down as the longest period of economic slack/consolidation of the expansion. Join Bespoke Premium now to get Bespoke’s most actionable stock market research. Click here to get your first 14 days free.

S&P 500 Average Performance by Weekday: 2019
Below is an updated look at the average performance of the S&P 500 (SPY) by weekday so far in 2019. As shown, Monday has been the only day of the trading week that has averaged a decline so far this year, but Tuesday has bounced back with an average gain of 0.12%. Wednesday has seen a small gain of 0.04%, but Thursday and Friday have both been very solid days this year. Thursday has seen the S&P average a gain of 0.16%, while Friday has closed out the week with an average gain of 0.17%. For all days this year, SPY has averaged a gain of 0.09%. That’s all you need per day to get to a 20% YTD gain through 10.5 months.

We can break the day out by opening gap versus open to close change as well. By opening gap, we mean SPY’s change from its prior day’s close to its next open. The open to close is the change from SPY’s opening price at 9:30 AM ET to its closing price at 4 PM ET. The opening gap and the open to close change combine for SPY’s full one-day change.
As noted above, Monday has been the only trading day of the week this year to average a decline. As shown below, all of that decline has come at the open of trading on Monday. SPY has averaged a gap down of 0.06% at the open on Mondays, but it has averaged an open to close gain of 0.02%. On Tuesdays, we’ve seen a reversal of Monday’s trend. SPY has averaged an opening gap of 0.12% on Tuesdays in 2019 and then a flat open to close.
Wednesday has averaged a flat open and a gain of 0.05% from the open to the close, while Thursday has averaged a gap up of 0.03% and a further gain of 0.13% from the open to the close.
Friday has seen strength at the open with an average gap higher of 0.11%. Intraday action on Fridays has been strong as well with an average open to close gain of 0.07%. With all the strength on Friday, investors haven’t been worried about holding equities over the weekend this year even with all the concerns over trade and geopolitical issues. They do come into the new trading week with some worries, though, given the Monday gaps down. Join Bespoke Premium now to get Bespoke’s most actionable stock market research. Click here to get your first 14 days free.

This Week’s Economic Indicators – 10/21/19
In spite of the focus on earnings last week, there was still a decent amount of economic data; two-thirds of which came in either weaker than expected or weaker versus their prior reading. Due to the Columbus Day holiday, Empire Manufacturing was not scheduled to release until Tuesday, but it was accidentally published midday Monday stronger than expected. Other manufacturing data released last week included the Philadelphia Fed’s manufacturing index and Industrial Production which all were weaker than expected. There were no releases on Tuesday but things picked back up on Wednesday with the release of a weaker retail sales report. It wasn’t all bad news on Wednesday, though, as the NAHB’s index on homebuilder sentiment came in at 71 compared to expectations that the index would remain unchanged at 68. Elsewhere in housing data, as expected Housing Starts are Building Permits pulled back. The final release of the week, the Leading Index, came in at -0.1% MoM compared to estimates of no change.

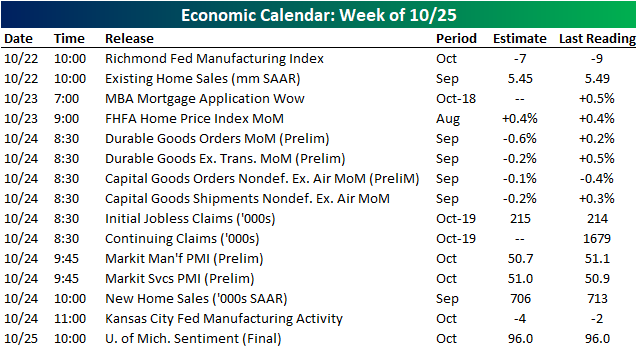
This week, earnings will likely continue to be a greater focus than economic data as the number of companies reporting continues to increase. There will only be 15 releases spread throughout the week with the Richmond Fed’s Manufacturing Index starting things tomorrow (there is nothing scheduled to release today). Other manufacturing data scheduled for this week include the Kansas City Fed’s index, durable and capital goods, and the preliminary Markit PMI. Following last week’s housing data, existing home sales is set to be released Tuesday, FHFA Home Price indices will be out Wednesday, and New Home Sales are due Thursday. Start a two-week free trial to Bespoke Institutional to access our interactive economic indicators monitor and much more.
Homebuilders on Fire, But Be Careful
The Homebuilder group has been one of the best performing areas of the stock market so far in 2019. The ETF that tracks the group — ITB — is currently up 49% YTD and 67% from its 2018 lows.
You may expect the group to be trading at multi-year highs with a rally like the one seen this year, but all this rally has done is erase a steep 40% decline experienced in 2018! As shown below, ITB has basically gone parabolic over the past few months, but it’s only just now approaching the high it made in January 2018. Start a two-week free trial to Bespoke Institutional to unlock access to our actionable research and interactive tools.

Don’t look now, but homebuilders are again approaching their all-time highs seen during the mid-2000s housing bubble as well. Investors knew it would be a long, long road to recovery following the housing crash that saw the S&P 1500 Homebuilder group fall nearly 90% from its July 2005 high. But we’re now more than 10 years removed from the ultimate low for the group, and on Friday it traded within 10% from its all-time high.

Most homebuilders that are members of the ITB ETF — shown below in our Trend Analyzer snapshot — are up more than 50% year-to-date. Every single stock in the ETF is also now trading in overbought territory, with about half of them at extreme levels (more than 2 standard deviations above their respective 50-DMAs). So while our long-term “trend” algo scores all of these stocks as being in uptrends, many of them get “poor” timing scores because of how overbought they are. When things get this extended, you typically see some downside mean reversion or at the very least, sideways trading. This mean reversion can occur from either a drop in share prices or sideways trading that allows the moving averages to catch back up.

There are some signs that maybe the homebuilders have gotten a little ahead of themselves lately. Mortgage rates have mirrored ITB closely over the last two years. In 2018, mortgage rates rose sharply, which caused the homebuilders to have a terrible year. This year we’ve seen the exact opposite, with mortgage rates dropping and homebuilders rallying. Over the last two months, however, mortgage rates have stopped falling and instead have flattened out. Homebuilders have continued to surge. You can see the divergence in the chart below which shows ITB versus the inverse of mortgage rates. If this relationship is to continue, either homebuilders need to come back down to earth a bit, or mortgage rates need to take another leg down.

Stuck in Neutral
Even after taking into account Friday’s weakness, it was mostly a positive week for the US last week as all of the major index ETFs with the exception of the Dow Jones (DIA) were up. As shown in the snapshot from our Trend Analyzer tool, outside of the Nasdaq 100 (QQQ), every major US index ETF is kicking off the week in neutral territory. Not a terribly exciting backdrop but it’s one you would expect in an environment where equities have been stuck in a seemingly never-ending range.

Just about every major US index ETF is stuck in neutral, but sector performance has varied a bit more. Last week, Energy (XLE), Technology (XLK), Consumer Staples (XLP), and Utilities (XLU) were all down, while Health Care (XLV) rallied more than 2%. In most cases, the performance of individual sectors last week involved some reversion as Health Care has been one of the weaker sectors YTD and Technology, Consumer Staples, and Utilities have been leaders. In the case of Energy, though, it has just been a continuation of the weak trend. Coming into this week, Energy is the only sector below its 50-day moving average and to make matters worse, its timing score in our Trend Analyzer tool is ‘Poor’. With crude oil prices trading down nearly one percent again this morning, the sector still faces a pretty stiff headwind. While the major averages are stuck in a range, Energy has been in a seemingly never-ending downtrend. Start a two-week free trial to Bespoke Institutional to unlock access to our actionable research and interactive tools.

Bespoke’s Morning Lineup – 10/21/19
See what’s driving market performance around the world in today’s Morning Lineup. Bespoke’s Morning Lineup is the best way to start your trading day. Read it now by starting a two-week free trial to Bespoke Premium. CLICK HERE to learn more and start your free trial.