Asset Class Performance This Election Cycle
We are now four weeks and one day away from Election Day 2020. Below is a look at our asset class performance matrix highlighting the total return of key ETFs over three time frames: since Election Day 2016 (11/8/16), since Trump took office on 1/20/17, and since the first US case of COVID was confirmed (1/20/20).
The Nasdaq 100 (QQQ) has been by far the best performing US index ETF this Presidential Election Cycle. Since Election Day 2016, QQQ is up 146%, while the S&P 500 (SPY) is up 70.7% and the Russell 2,000 (IWM) is up 38.5%. Looking at US sectors, Technology (XLK) and Consumer Discretionary (XLY) are both up 100%+ since Election Day 2016, while the Energy sector (XLE) is down 48%. The Financial sector (XLF) has been the second worst performer under Trump with a gain of 33.9%.
International equity market returns (on a dollar adjusted basis) have been much weaker than the US since Trump’s victory. Country returns since Election Day 2016 range from double-digit percentage declines for Brazil (EWZ) and Mexico (EWW) to a 45.4% gain for China (ASHR). China’s gain, however, is still 25 percentage points worse than the S&P 500.
What may be more notable are equity market returns since COVID began. Since the first US case of COVID was confirmed on January 20th, the S&P 500 (SPY) has still managed to post a 3.4% gain. The Nasdaq 100 (QQQ) is up a remarkable 25.3% during the pandemic, while the small-cap Russell 2,000 (IWM) is down 6.8%. Value stock ETFs have also gotten hit hard during COVID, while growth has outperformed.
Looking at sectors, Energy (XLE), Financials (XLF), Utilities (XLU), and Industrials (XLI) are the sectors that remain in the red since COVID, while Tech (XLK) and Consumer Discretionary (XLY) are up 17%+. Gold (GLD) and silver (SLV) have also been two of the top performers during COVID along with longer-dated Treasury ETFs like TLT. Click here to try Bespoke Premium free for two weeks!

What Was the Service Sector Saying in September?
In an earlier post, we detailed the results of the September ISM Non-Manufacturing PMI. While the headline index and the sub-indices were indicative of general improvements in the services side of the economy more broadly, the commentary section offered some interesting minutia on specific areas of business. For starters, the commentary was conflicting. When discussing the broad outlook, adjectives used ranged from “bleak” and “uncertain” to “optimistic”. More specifically, the Arts, Entertainment, and Recreation sector, which remains largely closed appeared to have some of the most pessimistic commentaries while the Health Care and Social Assistance commentary, perhaps surprisingly for elective procedures to be exact, held a very confident point of view. Meanwhile, the Educational Services industry walks the tightrope noting that if students are sent home, the result would be “a drastic reduction in our revenue.” In other words, on an aggregate level, the report’s data surrounding the services sector has shown a continued recovery, but anecdotally, certain industries are still on shaky footing if not completely left out of the recovery so far.
The commentary also shed some light on a few COVID era trends. Circling back to the comments from the Health Care and Social Assistance industry, it noted that “productivity remains high, possibly higher, than when we are in our office,” giving fodder to the argument that work from home could be more permanent. The same comment made mention that a return to work is not in the plans until mid-next year. Additionally, as housing market data continues to impress, the Construction industry mentioned that it does not have appropriate labor levels to meet the pace of rising orders. Meanwhile, the Wholesale Trade industry noted the strength in sales for home-improvement. Besides that, the Insurance industry made mention that bad weather and protests—which have been pillars (outside of COVID) of current events over the past several months—have had an impact on business. The commentary also made note of some supply chain issues. The Health Care and Social Assistance industry noted vendor rejections and Retail and Wholesale Trade both detailed issues with suppliers. Those issues included port and rail delays, capacity problems, hiring difficulties, and adverse weather.

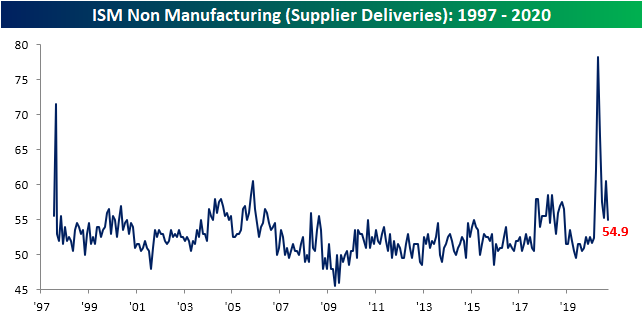
Those final comments from the Retail Trade and Wholesale Trade industries about supply chain issues are consistent with this month’s data from the report. As shown below, imports were lower with the index in contraction in September falling to 46.6. The index for Supplier Deliveries saw a drop larger than 99% of all prior monthly moves, but at 54.9 it is still historically elevated and is indicative of longer lead times.

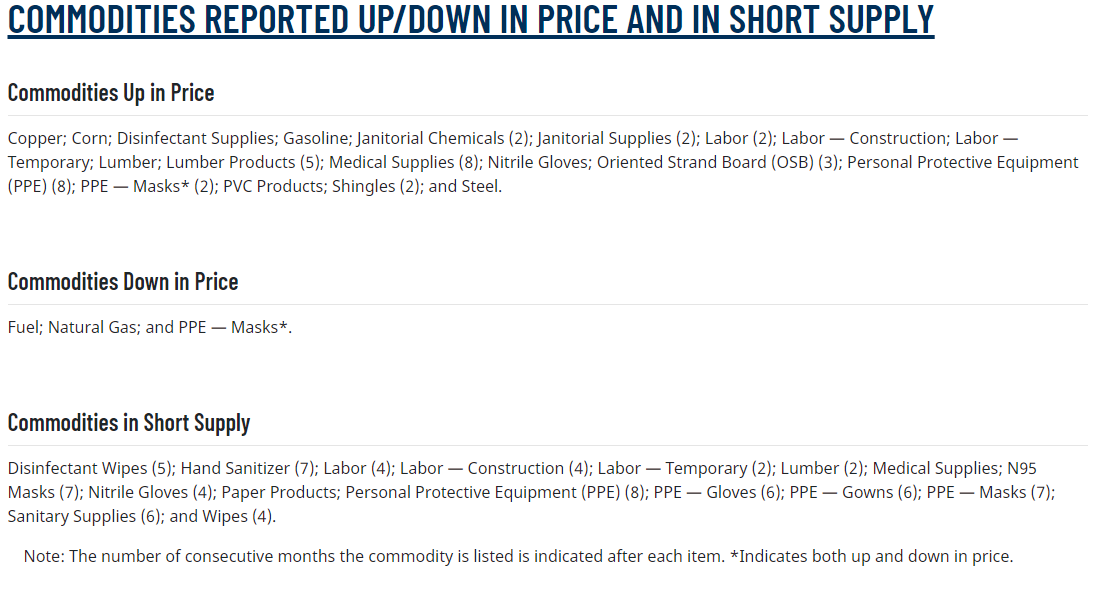
The ISM report also details the commodities that are reported as rising/falling in price and are in short supply. Preventative measures to stop the spread of COVID like cleaning supplies and personal protective equipment all remain in short supply, and consequentially, higher in price. Adding yet more reinforcement to how strong the housing sector of the economy has been, rising prices also applies to many commodities pertinent to the construciton sector like lumber, copper, steel, shingles, and labor. Finally, fuel and natural gas were reported as in short supply. Click here to view Bespoke’s premium membership options for our best research available.
Bespoke Matrix of Economic Indicators – 10/5/20
Our Matrix of Economic Indicators is the perfect summary analysis of the US economy’s momentum. We combine trends across the dozens and dozens of economic indicators in various categories like manufacturing, employment, housing, the consumer, and inflation to provide a directional overview of the economy.
To access our newest Matrix of Economic Indicators, start a two-week free trial to either Bespoke Premium or Bespoke Institutional now!

ISM Services Shine
As we discussed in our Monring Lineup, the resurgence of COVID in some global economies resulted in a number of weaker readings in Markit Service PMIs; namely those in Europe. Meanwhile, the reading for the US released this morning met expectations at 54.6, unchanged from the flash reading but slightly lower than last month’s reading of 55.0. The ISM reading for the Non-Manufacturing sector, on the other hand, had a stronger showing in September with the headline index rising to 57.8 from 56.9 in August. That was also stronger than expected as forecasts were calling for the reading to decline to 56.2 which would have more closely resembled the Markit reading. At 57.8, this reading indicates that the service sector of the economy continued to expand sequentially for a fourth straight month in September and at a slightly accelerated rate from August. While not quite as strong as the reading from July, the services sector continues to bounce back at the strongest pace of the past couple of years.

While the ISM’s reading on services was stronger than expected, last Thursday’s release of the manufacturing counterpart was more of a disappointment, although, it was still consistent with further improvements in that area of the economy. Despite that decline, the composite of the two readings rose to 57.5 from 56.8. Just like the services index, outside of the July high that is at one of the strongest levels since 2018.

Breadth in the September report was mixed with a nearly an equal number of sub-indices rising and falling month over month. Despite this, there were only two indices, Inventories and Import Orders, that fell into or remained in contractionary territory. So overall, the report was consistent with continued improvement in the services sector across various metrics.

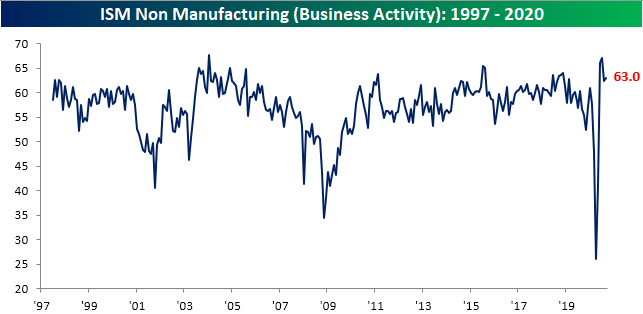
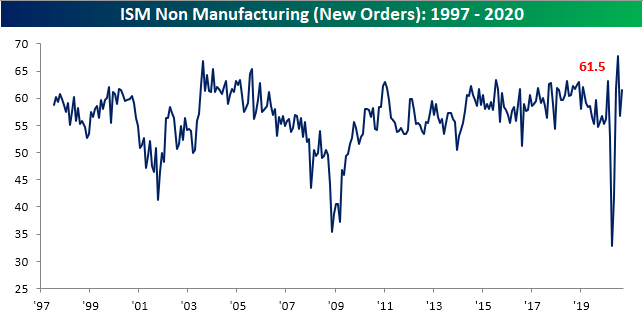
For starters, overall demand seems to have held up well in September with the indices for Business Activity and New Orders both rising and coming in the strongest levels of any of the individual indices of this month’s report. Similar to the headline number, these indices were higher in September after a drop in August from near-record levels in July. Currently, both are still off those highs but remain at the upper end of their historical ranges. The index for New Orders saw the largest improvements this month with a 4.7 point rise.
While businesses receive more orders and general business activity continues to ramp up (both for a fourth consecutive month), the rate of Backlog Orders has slowed. As shown below, that index fell to a barely expansionary reading of 50.1 in September. Outside of the 7.3 point decline in April, the 6.5 point drop this month was the largest since June of 2011. In other words, businesses saw a significant deceleration in existing orders in the month of September. Given new orders rose, that was likely thanks to higher production rather than softening demand.

With businesses working off their order backlogs, inventories have continued to decline. Although higher in September, the index for Inventories has now been in contractionary territory for back to back months. Those inventory declines are also consistent with what has been observed for the manufacturing sector.

One major positive of the September report was that for the first time since February, the survey showed Employment expanded. The index rose to 51.8 after half of a year of contractionary readings. Comments from respondents regarding employment noted that this increase in employment was bringing back furloughed workers and increased hiring to meet increased demand. Click here to view Bespoke’s premium membership options for our best research available.

Bespoke’s Morning LIneup – 10/5/20 – Flirting With the 50-Day
See what’s driving market performance around the world in today’s Morning Lineup. Bespoke’s Morning Lineup is the best way to start your trading day. Read it now by starting a two-week free trial to Bespoke Premium. CLICK HERE to learn more and start your free trial.
“How many millionaires do you know who have become wealthy by investing in savings accounts? I rest my case.” – Robert G. Allen
It’s a new week, but the headlines remain the same as markets remain focused on the health of the President, possibilities for stimulus, and the election. This week’s calendar is extremely light in terms of both economic data and earnings, so expect news outside of the economy and earnings to be the main driver of movement this week.
Be sure to check out today’s Morning Lineup for a rundown of the latest stock-specific news of note, market performance in the US and Europe, updates to the latest Services sector data from Markit, trends related to the COVID-19 outbreak, and much more.

Heading into the new week and the first full week of the fourth quarter, all of the major US indices are currently battling with their 50-day moving averages as just one of the 14 major index ETFs is more than 1% above or below it’s 50-day moving average. The S&P 500 has been battling back and forth with closes above and below its 50-DMA over the last week and gone nowhere in the process. Hopefully this week, we’ll get some more clarity over which way the index will break.

Within the eleven S&P 500 sectors, the picture looks a little better. Through Friday’s close, seven sectors finished the week above their respective 50-day moving averages while just four finished below. Not surprisingly, the only one of those four that finished the week more than 2% below its 50-day moving average was Energy.

Bespoke 2021 Special
Bespoke Investment Group has been providing investors with clear, actionable analysis since our founding in 2007, and we’re currently working hard on our biggest and most important report of the year — The Bespoke Report 2021 Market Outlook and Investor Toolkit.
It’s not hard to describe the contents of this report because it simply has it all. This report prepares you with everything you need to know for the year ahead, and it’s a must-read for all investors.
How can you gain access to our annual Bespoke Report? It’s easy. Join one of our three membership levels now with our “2021” special offer and the report is included. What is the “2021” special? You’ll get one month of any membership level for just $20, then you’ll get 20% off the regular monthly rate going forward. Join now because this special is only available for a limited time! Choose an option below to sign up now. Click here if you’re looking for more details on what’s included with each membership level.
Bespoke 2021 Special — Bespoke Newsletter
Bespoke 2021 Special — Bespoke Premium
Bespoke 2021 Special — Bespoke Institutional
Bespoke Brunch Reads: 10/4/20
Welcome to Bespoke Brunch Reads — a linkfest of the favorite things we read over the past week. The links are mostly market related, but there are some other interesting subjects covered as well. We hope you enjoy the food for thought as a supplement to the research we provide you during the week.
While you’re here, join Bespoke Premium with a 30-day free trial!
Clean Energy
Compact Nuclear Fusion Reactor Is ‘Very Likely to Work,’ Studies Suggest by Henry Fountain (NYT)
“Hot” fusion has been the energy of the future for decades, and there’s no reason to suspect that it’ll come soon, but recent research is showing some modest progress. [Link; soft paywall]
Solar’s Future is Insanely Cheap (2020) by Ramez Naam (Ramez Naam)
An overview of the absolutely staggering rate of decline in solar prices and why those declines are likely to continue, pushing the cost of new solar watts far below the operating cost of natural gas and coal plants. [Link]
Education
University lockdowns: a whole new way to fail young people by Robert Shrimsley (FT)
Frustration over steps to reduce transmission of COVID on university campuses after a failure to introduce a mass testing regime in the UK. [Link; paywall]
The Students Left Behind By Remote Learning by Alex MacGillis (The NYer)
As with so many aspects of COVID, the costs of remote learning are not born evenly by wealth and lower income students. [Link]
‘Roadschooling’ 101: Families Make Remote Learning Work in an RV by Julie Jargon (WSJ)
Families that can afford it are taking advantage of remote schooling to hit the road, spending months wandering American roads and national parks with pauses for video chats. [Link; paywall]
Teachers Find Higher Pay and Growing Options in Covid Pods by Nancy Keates (WSJ)
Higher-income families are getting together for small-group learning with private teachers that bypass many of the risks of the public school system. [Link; paywall]
Retail Investing
A 32-Year-Old Trader Is Driving 21,000 Amateur Stock Investors by Edward Robinson and Justina Lee (Bloomberg)
A feature allowing users to automatically copy trades of other platform users has fueled growth for UK-Israeli brokerage eToro. [Link; soft paywall]
The Rise of Retail Investing In The U.S. (Morning Consult)
A highly-detailed, very long overview of the retail investment landscape: what motivates retail investors, who they are, and how they use investing platforms. [Link; 55 page PDF]
New Swath Of ETF Closures Fuels Record Pace by Heather Bell (ETF.com)
It shouldn’t be a surprise that an industry which innovates as quickly as ETFs do with a huge proliferation of products also cuts losers, and that’s what’s been going on lately. [Link]
Local Challenges
Vermont was making progress against opioid deaths. Then coronavirus hit. by Hilary Swift and Abby Goodnough (South Florida Sun-Sentinel)
Opioid-related deaths are surging across the country as the disruption of COVID drives current and recovering addicts into despair and spirals of use which too often end in tragedy. [Link]
‘Crisis point’: How the Gallatin Valley’s hot housing market leaves people behind by Melissa Loveridge (Bozeman Daily Chronicle)
Homes in Gallatin County, Montana are surging thanks to COVID; the median single-family home is listed for $575,450 in August, almost 10x median income for the county. [Link]
Travel
Some Travelers Miss Flying So Much, They’re Taking Planes to Nowhere by Dasl Yoon and Joyu Wang (WSJ)
Travelers are taking flights to nowhere, sometimes facilitated by package “tours” that don’t involve actually landing, in a desperate bid to regain a sense of normalcy. [Link; paywall]
Amazon jumps into virtual tourism, offering live one-on-one experiences around the world by Todd Bishop (GeekWire)
Remote tourism is a brand new concept that AirBnB has already introduced and Amazon is now putting into beta, allowing walking tours, cooking classes, and other experiences from the comfort of home. [Link]
False Positives
Clinical evaluation and diagnostic yield following evaluation of abnormal pulse detected using Apple Watch by Kirk D Wyatt, Lisa R Poole, Aidan F Mullan, Stephen L Kopecky, and Heather A Heaton (JAMIA)
Only 11% of patients whose Apple Watches alerted them to an abnormal pulse received an explicit diagnosis, suggesting the device could create over-use of health care by Apple Watch owners. [Link]
Read Bespoke’s most actionable market research by joining Bespoke Premium today! Get started here.
Have a great weekend!
Make Up Your !@#$%^&* Mind!
You: Where do you want to go for dinner tonight?
Them: How about Italian?
You: Sure, sounds good.
Them: I also heard that new Greek place is good.
You: I’m fine with that.
Them: No, we can do Italian.
You: K.
Them: If that’s what you want to do.
You: You’re the one that suggested it.
Them: But you were quick to agree.
You: OK. Let’s do Greek then.
Them: I guess that’s fine.
You: Perfect.
Them: But I was in the mood for Italian. You always pick.
You: I didn’t pick anywhere and don’t care. Just pick a place.
Them: Well if you are going to argue about it, I don’t want to go.
You: Seriously?
Them: Goodbye.
You: Fine.
Them: Fine!
We’ve all had versions of this conversation where you or the person you were talking to just couldn’t make up their mind. At the end of the day, it only causes trouble and plans are ruined.
The market is having its own back and forth this year trying to decide between growth and value. Just today, growth stocks are getting slaughtered while value stocks are up marginally. As an example, the Russell 1000 Growth index is down 1.8% on the day while the Russell 1000 Value index has managed to rally 0.25%. The chart below shows the daily performance spread between the Russell 1000 Growth index and the Russell 1000 Value index for each day in 2020. Today’s performance spread between the two indices marks the ninth time this year that value has outperformed growth by more than two percentage points. At the other extreme, there have also been eight trading days where growth outperformed value by more than two percentage points.

So how does this year’s frequency of days where the performance spread between the two indices was more than two percentage points stack up to other years? The chart below shows the daily performance spread between the two indices going all the way back to 1990. Over the last thirty years, the only two periods where we saw a frequency of these large daily dislocations was back in 2008 and the period spanning 2000 and 2001. In fact, with 17 days this year where the performance spread between the two indices was greater than two percentage points, the only other years that saw a higher frequency of large dislocations were 2000 (54) and 2001 (28). If you think the market has been indecisive this year, in 2000 we saw these types of daily dislocations an average of once per week. Click here to view Bespoke’s premium membership options for our best research available.

Anti-Social Media Stocks
Social media has been one of the most popular and controversial sectors of society over the last decade, and the performance of Facebook (FB) since its IPO illustrates the strength of a business that thrives on people keeping tabs of each other with a steady helping of ads in between. It hasn’t always been a smooth ride for Facebook (FB), though. Remember the ‘technical error’ on the day of the IPO back in May 2012? From there, things didn’t get much better quickly. In September 2012 the stock was down in the low $20s after its IPO at $38, and a Barron’s cover story said the stock was worth just $15. Facebook (FB) never did get down to $15 per share. Ironically enough, it’s now 15 times higher than its lowest ever closing price of $17.73 that it traded at right before the Barron’s article. The chart of Facebook since its IPO shows that the road forward hasn’t always been smooth, but for Facebook, it has been a success.

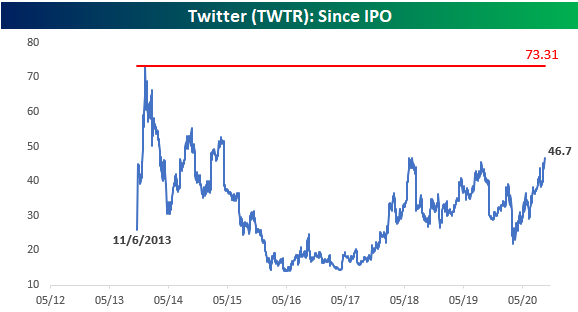
The performance of Facebook (FB) suggests that it has been good to be a social media stock over the last several years, but for other stocks in the sector, life as a public company has been anything but likable. Let’s start with Twitter (TWTR) which came public just after FB started to break out. TWTR’s IPO price was $26 per share, but it immediately traded up above $70 before the end of 2013. For the next two years, though, TWTR did nothing but trade lower. It wasn’t until shortly after President Trump took office that the stock started to bottom out and rally again. At its current level of $46, TWTR is above its IPO price but still down more than 35% as it tries to break above two prior highs at similar levels in mid-2018 and mid-2019. Will the third time be the charm or a strikeout?
Finally, there’s Snap (SNAP). Of the three publicly traded social media companies, SNAP is easily the most popular among kids, but even with that popularity, most of its time as a public company has been forgettable. The stock IPO-ed at $17 on 3/1/17 just as TWTR was near its post-IPO lows. Despite the tough environment that TWTR experienced, within two days SNAP was up over 50% and above $27. Like everything else on the app, though, SNAP’s gains quickly disappeared, and by the end of December 2018, it closed below $5 per share. In the less than two years since that low in December 2018, SNAP has made an impressive comeback, and as of yesterday’s close was within 50 cents of a new closing high. It took Facebook (FB) a year to take out its IPO price, but from there it was off to the races for the stock. In SNAP’s case, it has taken more than three years to even get back near its initial IPO highs, but now that it’s close to those levels again, shareholders are hoping it will have been worth the wait. Click here to view Bespoke’s premium membership options for our best research available.
