
Bespoke Brunch Reads: 1/3/21
Welcome to Bespoke Brunch Reads — a linkfest of the favorite things we read over the past week. The links are mostly market related, but there are some other interesting subjects covered as well. We hope you enjoy the food for thought as a supplement to the research we provide you during the week.
While you’re here, join Bespoke Premium with a 30-day free trial!
Security
GoDaddy Employees Were Told They Were Getting a Holiday Bonus. It Was Actually a Phishing Test. by Lorraine Longhi (The Copper Courier)
Lured with promises of a year-end bonus, employees of GoDaddy responded to an email from an internal domain only to find out they had failed a phishing test. [Link]
Insecure wheels: Police turn to car data to destroy suspects’ alibis by Olivia Solon (NBC)
With little precedent over privacy related to various data systems used in modern vehicles, privacy advocates and prosecutors are gearing up for a major conflict over whether the data cars carry can incriminate suspects. [Link]
Education
How Covid-19 Makes Teaching Reading Harder by Leslie Brody (WSJ)
Reading allowed is a challenge when teaching remotely, and that doesn’t include the challenges of faulty technology. Millions of children are at risk of falling far behind. [Link; paywall]
When the Great Equalizer Shuts Down: Schools, Peers, and Parents in Pandemic Times by Francesco Agostinelli, Matthias Doepke, Giuseppe Sorrenti & Fabrizio Zilibotti (NBER)
Educational inequality is already a huge challenge in the United States, and the pandemic is increasing the already wide gulf between students with resources and those without. [Link]
Hedge Funds
Human-Run Hedge Funds Trounce Quants in Covid Year by Hema Parmar, Katherine Burton, and Nishant Kumar (Bloomberg)
The dramatic volatility and rapid moves across the investment universe have made nimble human-driven funds better-performers than algorithmic traders in the hedge fund industry this year. [Link; soft paywall, auto-playing video]
Wrong-Way Bet on Covid Is Changing Oil-Trading Industry Forever by Alfred Cang (Bloomberg)
One of the biggest names in crude oil trading blew up in spectacular fashion, with billions in debt and nothing to show for it thanks to the collapse in demand for petroleum that led to a collapse in crude markets. [Link; soft paywall]
Books
Washington’s Secret to the Perfect Zoom Bookshelf? Buy It Wholesale. by Ashley Fetters (Politico)
The secret to a good Zoom bookshelf isn’t a wide library of books that you’ve read, but bulk orders intended only to meet the aesthetic needs of an office with a webcam. [Link]
Surprise Ending for Publishers: In 2020, Business Was Good by Elizabeth A. Harris (NYT)
Whether intrepid book buyers spent the pandemic reading or just telling themselves they were going to read, either way there has been an impressive wave of book buying this year. [Link; soft paywall]
Material Stories
How a ship-eating clam helped bring about the Industrial Revolution by David Fickling (Thread Reader)
An amazing rundown of how a desire to protect wood hulls lead to higher demand for copper, which led to more mines, and eventually led to the invention of the steam engine. [Link]
China’s Empire of Concrete by Mike Bird (WSJ)
Chinese municipalities long process of land privatization via sales of collectively owned property to the private sector have created a behemoth market that drives an impressive percentage of economic activity around the world. [Link; paywall]
Outflows
Cathie Wood’s Flagship Fund Posts Largest Outflow On Record by Claire Ballentine (Financial Advisor)
The most impressive asset-gathering story this year finished on a bit of a sour note, with tens of millions of assets flowing out of the ARK Innovation ETF (ARKK) at the end of the year. [Link]
Vaccination
Temperature Snag Delayed 144,000 Moderna Shots Bound for Texas by John Tozzi (Bloomberg)
Over 400 shipments of Moderna’s COVID vaccine sent to Texas had evidence that they had strayed above maximum storage temperature this week. [Link; soft paywall]
Social Media
The North Carolina Kid Who Cracked YouTube’s Secret Code by Lucas Shaw and Mark Bergen (Bloomberg)
A Greenville teenager dropped out of college to figure out exactly the best way to go viral. A bit over four years later, he is the king of YouTube. [Link; soft paywall]
Read Bespoke’s most actionable market research by joining Bespoke Premium today! Get started here.
Have a great weekend!
Bespoke Wealth Management
Bespoke Investment Group offers wealth management services for investors who are looking for a portfolio manager to handle either all or a portion of their assets. Bespoke offers management services for the following taxable and retirement account types:
- Individual
- Joint Tenants
- Trusts and Estates
- Traditional IRA
- Rollover IRA
- SEP IRA
- Simple IRA
- Individual Pension and 401k
Bespoke’s portfolio management team uses rigorous in-house research to construct portfolio strategies for investors based on their financial goals and needs. Bespoke offers multiple strategies, including aggressive growth, conservative growth, conservative income, and asset allocation models. We also run a “Triple Plays” strategy that holds names with strong earnings momentum.
Bespoke’s accounts are housed at Charles Schwab, which acts as custodian. Charles Schwab offers in-depth broker/dealer services with full transparency at all times. Bespoke has an account minimum of $200,000, and our management fee is 0.80% per year.
If you would like to learn more about Bespoke’s wealth management services and inquire about opening an account, please feel free to send us an email or give us a call at 914-315-1248.
You can access our most recent Form ADV Part 2 and Form CRS for additional information.
It’s Over
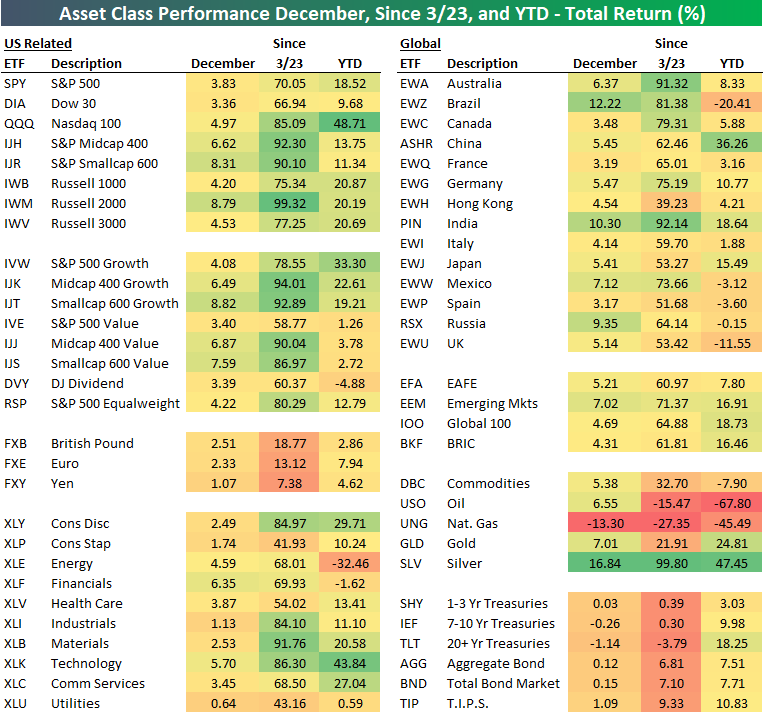
The 2020 market year is officially behind us, and for most of the ETFs in our Asset Class Performance Matrix is was a great year. The top-performing ETF in our matrix was the Nasdaq 100 (QQQ), which advanced 48.7% on a total return basis. Fittingly, in second place silver (SLV) posted a gain of 47.5%. Other big winners this year were large-cap growth (IVW), Consumer Discretionary, (XLY), Technology (XLK), Communication Services (XLC), and China (ASHR). All of these ETFs posted annual returns of more than 25%. On the downside, there were some big losers, though. Oil (USO) lost two-thirds of its value, while Natural Gas (UNG) dropped 45%. The only other ETFs that experienced declines of more than 20% were Brazil (EWZ) and Energy (XLE).
The middle column of our matrix shows each ETF’s total return since the 3/23 closing S&P 500 low. There were some truly mind-boggling returns as SLV, India (PIN), Australia (EWA), the Materials sector (XLB), Mid Cap Value (IJJ), Small Cap Growth (IJT), Mid Cap Growth (IJK), the Russell 2000 (IWM), the Small Cap S&P 600 (IJR), and the Mid Cap S&P 400 (IJH) all advanced 90% or more. Over that same span, the only ETFs that were down were long-term US Treasuries (TLT), UNG, and USO.
What was a very strong year for financial assets in 2020 was capped off with a strong December. In the US, every major index ETF was up at least 3%, every sector was positive, and every international ETF finished in the green. In fact, of the nearly 60 ETFs in the matrix, only three were down in December (IEF, TLT, and of course UNG).
Fifty to Zero in 283 Days
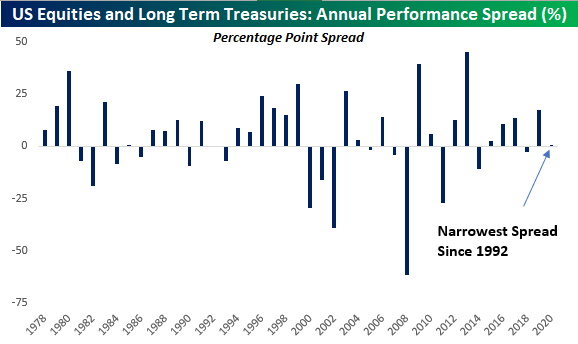
In a year with some pretty crazy charts, the one below is right up there with some of the best. After all the markets have been through this year, bot the S&P 500 and Long-Term Treasuries have seen nearly identical returns on a total return basis. That’s right, with just a few hours left in the trading year, the S&P 500’s total return in 2020 has been a gain of 17.6%, while Long Term US Treasuries, as measured by the B of A Merrill Lynch Long-Term Treasury Index has rallied 17.3%. What makes this nearly identical performance all the more incredible is that on March 23rd, the performance gap between the two was more than 50 percentage points.

The fact that stocks and bonds have essentially seen identical returns this year isn’t typical. The chart below shows the annual performance spread between the S&P 500 and long-term US Treasuries going back to 1978. During that time, the S&P 500 has historically outperformed long-term US Treasuries by an average of 3.9 percentage points per year, but the average gap in performance between the two has been over 15 percentage points. In the 43 years since 1978, there have only been seven other years where the performance spread between the two asset classes was less than five percentage points and just two years (1985 and 1992) where the performance spread was less than a percentage point.
Small Sentiment Shifts
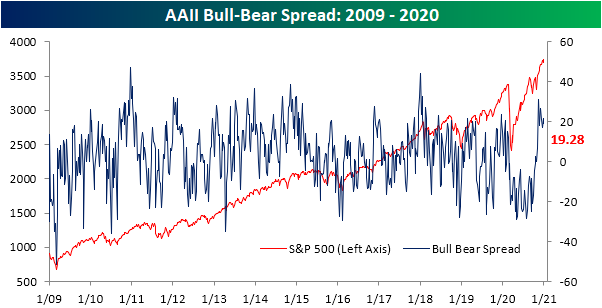
The S&P 500 has returned to and held up around record highs in the past week, and bullish sentiment has risen hand in hand. AAII’s weekly survey of individual investor sentiment rose from 43.57% up to 46.08% this week. While still off the peak of 55.84% from mid-November, bullish sentiment remains elevated relative to other readings not only this year but throughout the history of the survey. Given the bear market and a lack of recovery in sentiment until after the election was over and concrete vaccine news made headlines in November, the average reading on bullish sentiment in 2020 was 33.87%. That compares to the historical average over the life of the survey of 37.95%.

Last week saw bearish sentiment make a new low as it fell down to 21.99%; the lowest reading since the first week of 2020. That reversed this week as bearish sentiment rose nearly 5 percentage points to 26.8%. Just as with bullish sentiment, even off of more extreme levels of the past few weeks, the current level of bearish sentiment is still low when compared to where bearish sentiment has been for most of the year. This year, bearish sentiment averaged a reading of 38.83%, 12 points above current levels. As shown in the second chart below, that is the highest yearly average of bearish sentiment since 2009, and before that, 2008 and 1990 are the only years that have averaged higher readings of bearish sentiment.


It is more of the same with the bull-bear spread. At 19.28, sentiment still largely favors bulls though not to the same extreme as November. Current levels are not just well above those observed for most of the year, but also stand in the top decile of readings of the past five years’ range.
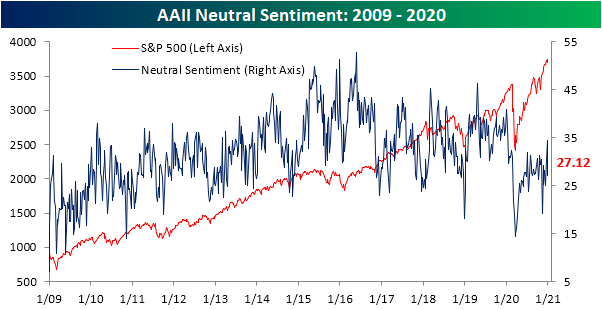
After rising back to levels not seen since the beginning of the year over the past couple of weeks, neutral sentiment saw a big drop this week of more than 7 percentage points rising from 34.4% to 27.12% which is just about in line with the average reading for 2020. That means that in the most recent week, investors appear to have become more polarized in their view of the markets, though, overall attitudes are more optimistic than pessimistic. Click here to view Bespoke’s premium membership options for our best research available.
Claims Improve Into Year’s End
Earlier this month, jobless claims had reversed much of the move lower that occurred throughout the fall when they topped out at 892K, the highest level since early September. Last week saw a significant improvement as claims fell back down to 806K and the improvements continued this week with a further drop to 787K. That was much better than expectations which had been calling for an increase to 835K. With the back to back declines over the past couple of weeks, claims are healthier but need to fall another 76K to take out the pandemic low of 711K from the first week of November. To move back below the pre-pandemic record high of 695K from 1982, claims would need to fall 92K from current levels. In other words, in spite of the past couple of weeks’ improvements, claims are going to kick off 2021 at what are still elevated levels both historically and relative to the lows of the past few months.

On a non-seasonally adjusted basis, this week similarly marked a solid improvement as claims fell from 872.8K down to 841.1K. That was the third week in a row that the unadjusted number was lower, but claims by this measure too have much further to go until they are back to their post-pandemic low of 718.5K from the last week of November; over 100K below current levels.
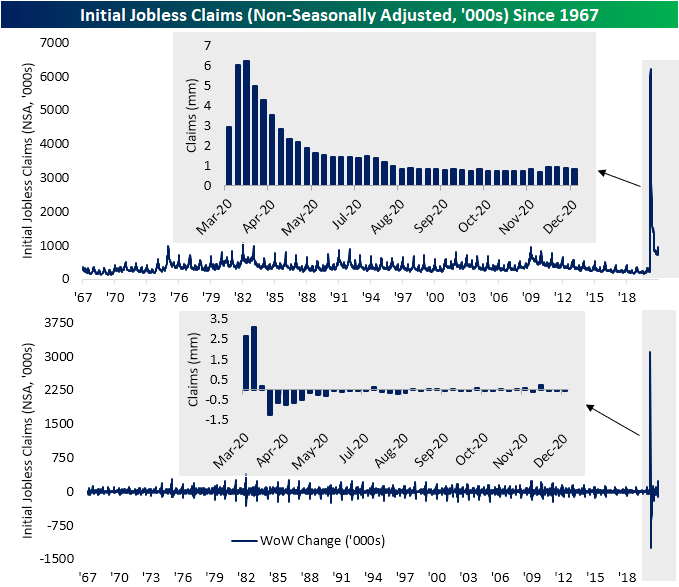
With the addition of other programs, namely Pandemic Unemployment Assistance (PUA) which extends jobless benefits to the likes of the self-employed and independent contractors, the picture is largely the same. Total initial claims between regular state and PUA programs totaled 1.149 million this week, down from 1.27 million last week. Both programs drove those declines with the regular state program accounting for 31.7K of that decline and an even larger 88.7K decline coming from PUA claims. Once again, while total claims between these programs have declined in back to back weeks, it is still off the past few months’ lows. We would also note in regards to the PUA program, the original provisions in the CARES Act set the program to close to new applicants at the end of the year, but with the relief bill signed over the weekend, this program will be extended through March 14th. The same also applies to the Pandemic Emergency Unemployment Compensation Program which adds another 13 weeks of payments to those who have exhausted regular state benefits.

As we have noted over the past few weeks, even though initial claims have been somewhat elevated (albeit improving) recently, continuing claims have uninterruptedly trended lower. Continuing claims came in at 5.219 million for the week of December 18th; the lowest level since March. With another decline this week, looking at the past half-year, seasonally adjusted continuing claims have fallen week over week for 22 of the past 26 weeks. Additionally, unlike seasonally adjusted initial claims which remain well above the pre-pandemic high, continuing claims have now fallen more than 1 million below the peak from the Global Financial Crisis years.

Including all programs for continuing claims adds another week’s lag to the data meaning the most recent week’s reading would be for December 11th. This more complete picture shows further broad declines in the number of people receiving jobless benefits. The total across all programs fell back below 20 million and sits just off the pandemic low of 19.077 million from the week of November 20th. Declines in the PUA program were the main driver dropping by more than 800K. Regular state claims experienced a much smaller 62.8K decline that same week. As we have frequently made mention of in recent months, while overall claims have improved, extension programs account for a growing share of existing claims. In fact, in the most recent week’s data, 29% of all claims were for extension programs. That was up roughly 1.5 percentage points from the previous week and set a new high for the pandemic. Some of that increased share is thanks to further declines in regular state and PUA programs. On the other hand, whereas PEUC claims were actually lower (-20.38K), a larger uptick in the Extended Benefits program (+89.83K) made up for the difference and added share of these types of programs. Click here to view Bespoke’s premium membership options for our best research available.

Bespoke’s Morning Lineup – 12/31/20 – Fin
See what’s driving market performance around the world in today’s Morning Lineup. Bespoke’s Morning Lineup is the best way to start your trading day. Read it now by starting a two-week free trial to Bespoke Premium. CLICK HERE to learn more and start your free trial.
“The record shows I took the blows and did it my way.” – Frank Sinatra, “My Way”
What most people around the world have been wishing for months now is finally starting to come true, and in some areas of the world, it already has. 2020 is coming to an end! Unfortunately, 2021 is going to start out looking a lot like 2020, but hopefully, by the end of the year, it’s looking more like something better.
In markets today, things are understandably quiet for the last trading day of the year. The only significant data point of the day is jobless claims. Initial claims came in lower than expected at 787K which was below consensus forecasts for a reading of 830K. Continuing Claims also came in more than 100K below the consensus forecast of 5.39 million and were the lowest of the COVID era. So, at least there’s some positive economic news to close out the year.
There’s typically not a lot of liquidity in markets on the last trading day of the year, so you never know what is going to happen, especially in the final minutes of trading for the year. However, whether we finish the day higher or lower, don’t read too much into it.
Be sure to check out today’s Morning Lineup for updates on the latest market news and events, a recap of global equity market performance, an update on the latest national and international COVID trends, and much more.

Nasdaq futures are currently indicating a higher open, and if it sticks through the closing bell, the index will have finished the day higher on 61.1% of all trading days in 2020. At that level, 2020 would rank as the fourth-highest percentage of positive days for a given year in the index’s history. The only three years that saw a higher percentage of positive days were 1978 (65.5%), 1979 (66.0%), and 1980 (64.0). The big difference between now and those three years, though, is that while in 2020 the Nasdaq is a well known and widely followed exchange where some of the largest companies in the world are listed, back in 1980, most people probably had no idea what the Nasdaq was.
If today ends up being a down day for the Nasdaq, 2020 would then fall into the fifth position in terms of the highest percentage of positive days, trailing 1989 (61.9%).

Growth Dragging on Small Caps
In the past couple of weeks, we have frequently been keeping tabs on small-cap equities which have been particularly strong performers of late resulting in very overbought readings as well as extended valuations. More specifically, taking a look at growth-oriented small-caps, with only a couple days left in the year small-cap growth stocks—proxied by the Russell 2000 Growth ETF (IWO)—are on pace to have outperformed large-cap equivalents in 2020. On December 10th, IWO surpassed the S&P 500 Growth ETF (IVW) in terms of YTD performance, and even after pulling back in the past week, IWO is still in the lead.
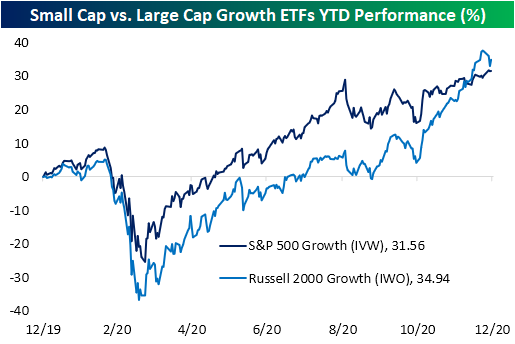
As a result of recent moves, there has been a sharp reversal on a relative basis between the two ETFs in the past week. In the chart below, we show the ratio of the Russell 2000 Growth ETF (IWO) versus the S&P 500 Growth ETF (IVW). This ratio took off beginning in the early fall meaning small-cap growth drastically outperformed large-cap growth. But the former’s weakness in the past several days has put a halt to that move.

As to just how sharp of a reversal this was, in the five days through yesterday’s close, the decline in the ratio of IWO to IVW was the largest since June. Before that, April and March saw declines that were even larger. Not only was this one of the biggest drops in the relative performance of small-cap growth to large-cap growth in the past few months, but that also stands in the bottom 0.5% of all readings going back to 2000 when the ETF first began trading. Outside of this past spring, the only other periods that have also experienced this type of underperformance of small-cap growth relative to large-cap growth was at various points in 2011, 2008, and a handful of times in the early 2000s.

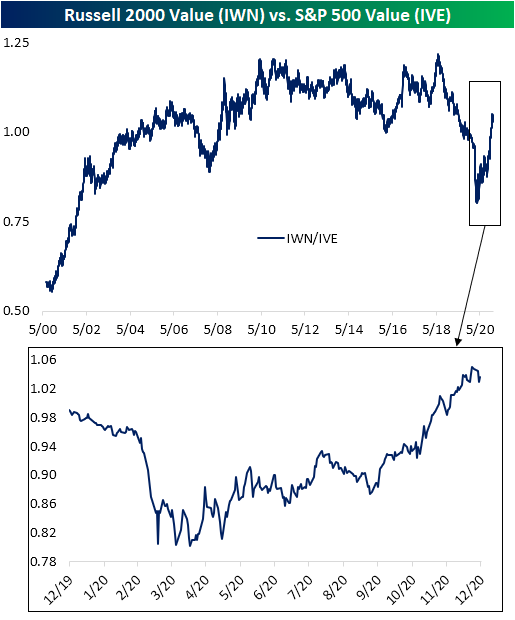
Small-cap underperformance has not necessarily been broad though. For value stocks, small caps (IWN) have generally outperformed large caps (IVE) for the entirety of the new bull market. While there was a bit of a turn lower in recent days, it has been nowhere close to as dramatic of a move as growth stocks.
In the charts below, we show average performance over the past week of Russell 2000 stocks broken into deciles based on their price to sales and price to book ratios. As shown, the most aggressively valued deciles have averaged the worst performance in the past week. Stocks with low P/S and P/B ratios have not been immune from the weakness, but they have held up significantly better. Click here to view Bespoke’s premium membership options for our best research available.

Back-to-Back Big Years for Technology
With just two trading days (including today) left in 2020, the S&P 500 Technology sector is on pace for its second year in a row of rallying more than 40%. Going back to 1990, the only time the Technology sector experienced back-to-back returns of more than 40% was in 1998 and 1999. Back then, not only was the Technology sector up 40%+ in back-to-back years, but it was also up over 75% in both of those years. If you think markets are pretty crazy these days, they still have nothing on the last two years of the 1990s!
In terms of cumulative returns, the Technology sector is up 210% since the last trading day of 2018, whereas in 1999 it was up 317% in a two-year span. What’s also interesting to note about the last 31 years of returns for the Technology sector is how it has only experienced five down years, while the S&P 500 has been down in ten different years during that span. Furthermore, since 2009 there has only been one down year and the decline was a paltry 1.6%. Not a bad 12-year run!

Given that the sector has more than doubled in the last two years, there have been some big individual winners. Topping the list with a gain of just under 400% is Advanced Micro Devices (AMD). On the last day of 2018, AMD traded hands for under $20 per share. Today’s it’s over $90. AMD has a lead of more than 100 percentage points over the next closest stock – NVIDIA (NVDA) – which is up 288%. Interestingly, there aren’t a lot of major outliers to the upside compared to the sector’s 210% gain, but that’s because Apple (AAPL), the sector’s largest stock, has paced the sector’s gains by rallying more than 240%.
On the downside, just four stocks in the Technology sector have declined in the last two years. The worst of these has been DXC Technology (DXC) which has lost more than half of its value, while Juniper (JNPR) and HP Enterprise (HPE) are down between 10% and 20%. Lastly, FLIR Systems (FLIR) has declined less than 2%, so depending on how it acts in the next two days, it could move into positive territory just as Intel (INTC) did yesterday after Third Point bailed it out and moved the stock barely into positive territory for the last two years.

Bespoke’s Morning Lineup – 12/30/20 – Drifting into Year End
See what’s driving market performance around the world in today’s Morning Lineup. Bespoke’s Morning Lineup is the best way to start your trading day. Read it now by starting a two-week free trial to Bespoke Premium. CLICK HERE to learn more and start your free trial.
“Charity is injurious unless it helps the recipient to become independent of it.” – John D. Rockefeller
Futures are higher this morning, but there’s very little news to speak of impacting the markets. What else do you expect on the second to last trading day of the year. In Washington, it seems unlikely that the Senate will pass the $2,000 check proposal that President Trump and the House have been pushing for, but the $600 checks have already started hitting the bank accounts of Americans who qualify.
Be sure to check out today’s Morning Lineup for updates on the latest market news and events, an update on the latest national and international COVID trends, and much more.
In a post yesterday, we highlighted the Energy sector and how a number of stocks in the sector, as well as the sector ETF (XLE) that tracks it, have experienced golden crosses with respect to their 50 and 200-day moving averages in recent trading. Golden crosses are considered bullish technical patterns that occur when a security’s shorter-term moving average crosses up through a longer-term moving average as both are rising. While the Energy sector ETF has already experienced a golden cross, the sector hasn’t quite completed the pattern, although at this point it’s only a matter of time before it follows suit.
Golden crosses may be considered bullish technical patterns in theory, but do they work in practice? We took a look at that trend in today’s Morning Lineup. Sign up for a free trial to find out!
