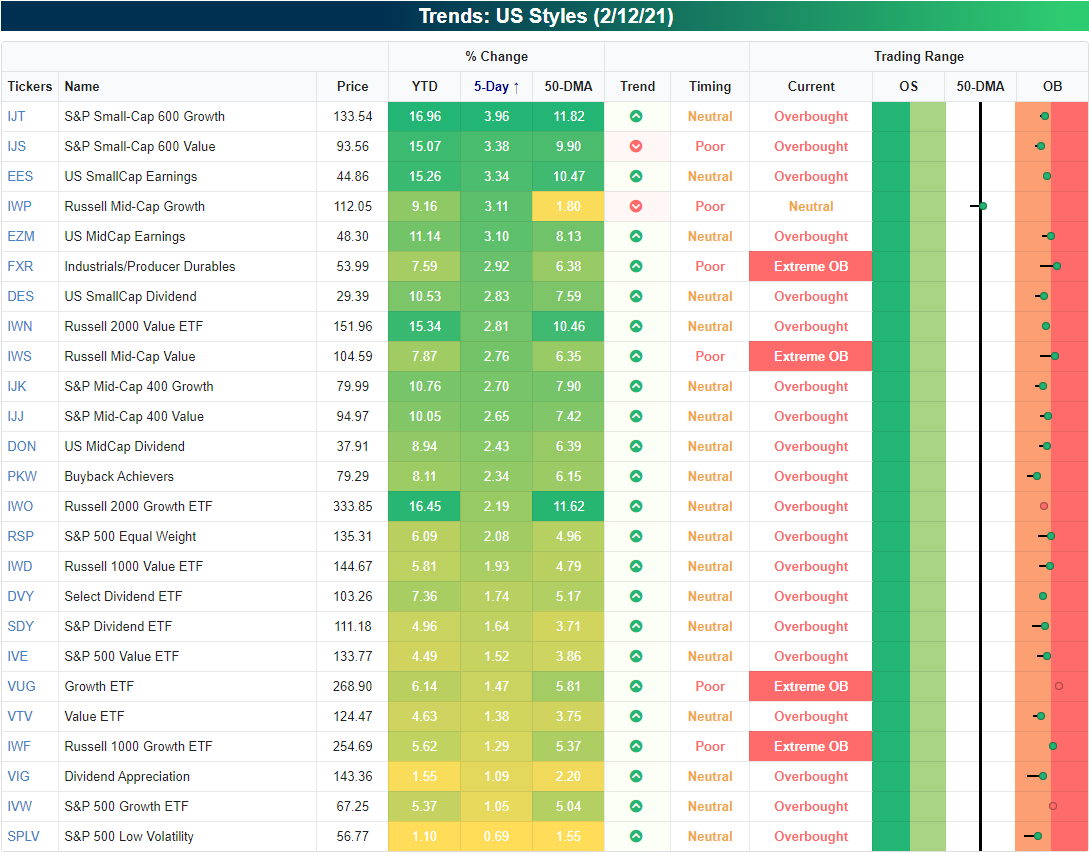
Small Cap Growth Taking the Lead
One of the topics we covered in last Friday’s Bespoke Report was the outperformance of small caps over the past year. Even on a much shorter time horizon, that outperformance has been evident. As shown in the snapshot of our Trend Analyzer below, in the five days ending last Friday and on a year to date basis, both Small Cap Growth (IJR) and Small Cap Value (IJS) have been two of the top-performing ETFs in our US Styles screen while large-cap counterparts have also been higher but with more modest gains. With a particular focus on growth stocks, while the S&P SmallCap 600 Growth (IJT) ETF was up the most of these ETFs last week with a 3.96% gain, the S&P 500 Growth ETF (IVW) was the second-worst performer after ‘only’ rising 1.05%. That continued a trend that has been in place YTD with the performance spread between the two ETFs topping ten percentage points.
We are coming up on the one-year anniversary of the last highs on February 19th, 2020 just before the COVID crash. For most of the past year since then, large-cap growth (IVW) had actually been outperforming small-cap growth (IJT), but since the new year began, small-cap growth has jumped ahead. Now, the S&P Small Cap Growth ETF (IJT) is up 35.31% since the 2/19/20 high compared to a 28.16% gain for the S&P 500 Growth ETF (IVW). As shown in the second chart below, IJT had been catching up on IVW for some time now though. The relative strength line of IJT versus IVW had been in a downtrend for most of the past five years meaning large-cap growth had been generally outperforming the small-cap counterpart. Since the lows last March, the line trended sideways meaning neither one saw significant outperformance, but come the fall, the line has taken off in favor of small caps. With more outperformance in the past week and a half, that line has turned sharply higher once again reaching the highest level since December of 2019 last week. Click here to view Bespoke’s premium membership options for our best research available.

Bespoke’s Morning Lineup – 2/16/21 – While You Were Out
See what’s driving market performance around the world in today’s Morning Lineup. Bespoke’s Morning Lineup is the best way to start your trading day. Read it now by starting a two-week free trial to Bespoke Premium. CLICK HERE to learn more and start your free trial.
“Finance is not merely about making money. It’s about achieving our deep goals and protecting the fruits of our labor. It’s about stewardship and, therefore, about achieving the good society.” – Robert J. Shiller
While you were on vacation over the long weekend, global risk assets continued to rally around the world. The most notable of these advances may have been bitcoin, which rallied right through this morning and briefly touched $50K before pulling back a bit in the time since. While it may have been nothing more than a coincidence, we couldn’t help but notice seeing headlines from St. Louis Fed President Bullard saying that the FOMC isn’t even thinking about thinking about raising interest rates interspersed with headlines regarding Bitcoin’s topping of $50K. In economic news this morning, the only data point was the Empire Manufacturing report which came in at twice the consensus forecast (12.1 vs 6.0), so the manufacturing sector appears to remain strong.
Be sure to check out today’s Morning Lineup for updates on the latest market news and events, earnings reports from around the world, economic data out of the UK, an update on the latest national and international COVID trends, and much more.

It was another strong week for global equities last week. While small caps led the way in the US, every US index ETF that we track in our Trend Analyzer tool posted positive returns. Micro-Caps, as measured by IWC surged 3.85%, but large and mega-cap ETFs were all up less than 1.5%. While the gains are fun if you’re long, market rallies inevitably cause short-term overbought conditions, and that’s exactly the environment we find ourselves heading into the holiday-shortened week. Every index ETF we track is currently at least at overbought conditions and seven are at ‘extreme’ levels. These types of overbought conditions ultimately need to be worked off through either a correction in time or price, and that’s why seven of the ETFs have timing scores that rank as ‘Poor’ while the rest are all neutral.

Bespoke Brunch Reads: 2/14/21
Welcome to Bespoke Brunch Reads — a linkfest of the favorite things we read over the past week. The links are mostly market related, but there are some other interesting subjects covered as well. We hope you enjoy the food for thought as a supplement to the research we provide you during the week.
While you’re here, join Bespoke Premium with a 30-day free trial!
Thinking Ahead
How airships could return to our crowded skies by Mark Piesing (BBC)
Airships are something of a perpetual “10 years away” technology, but new developments and experimentation are creating a real possibility of long-haul airship cargo. [Link; paywall]
Mini Nuclear Reactors Off Promise of Cheaper, Clean Power by Daniel Michaels (WSJ)
Nuclear power creates no carbon emissions, but radiation is something of a bummer. But new approaches and technologies offer the chance to spin up small scale nuclear plants that could support local power girds or private campuses. [Link; paywall]
Electric Vehicles
The Biden Team Wants to Transform the Economy. Really. by Noam Scheiber (NYT)
The new administration is focused on manufacturing and has settled on electric vehicles as a way to invest in American factories and the jobs they offer. [Link; soft paywall]
New battery tech to have major impact on EVs by Dom Tripolone (News.com.au)
An Israeli company claims that it’s developed a lithium-ion battery that can be recharged in 5 minutes, offering the possibility for extremely fast recharging that would eliminate one of the only downsides for electric vehicles. [Link; auto-playing video]
Policy Analysis
Inflation: The Good, The Bad, and The Transitory by Skanda Amaranth and Alex Williams (Employ America)
An interesting review of three possible scenarios for the economy this year, specifically focused on the trajectory of inflation and the steps policymakers take to respond to it. [Link]
Unemployment insurance, job search, and spending during the pandemic by Fiona Greig, Daniel M. Sullivan, Max Liebeskind, Peter Ganong, Pascal Noel, and Joseph Vavra (JP Morgan Chase Institute)
This research brief studies the impact of the supplemental $600/week unemployment insurance benefits enacted in the CARES Act as a way to provide stimulus and keep households afloat. The authors conclude that the payments played “little role” in discouraging people from finding work. [Link]
GameStop
Exclusive: How GameStop missed out on capitalizing on the Reddit rally by Jessica DiNapoli, Svea Herbst-Bayliss, and Joshua Franklin (Reuters)
GameStop was unable to issue stock to capitalize on the ramp in its share prices, mostly because it thought it would attract regulatory scrutiny for doing so before its earnings update. [Link]
28% of Americans bought GameStop or other viral stocks in January: Yahoo Finance-Harris Poll by Ethan Wolff-Mann (Yahoo!)
A new survey from Harris commission by Yahoo! Finance showed that over one-quarter of the country reported buying “meme” stocks during the surge in retail interest that drove a series of catastrophic short squeezes during the month. [Link; auto-playing video]
Earnings
Coleman Leads $23 Billion Payday for 15 Hedge Fund Earners by Tom Maloney and Hema Parmar (Bloomberg)
The fifteen largest hedge fund paydays in 2020 were worth a total of $23.2bn, mostly due to gains on investment in the funds that large investors manage. [Link; auto-playing video, soft paywall]
Health Care
N.Y.’s Vaccine Websites Weren’t Working. He Built a New One for $50. by Sharon Otterman (NYT)
With different levels of government rolling out the vaccine in different ways, technological fixes kludged together can sometimes make a big impact on access. [Link; soft paywall]
How Much Does a C-Section Cost? At One Hospital, Anywhere From $6,241 to $60,584. by Anna Wilde Mathews, Tom McGinty and Melanie Evans (WSJ)
Hospital procedures are a complete black box, with costs varying by tens of thousands of dollars. A Trump Administration rule is forcing hospitals to disclose pricing and the results are a complete mess. [Link; paywall]
Real Estate
Best week since 2019 for Manhattan luxury market by Sylvia Varnham O’Regan (The Real Deal)
Properties asking $4mm or more saw the largest volume week since November 2019 last week, with a total of 30 contracts signed (21 of which were condos). [Link]
‘Za
Pizza Was the Restaurant Hero of 2020 by Julie Creswell (NYT)
With the pandemic keeping millions at home, pizza is a cheap, easy, and familiar option as either delivery or pickup. The two largest delivery chains saw sales rise by millions of pies. [Link; soft paywall]
Read Bespoke’s most actionable market research by joining Bespoke Premium today! Get started here.
Have a great weekend!
Presidents’ Day Seasonality
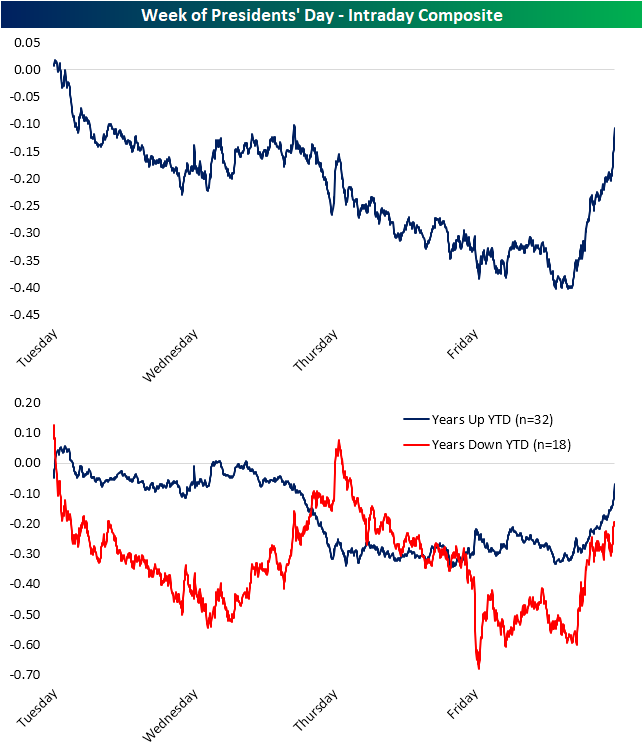
The US equity market will be closed on Monday in observance of the Presidents’ Day holiday. Since 1971 when the Uniform Monday Holiday Act set the third Monday in February, rather than on George Washington’s birthday (February 22nd) as the Federal holiday, equity market performance during the week of Presidents’ Day has been pretty mixed. From the Friday before President’s Day through the Friday after, the S&P 500 has traded higher half the time for an average decline of 5 bps. Taking a closer look, in the chart below we show the median returns by day for each trading day in Presidents’ week. Tuesday and Thursday have both averaged declines of 13 bps and 7 bps, respectively. Wednesday averages flat performance but the S&P 500 has only been higher 40% of the time. Despite weakness throughout most of the week, equities have tended to catch a bid by week’s end with an average 6 bps gain on Friday with a move higher 58% of the time.

In the charts below, we show the average intraday performance of the S&P 500 during Presidents’ Day week since 1983 when our intraday data begins. We also include looks for years when the S&P 500 was up and down YTD headed into the holiday. Again, the general pattern has been a steady drift lower until Friday when the S&P 500 has tended to rebound. We would note that the Friday rebound is not an all-day event. As shown, performance is pretty flat in the first several hours of trading with the biggest ramp higher occurring in the final of hours of tradings. That pattern is also consistent for both up and down years, though, in years that the S&P 500 was down YTD headed into the holiday there was a bit of a rebound midweek which was reversed by the end of the week. Click here to view Bespoke’s premium membership options for our best research available.
Bespoke’s Morning Lineup – 2/12/21 – A Global Tide
See what’s driving market performance around the world in today’s Morning Lineup. Bespoke’s Morning Lineup is the best way to start your trading day. Read it now by starting a two-week free trial to Bespoke Premium. CLICK HERE to learn more and start your free trial.
“Wherever we look upon this earth, the opportunities take shape within the problems.” – Nelson A. Rockefeller
It’s another quiet morning in the equity markets as futures are little changed ahead of the three-day weekend. There’s also little on the data calendar today besides Michigan Confidence at 10 AM. The key data point to watch in this release will be inflation expectations to see how sentiment towards prices is trending among consumers.
Be sure to check out today’s Morning Lineup for updates on the latest market news and events, earnings reports from around the world, economic data out of the UK, an update on the latest national and international COVID trends, and much more.
This market rally that started at the beginning of February has been a global tide lifting all boats. As shown in the chart below, the Bloomberg World Index has seen all green in its daily candlesticks and through Thursday was up nine days in a row taking the index to new highs.

At nine days and counting, the current winning streak for the Bloomberg World Index is the longest since early 2018 and one of only a few that have lasted this long since 2004.

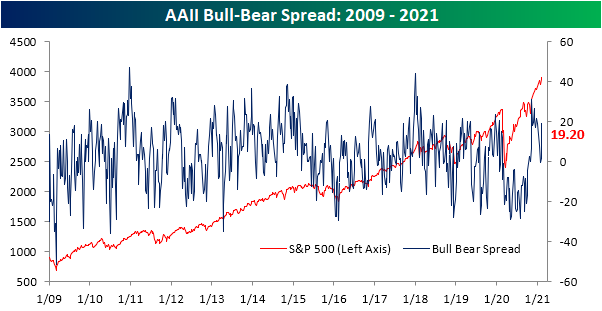
Bull-Bear Spread Spiking
Equities have been on a hot streak recently with the Dow and S&P 500 snapping six-day winning streaks earlier this week and the Russell 2,000 ended a seven-day winning streak on Wednesday. As a result, sentiment has understandably followed price action. The percentage of investors reporting as bullish in the AAII’s weekly survey has risen to 45.5% from 37.4% this week. That is a return back to similar levels to the end of 2020. The 8.1 percentage point jump this week was the largest for bullish sentiment since a 17.88 point increase on November 12th.

Inverse to bullish sentiment, bearish sentiment collapsed by 9.3 percentage points coming in at 26.3%. That is the lowest reading since the week of December 24th when less than a quarter of respondents were bearish. This week’s decline was in the bottom decile of weekly changes since the beginning of the survey and was also the largest drop in bearish sentiment since the week of October 17th when it fell by 12.91 percentage points.

The large moves in opposite directions of bullish and bearish sentiment led the bull-bear spread to leap from a barely positive reading of 1.8 all the way up to a five-week high of 19.2. That comes after it was actually negative only two weeks ago. The 17.4 point increase stands in the top 10% of all weekly changes in the spread and was the largest move higher in roughly three months since the week of November 12th when it rose 24.5 points.
Across the history of the AAII survey dating back to 1987, there have been 224 weeks including the most recent in which the bull-bear spread has risen by at least 15 points in a single week. Only 39 of those have occurred without another occurrence in the previous 3 months. Whereas historically, the AAII survey has been more of a contrarian indicator meaning more bullish sentiment has been followed by weaker returns and vice versa for more bearish readings, in terms of the second derivative of the bull-bear spread, big jumps have preceded stronger than normal returns. As shown below, past times that the bull-bear spread has risen at least 15 points in one week without another occurrence in the past 3 months, the S&P 500 has consistently traded higher over the next few weeks and months with average gains larger than the norm for each period. Moves higher have also been very frequent. One year after these past occurrences, the S&P 500 has traded higher better than 90% of the time.

While overall sentiment tipped bullish in a big way this week, neutral sentiment has also continued to rise. For the third week in a row, a greater share of respondents reported neutral sentiment. That reading rose to 28.3%, the highest since the week of Christmas. Click here to view Bespoke’s premium membership options for our best research available.

Good and Bad From Jobless Claims
Last week’s initial jobless claims print was higher by 33K to 812K which means it was unchanged from the prior week’s reading. While this week’s number didn’t meet expectations of a decline to 760K, it is not all bad news considering claims did drop to 793K which is the lowest level since the first week of the year.

On a non-seasonally adjusted basis, consistent with seasonal patterns, claims continue to fall with a 36.6K drop this week down to 813.1K. That is the lowest level in the unadjusted number since the week of November 27th when claims stood nearly 100K lower.

As for other programs, initial jobless claims through the Pandemic Unemployment Assistance (PUA) program also declined by a little over 34K this week just as they did last week. At 334.5K, PUA claims are at the lowest level since the week of January 8th. Combined with regular state claims, total initial claims stood at 1.148 million, down by 71K week over week and marking a fourth consecutive weekly decline. While total initial claims remain off the lows of just above 1 million from November, this week’s print marked a five-week low.

Regular state continuing claims—lagged one week to initial jobless claims—persistently keep moving lower with the most recent week falling to a new pandemic low of 4.545 million from 4.69 million last week. That week over week decline was a fourth straight also meaning 18 of the past 20 weeks have been met with a decline in continuing claims.

The addition of other programs adds another week’s lag to the data. That means the most recent data on continuing claims across all programs covers the week of January 22nd. In spite of the consistent declines in regular state continuing claims, the overall picture including these other programs muddies the water. There have been significant upticks in other programs that led total claims to significantly rise from 17.87 million to 20.47 million; the highest level since late November. Again, that uptick was not on account of regular state claims. In fact, it was one of the only programs to see a decline week over week falling by 29.6K. On the other hand, PUA claims rose by 1.497 million which comes after a 1.636 million increase two weeks prior. That was not the only program to see a week over week increase of over 1 million though. Pandemic Emergency Unemployment Compensation (PEUC)—which is an extension program for those whose benefits have or are set to expire—saw claims rise by 1.173 million. That is the single largest uptick since the program began earlier in the pandemic.
Those surges between the two programs meant that they also account for much larger shares of total claims than before. While the regular state claims only account for around a quarter of total claims- the lowest share since the pandemic related programs began in March- PUA claims take up 42.6% of all claims and PEUC claims account for 23.3%. That is the most since mid-December for both of these programs. While those significant increases are a concern and should continue to be watched for a better read on how material of an increase they are, it is possible that the upswings are due to continued catching up in reporting after these programs narrowly avoided expiration at the end of last year. For example, looking at individual states, PEUC claims out of California alone nearly tripled rising by over 1 million between the weeks of January 16th and January 23rd. Ohio also saw these claims more than double. As for PUA claims, after reporting zero claims the previous week, Colorado and Ohio reported claims of 30,659 and 10,156, respectively. Click here to view Bespoke’s premium membership options for our best research available.


Bespoke’s Morning Lineup – 2/11/21 – All Quiet…Except Bitcoin
See what’s driving market performance around the world in today’s Morning Lineup. Bespoke’s Morning Lineup is the best way to start your trading day. Read it now by starting a two-week free trial to Bespoke Premium. CLICK HERE to learn more and start your free trial.
“Be willing to make decisions. That’s the most important quality in a good leader. Don’t fall victim to what I call the Ready- Aim-Aim-Aim Syndrome. You must be willing to fire.” – T. Boone Pickens
With China celebrating the lunar new year, Asian markets had a quiet overnight session with little in the way of market action or economic data. The quiet trend continued into European and US markets as well with major averages and futures markets little changed on the sessions.
The only area of real action right now is in the crypto space. Bitcoin just briefly rallied to record highs on news that Mastercard (MA) would support crypto-currencies in its network, and then just about a half-hour ago Bank of New York Mellon announced that it was establishing a digital asset unit to support and service the digital asset needs of clients. Bitcoin’s price is off its highs from earlier, but it is still up over 6% on the day.
In economic data, jobless claims were just released, and while they both came in higher than expected, they did manage to decline from last week’s upwardly revised readings.
Be sure to check out today’s Morning Lineup for updates on the latest market news and events, earnings reports from around the world, an update on the latest national and international COVID trends, and much more.
In yesterday’s Chart of the Day, we discussed the massive rally in crude oil over the last several weeks and how it stacked up to prior periods in the past. Another short-term aspect of the recent rally has been the fact that yesterday marked the fifth straight day that WTI closed more than two standard deviations above its 50-DMA. That’s the first time we’ve seen a streak like that in over three years. Looking at past streaks going back to 2010, these readings didn’t necessarily mark the top of a short-term rally, but they usually occurred closer to the end of a move than the beginning.

Short Interest Update
Yesterday, bi-weekly short interest data was released for the period ending January 30th. In the chart below, we show the Russell 3000 broken up into deciles based on short interest as a percent of the float at the end of 2020 and these decile’s stock’s median change in short interest from then to yesterday’s release. As shown, with the short squeeze episode playing out in the second half of January, the stocks that came into 2020 the most heavily shorted have seen the biggest declines in short interest. That decile of what had been the most heavily shorted names has seen short interest as a percent of float fall for a median of 2.65 percentage points. Deciles two and three have similarly seen sizable declines, though, they are far smaller than those of the most shorted stocks. On the other hand, the decile of the least shorted stocks is the only one that has seen the median short interest reading move higher since the end of 2020.

In the table below, we show the stocks that currently have the highest short interest as a percent of float. After the historic move higher, short squeeze poster child GameStop (GME) is no longer the Russell 3000’s most heavily shorted name! Having dropped over 100 percentage points since the start of the year, only 42.61% of shares are now short compared to 43.57% for Gogo (GOGO); currently the most shorted stock in the index. GOGO has actually seen its shorts come off a bit this year as well but that decline has been far more modest of only a little more than one percentage point. Of the other stocks in the index, only Tanger Outlets (SKT) and Dillard’s (DDS) also currently have more than 40% of the float sold short.
On the January 27th closing high, GME was up 1,744.53% year to date. But with the short squeeze unwinding, the stock has fallen over 86%. Others of this cohort have similarly seen big reversals of their earlier surges. For example, National Beverage (FIZZ) had doubled YTD at the time of the GME peak, but since then it has been cut by 33.78%. Not all of these have been losers since the pinnacle of short selling though. Fulgent Genetics, which now has over 30% of shares short, has risen 91.01%. Clovis Oncology (CLVS) and Ligand Pharmaceuticals (LGND) have similarly seen big gains of over 30%.

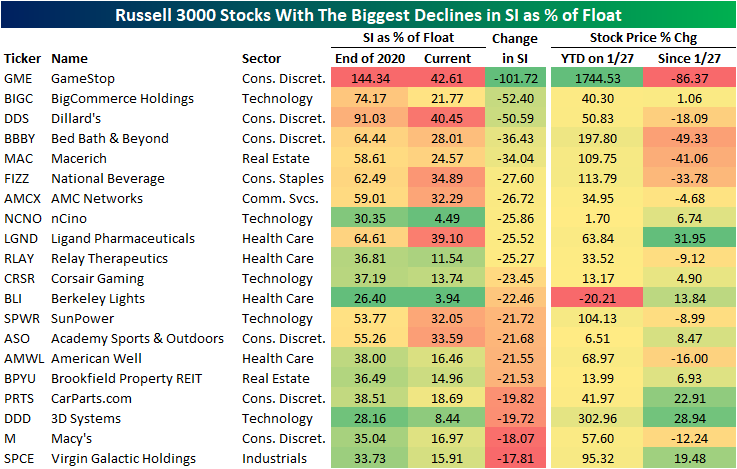
Given GME came into the year with an absurd number of shares sold short, the squeeze has resulted in it being the biggest decliner in terms of short interest of any Russell 3000 stock. Short interest as a percentage of float has fallen over 100 percentage points YTD. The next biggest drop came from BigCommerce Holdings (BIGC) and Dillard’s (DDS) which both saw larger than 50 percentage point drops. Of the rest of the top twenty biggest decliners, a baker’s dozen have seen short interest drop by at least 20 points. Additionally, of these stocks that have seen short interest fall the most, only three—nCino (NCNO), Berkeley Lights (BLI), and 3D Systems (DDD)—now have a single-digit short interest as a percent of float.
Given the massive short squeezes, there are far more stocks that now have a lower short interest as a percent of float than at the start of the year. In fact, of the Russell 3000 stocks, 1887 have seen declines in short interest compared to only 1146 that have seen an increase. In the table below, we show the twenty stocks to have seen the biggest increases in SIPF since the start of the year. As shown, there is only one, International Game Technology (IGT), that has seen short interest rise by double digits since the end of 2020.

Retailers notably dominate the list of stocks with the biggest declines in short interest. To quantify this, in the chart below we show the aggregate number of shorted shares as a percent of total float for each industry group as of the most recent short interest data and the end of 2020. As shown, just as it was at the start of the year, retailers remain the most heavily shorted industry group, but it has greatly improved with only 5.86% short compared to 8.15% at the end of 2020. That is the only industry group to have seen short interest drop by a full percentage point or more. The industry group to have experienced the next largest decline was Transportation with aggregate short interest falling from 5.08% to 4.13%. Conversely, there are two industries, Banks and Materials, that have higher short interest as a percent of float than they did at the end of 2020. Click here to view Bespoke’s premium membership options for our best research available.

Not All Fixed Income is Broken
So far this year, returns in the US treasury market have gotten off to a bad start. Based on the performance of the BofA indices, long-term US treasuries are already down over 5% YTD which would be only the second time in the last ten years that the asset class started off the year so poorly. While treasuries have been weak, not all areas of the fixed income market have performed poorly. In fact, high yield debt, which tends to be more closely correlated to the equity market, is having a much better year, gaining a bit over 1%.
The chart below shows the YTD performance spread between high yield and long-term US Treasuries 28 trading days into each year since 1995. With a current spread of over five percentage points, high yield is outperforming long-term Treasures by the widest margin since 2012 and the fifth widest margin since 1995. The only other years besides 2012 where the spread was wider were 2011, 2009, and 2001.

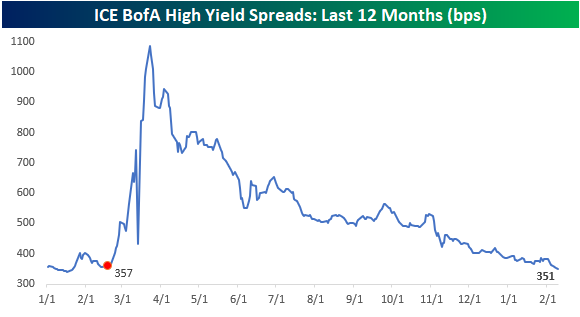
High yield has also achieved a pretty notable milestone this week as spreads relative to US Treasuries have narrowed to their lowest levels since the February 2020 pre-COVID peak in the S&P 500. On 2/19/20, when the S&P 500 peaked before the COVID crash, high yield spreads were at 357 basis points (bps). After finishing off last week at 358 bps, spreads have narrowed this week to the current level of 351 bps. It’s certainly been a wild year for the high yield market. Less than a year after spreads topped 1,000 bps and were within the 97th percentile of all historical readings, today spreads are two-thirds lower and just below the 20th percentile relative to all other readings. So, spreads are very low, but they’re not necessarily at a historical extreme. Click here to view Bespoke’s premium membership options for our best research available.