Another Record in Gun Background Checks
It seems to happen every month these days, so it shouldn’t come as much of a surprise that FBI background checks for the purchase of firearms hit a new record in March, rising by more than a million to 4,691,738. It used to be that background checks followed a relatively steady saw-tooth seasonal pattern where, as shown in the chart below, they would fall throughout the first half of the year, bottom out in mid-Summer, and then steadily rise throughout the second half of the year. That seasonal trend became less consistent in the early part of the last decade and has completely broken down in the last two years. Now, it seems that the monthly number of background checks goes in one direction – up!

Despite rising to new record highs, the pace of growth in background checks has started to slow down a bit. March’s growth rate was 25.4%, and while that is still an extremely rapid rate of increase, it’s at the low end of the range from the last year where the y/y change in checks peaked out at 79.2% last July in the midst of the nationwide protests around the country. Click here to view Bespoke’s premium membership options for our best research available.

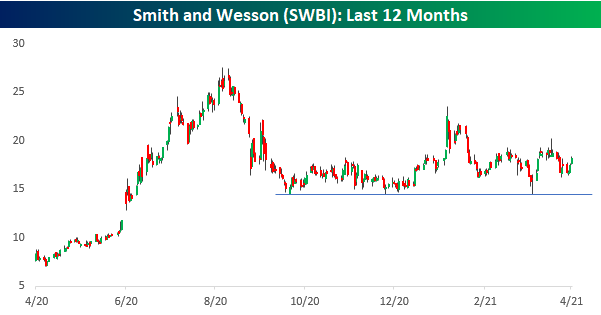
Just as the stock market and the economy don’t always move in lockstep with each other, the stocks of gun manufacturers don’t necessarily follow the path of gun background checks/sales. The charts below show the performance of the two largest publicly traded gun manufacturers over the last year – Sturm Ruger (RGR) and Smith and Wesson (SWBI). While background checks are at all-time highs, the prices of both stocks have corrected significantly from their highs last summer. After declines of 30%+ from peak to trough for both stocks, they have essentially been rangebound now for six months. However, while both stocks have been dead money, they haven’t broken down. In both cases, they have repeatedly bounced at support (~$60 for RGR and ~$15 for SWBI). As long as those levels continue to hold, they may be loaded with more than just blanks.

A Semi Snap Back
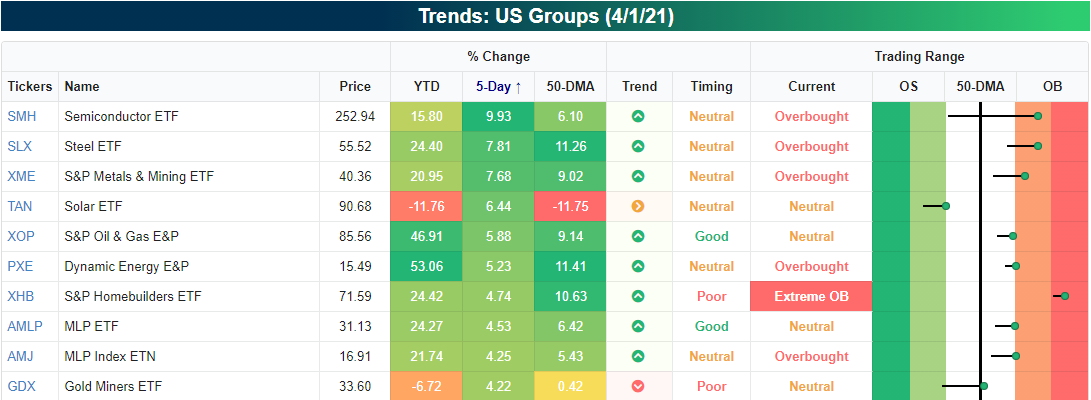
Headed into the long weekend, the Semiconductors (SMH) had been on a very impressive run over the prior five days. As shown in the snapshot of the US Groups screen in our Trend Analyzer, the group was the top performer (up just under 10%) in the five days ending last Thursday. That move brought it from well below its 50-DMA to deep into overbought territory.
While the Semiconductor ETF (SMH) is up again today, it is still over 1% below its highs from mid-February. Meanwhile, the Philadelphia Semiconductor Index (SOX) has already broken out to a new record intraday high this morning.

Today’s gain for the SOX adds to a 9.5% gain for the index last week. As shown in the chart below, that 9.5% rally is historically large, especially relative to the past several years. In fact, the five-day gain through Thursday’s close stands in the top 5% of all five-day runs for the index. While there was another occurrence as recently as the five days ending March 15th, moves of this size have been fairly uncommon in the past decade. Prior to the most recent and March occurrences, the only other recent instances were in November and the spring of last year. Prior to 2020, the past decade only saw a small handful of other instances of rallies in the 95th percentile or better. Conversely, the volatility of the Financial Crisis and the late 1990s and early 2000s led to more frequent clusters of top 5% moves.
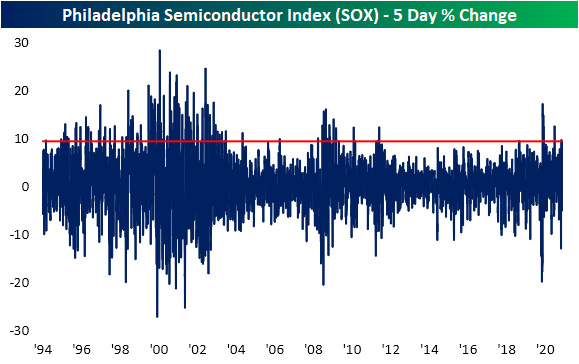
In the charts below, we show the performance of the semiconductor index following rallies that rank in the top 5% of all 5-day changes without another occurrence in the prior two weeks. The results show that there’s typically a near-term cool-down period after such a sharp one-week rally. One and two weeks later have both tended to underperform the norm (by 42 bps and 90 bps respectively), averaging declines with positive returns less than half the time. While there has been some near-term weakness, one month and a quarter out have both tended towards outperformance. Click here to view Bespoke’s premium membership options for our best research available.

Bespoke’s Morning Lineup – Market Gets Its Turn to React
See what’s driving market performance around the world in today’s Morning Lineup. Bespoke’s Morning Lineup is the best way to start your trading day. Read it now by starting a two-week free trial to Bespoke Premium. CLICK HERE to learn more and start your free trial.
“If the end doesn’t justify the means, what does?” – Robert Moses
After one of those rare instances where an economic report was released on a day when the equity market was closed, the stock market is finally getting its opportunity to react to Friday’s stronger-than-expected employment report. While most major equity indices around the world remain closed for the Easter holiday, US futures are higher across the board to the tune of roughly 0.5%. The one exception is small-caps where the gains at the open will likely be well over 1%.
Read today’s Morning Lineup for a recap of all the major market news and events including the latest US and international COVID trends as well as our series of charts tracking vaccinations, and much more.

Heading into the new week, we wanted to provide a quick snapshot of each S&P 500 sector’s price chart over the last 12 months. Two things about the charts immediately stand out to us. First, all eleven sectors are comfortably above their 50-DMAs which is a sign of healthy breadth across the market spectrum. Secondly, even though every sector is above its 50-DMA and the S&P 500 hit a record high on Thursday, the only sector that also traded at a 52-week high was Real Estate, which accounts for less than 2.5% of the entire index. To us this is a reflection of the healthy rotation we continue to see where when one sector starts to lag, others are there to quickly pick up the slack. In fact, there are currently no sectors that are even 10% from a 52-week high and only two (Energy and Utilities) that are down more than 5% from their respective 52-week highs.


Bespoke Brunch Reads: 4/4/21
Welcome to Bespoke Brunch Reads — a linkfest of the favorite things we read over the past week. The links are mostly market related, but there are some other interesting subjects covered as well. We hope you enjoy the food for thought as a supplement to the research we provide you during the week.
While you’re here, join Bespoke Premium with a 30-day free trial!
Archegos
One of World’s Greatest Hidden Fortunes Is Wiped Out in Days by Katherine Burton and Tom Maloney (Yahoo! Finance)
The family office of a disciple of legendary growth investor Julian Robertson ran a stock portfolio with tens of billions into the ground in the course of just a few short days. [Link]
Credit Suisse Bid for Tidy Archegos Fix Ends With Banks Brawling by Sridhar Natarajan and Donal Griffin (Bloomberg)
As Archegos’ portfolio was melting down, its prime brokers tried to stick together, but several banks started liquidating blocks of stock instead of holding the line, driving the entire group to sell at the worst possible time. [Link; soft paywall]
Demographics
U.S. Church Membership Falls Below Majority for First Time by Jeffrey M. Jones (Gallup)
For the first time in the history of Gallup’s polling, less than half of Americans report that they are a member of a church, synagogue, or mosque. More than three-quarters did at the end of World War 2, and more than two-thirds did in the mid-2000s. [Link]
Older Millennials Are Closing the Wealth Gap With Their Parents by Rachel Louise Ensign (WSJ)
Recent years have seen the wealth gap between younger Americans and their Baby Boomer parents decline after running dramatically behind for years following the global financial crisis. [Link; paywall]
Strong Economy
America’s Imports Are Stuck on Ships Floating Just Off Los Angeles by Kara Dapena and Dylan Moriarty (WSJ)
While the Ever Given got all the attention in the Suez, the bigger traffic jam is arguably found closer to American shores as dozens of ships wait for LA/Long Beach port capacity to free up. [Link; paywall]
Tilman Fertitta says he’s been surprised by strength of his restaurants and casinos in March by Kevin Stankiewicz (CNBC)
The CEO of the holding company which owns brands like Joe’s Crab Shack, Morton’s Steakhouse, and Golden Nugget casinos reports people “are going out in huge numbers now” or even “blowing numbers away”. [Link]
Pandemic Fails
Johnson & Johnson’s vaccine is delayed by a U.S. factory mixup. by Sharon LaFraniere and Noah Weiland (NYT)
A confusion over which ingredients were going where led an employee of a subcontractor to use AstraZeneca ingredients in a batch of Johnson & Johnson vaccines, ruining as many as 15mm doses of the one-shot vaccine. [Link; soft paywall]
The Pandemic’s Wrongest Man by Derek Thompson (The Atlantic)
At every turn, gadfly Alex Berenson has mislead, confused, and just generally been wrong in his widely-followed analysis of the COVID epidemic; this is at least a start on exhaustively cataloging his litany of errors. [Link]
Investing
ARK Innovation ETF’s Approach is Ill-Timed for a Major Twist by Robby Greenwald (Morningstar)
While cost-competitive, ARK Invest’s ETFs are dependent on portfolio manager Cathie Wood and at risk of extreme concentration, while holding very large exposures relative to the size of the companies it invests in that could create major liquidity stress. [Link]
Industry Analysis
Methane pollution soars in US as shale drilling resumes by Justin Jacobs (FT)
With oil prices up after COVID, shale drillers are back in business and with them are methane emissions, a potent greenhouse gas which is released as oil is fracked. [Link; paywall]
How HUD and NAHB Created the U.S. Housing Crisis by James A. Schmitz Jr., Arilton Teixeira, and Mark L. J. Wright (Minneapolis Fed Working Paper Slides)
A compelling argument that protectionist efforts by the traditional homebuilding industry to prevent market share gains for much cheaper manufactured housing has had innumerable pernicious effects on the broader US economy. [Link; 80 page PDF]
Read Bespoke’s most actionable market research by joining Bespoke Premium today! Get started here.
Have a great weekend!
Bespoke Market Calendar — April 2021
Please click the image below to view our April 2021 market calendar. This calendar includes the S&P 500’s average percentage change and average intraday chart pattern for each trading day during the upcoming month. It also includes market holidays and options expiration dates plus the dates of key economic indicator releases. Start a two-week free trial to one of Bespoke’s three research levels.

Sentiment Goes the Other Way of Price
The S&P 500 has risen around 2.5% to new record highs and crossing the 4,000 milestone in the past week. Despite this, optimism took a slight step back this week. The Investors Intelligence survey of newsletter writers released yesterday saw a lower share of respondents report as bullish; down from 57.4% last week to a three-week low of 54.4%. After coming in at the highest level in three months last week, the AAII’s sentiment survey also saw fewer respondents reporting as bullish. Last week, over half of respondents reported as bullish for the first time since November. Today, that reading has fallen to 45.8%. Despite the less optimistic tone, the 5.1 percentage point decline was the largest single-week drop in bullish sentiment since only the first week of March and the current level still stands in the top decile of the past five years. It is also over 7 percentage points higher than the historical average of 38%.

As bullish sentiment came in at a multi-month high last week, bearish sentiment fell to the lowest levels since December 2019. Bearish sentiment likewise saw a reversal this week as it rose 2.6 percentage points to 23.2%. Mirroring bullish sentiment, albeit off the low, the current level of bearish sentiment is still in the bottom 10% of readings of the past five years.
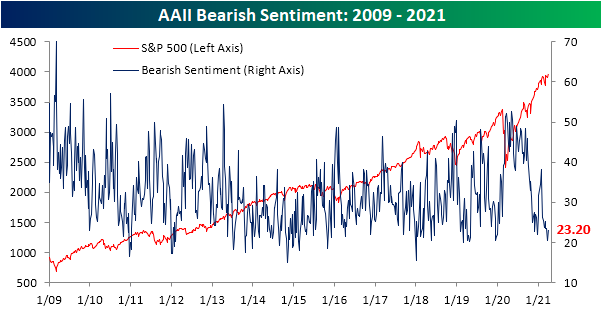
Those inverse moves in bullish and bearish sentiment have resulted in the bull-bear spread falling 2.7 points to 22.6. While that indicates a less optimistic tone than last week, the current reading shows that sentiment continues to largely favor the bulls. In fact, even after pulling back, the current reading sits in the top 5% of all weeks of the past 5 years.

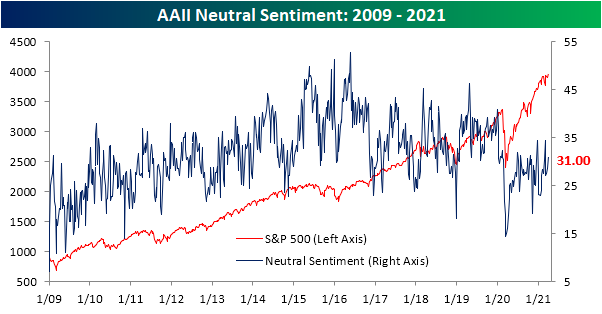
While fewer respondents reported as bullish this week, not all of those jumped ship to the bearish camp. Neutral sentiment picked up the difference rising 2.5 points to 31%. That is the first reading of over 30% and the highest since the first week of March when it had risen to 34.4%. While that is an elevated level relative to the past year in which sentiment has become more polarized between bullishness and bearishness, the current level of neutral sentiment is actually just below the historical average of 31.41%. Click here to view Bespoke’s premium membership options for our best research available.
Claims Miss Expectations But Sit Just Off Pandemic Lows
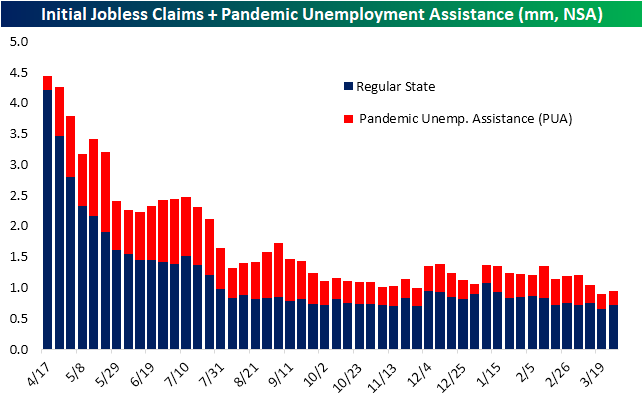
After coming in at a new low for the pandemic last week, a higher reading in initial jobless claims was expected this week with forecasts calling for a reading of 675K; up from a downward revision to 658K last week. Instead, claims rose by 61K to 719K. Although that is the biggest one-week increase since the second week of January when claims rose 123K, at 719K this week’s reading still managed to tie the last week of November for the second-lowest reading of the past year. Additionally, we would also note that this week is the first to reflect the annual revisions to the seasonal adjustment factors for both initial and continuing claims.

Unadjusted regular state claims were also higher rising from 651.2K last week to 714.4K. Again, this was the largest one-week increase since January. While regular state claims were weaker, Pandemic Unemployment Assistance (PUA) claims fell slightly to 237K. That sets a new low for the pandemic save for the first week that PUA claims debuted roughly one year ago and the first week of 2021 when there was the caveat that there were some lapses in claims as a result of the timing of the signing of the spending bill. Nonetheless, the larger uptick in regular state claims meant that, on a combined basis, claims did rise this week. Granted, at 951.4K total claims remained below 1 million in back-to-back weeks for the first time in the past year.
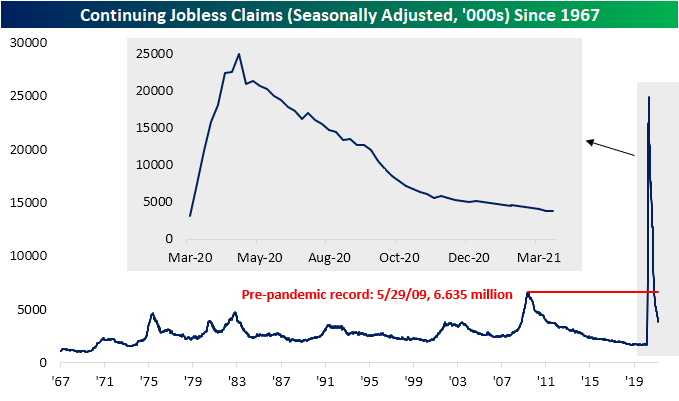
Like initial jobless claims, continuing claims also came in higher than expected (3.794 million vs. 3.75 million expected). While claims were above expectations, they did improve from last week’s reading of 3.87 million to set a new low for the pandemic. That also marked an eleventh consecutive week with lower continuing claims.
Factoring in all unemployment programs adds some lag to the data making the most recent data as of the week of March 12th. That week saw a broad decline across all programs as combined claims fell from 19.768 million to 18.247 million. The program that contributed the most to that decline was Pandemic Emergency Unemployment Compensation (PEUC) which fell by over 700K claims. That marks the program’s fourth-largest decline of the past year. Regular state and PUA claims also experienced significant declines.
Recently we have noted how a rising share of total claims belongs to programs like PEUC that extend benefits past the expiration of the regular benefit periods. For example, the previous week saw two of these programs, PEUC and Extended Benefits, account for 36.9% of all claims which was the highest level of the pandemic. That large decline in PEUC claims in the most recent week alongside a modest improvement in the Extended Benefits program resulted in that share declining by 1.1 percentage points. In other words, there is some evidence that there has been some improvement in the reading on people who are facing long-term unemployment. Click here to view Bespoke’s premium membership options for our best research available.


Bespoke’s Morning Lineup – 4/1/21 – A Fresh Start
See what’s driving market performance around the world in today’s Morning Lineup. Bespoke’s Morning Lineup is the best way to start your trading day. Read it now by starting a two-week free trial to Bespoke Premium. CLICK HERE to learn more and start your free trial.
“If the end doesn’t justify the means, what does?” – Robert Moses
One day after President Biden outlined his plans for infrastructure, we thought it fitting to turn to Robert Moses, the ruthless modern-day master of infrastructure, for today’s Quote of the Day. During the New Deal, when the Federal Government was looking for ‘shovel-ready’ projects, unlike most cities around the country that had ideas but no plans on how to implement them, Robert Moses was prepared and had both the ideas and the plans drawn up and ready to lay them out. As a result, New York City and the surrounding region received a large share of distributed funds. Ideas a good, but plans to implement them are just as, if not, even more important.
US futures are trading higher to kick off Q2 with Asia trading higher overnight and Europe also strong. Economic data from international markets has been strong as Manufacturing PMIs for the month of March continue to surge. The only US economic data so far today has been jobless claims, and on both an initial and continuing basis, the latest figures came in higher than expected.
Read today’s Morning Lineup for a recap of all the major market news and events including a recap of manufacturing economic data from around the world, a recap of international markets, the latest US and international COVID trends including our series of charts tracking vaccinations, and much more.
The first quarter of 2021 was a positive one for US stocks, but the quarter, like the majority of days in it didn’t end on a positive note. The S&P 500 finished the day in positive territory, but a last-hour sell-off clipped those gains considerably. Wednesday’s pattern was a microcosm of the pattern all year, where stocks open higher, rally throughout the trading day, and then sell-off in the last hour and into the close. How weak has the last hour of the trading day been? Well, throughout Q1, despite the S&P 500 trading higher on 54% of all trading days, the last hour was only positive 31% of the time! Relative to all other hourly intervals throughout the trading day, the last hour has been, by far, the least consistent to the upside.

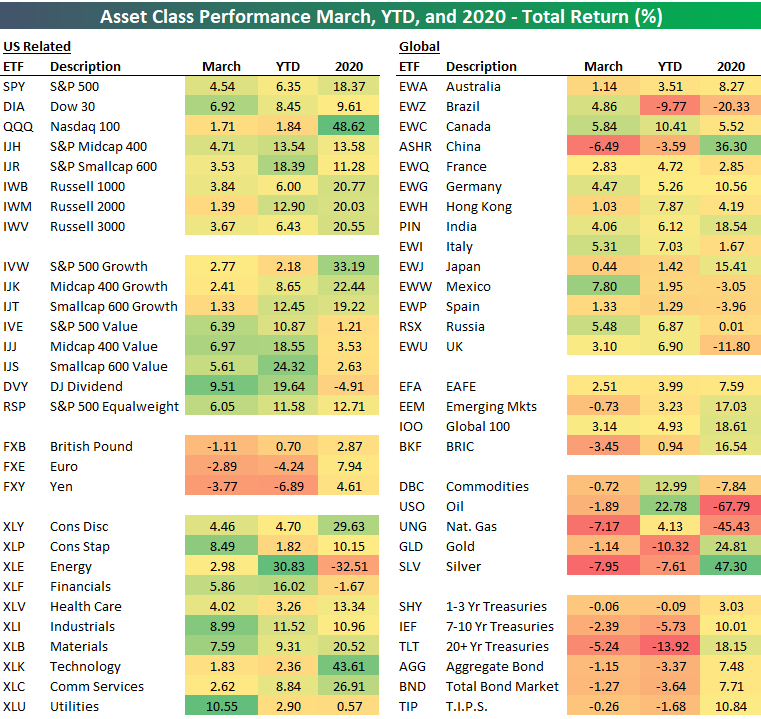
Asset Class Performance
The first quarter of 2021 came to a close on Wednesday, and while the first quarter of this year was not nearly as crazy as the first quarter of 2020, it was far from tranquil. Below we provide a snapshot of our ETF Asset Class Performance Matrix summarizing the total return of ETFs across the investment spectrum during the month of March, Q1, and for all of 2010.
Given the carnage we saw in some areas of the market recently, it may not seem that way but March was a very positive month for US equities across different styles and sectors. At the index level, the Dow led the way surging nearly 7%, but the S&P 500 was also very strong, gaining more than 4.5%. Large Cap Tech was an area of relative weakness, but even the Nasdaq 100 was up 1.71% (just about all of which came on the last trading day of the month). Continuing a trend that has been in place all year, value stocks left growth in the dust, more than doubling the gains of growth stocks during March. At the sector level, we saw both cyclicals and some defensives lead the way higher this month with Utilities rallying more than 10%, Industrials up 9%, Consumer Staples up 8.5%, and Materials up nearly 8%. While no sectors were down in March, Technology lagged the most by rallying ‘only’ 1.76%.
At the international level, it was a good month for North America as Mexico rallied 7.8% and Canada surged 5.8%. On the downside, the only country in the red for the month was China, which dropped 6.5%. What’s interesting to note about the performance of international markets is that like the US, a lot of areas that lagged in 2020 were leaders in March and vice versa for this year’s laggards.
While inflation has been a concern for investors lately, it’s interesting to note that all of the commodities in the matrix were down in March with Silver (SLV) and Natural Gas (UNG) falling the most. In the case of silver, while it was the second-best performing ETF in our matrix in 2020, it was the worst-performing ETF during the month of March.
Finally, fixed-income investors have had a rude awakening so far this year. While all of the fixed income-related ETFs saw positive returns in 2020, they’re all down so far in 2021. Long-term US Treasuries have been the biggest laggards as TLT is already down 13.9% YTD. So much for the ‘safety’ of Treasuries. Click here to view Bespoke’s premium membership options for our best research available.
Are the Financials and Energy Sectors Due for Rotation?
As we noted in today’s Morning Lineup and an earlier post, the Energy sector far and away has been the best performing S&P 500 sector in Q1. The sector is on pace to close out the quarter with a gain of just under 30%. That is nearly double the return of the next best performing sector: Financials. Granted, Financials have likewise been on an impressive run, gaining over 15%.
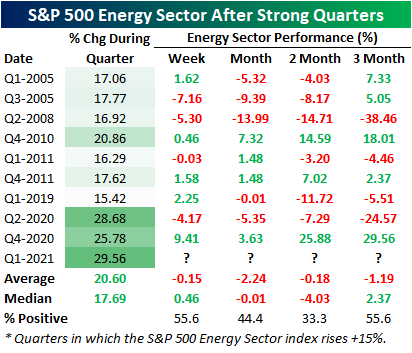
As shown in the charts below, going back to at least 1990, Q1 of 2021 is on pace to go down as the Energy sector’s single largest quarterly gain on record. Amazingly, the next two quarters that stand as runners-up have both come within the past year. Those were last quarter when the sector rose 25.78% and Q2 of 2020 when it rallied 28.68%. For the Financial sector, this quarter’s gain stands in the top decile of all quarterly moves of the past three decades, and that follows last quarter’s 22.52% gain which stands in the top 5%. As shown in the charts below, for both sectors, gains of 15% or more in a single quarter have been fairly uncommon with only a handful of past instances.
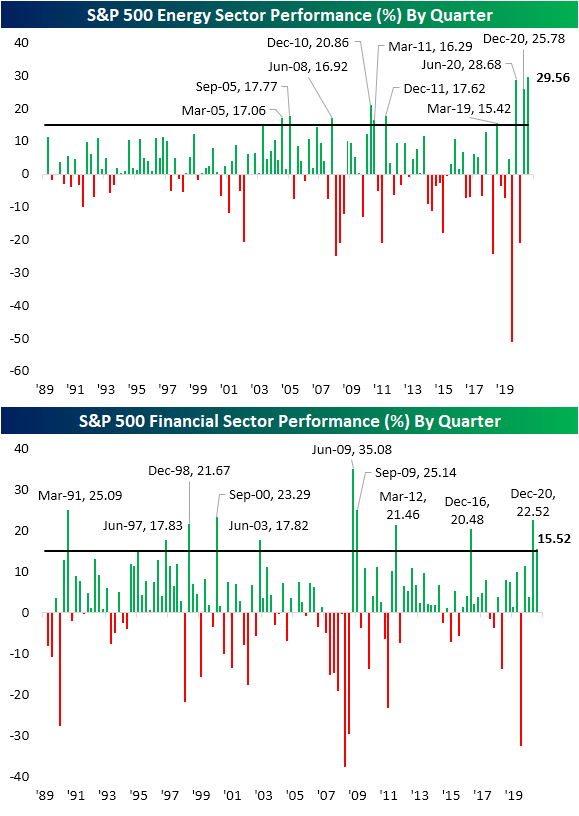
That brings to question if strong runs in one quarter result in rotation out of those sectors the following quarter. In the tables below, we show the performance of the Financials and Energy sectors from the end of quarters with gains of 15% or more. Starting with a look at Financials, that rotation has not necessarily always occurred as the sector has consistently risen over the following three months. Of the ten prior instances, there have only been two quarters, Q3 2009 and Q1 2012, in which Financials were lower by the end of the next quarter. Those were also some of the few times that Financials were lower at the end of the first and second month of the quarter. We would note, though, that the current instance is also the first time since 2009 that there have been back-to-back quarters that the sector has seen gains of 15% or more. Back during that last occurrence (Q3 2009), returns were in fact weaker after that second quarter of large gains.

As for the Energy sector, of the nine prior instances where the sector rallied over 15%, this was the first time with two sequential quarters boasting 15% or larger gains. Additionally, rotation out of Energy stocks has been far more commonplace. As shown in the table below, from the conclusion of those quarters with big gains, the sector has averaged a decline throughout the next quarter. Click here to view Bespoke’s premium membership options for our best research available.